Grundlæggende statistik
| Institutionelle aktier (lange) | 3.239.070.675 - 90,26% (ex 13D/G) - change of -414,18MM shares -11,34% MRQ |
| Institutionel værdi (lang) | $ 94.304.749 USD ($1000) |
Institutionelt ejerskab og aktionærer
Comcast Corporation (US:CMCSA) har 2456 institutionelle ejere og aktionærer, der har indsendt 13D/G- eller 13F-formularer til Securities Exchange Commission (SEC). Disse institutioner har i alt 3,239,468,957 aktier. Største aktionærer omfatter Vanguard Group Inc, BlackRock, Inc., State Street Corp, Capital World Investors, Dodge & Cox, Geode Capital Management, Llc, Norges Bank, Fmr Llc, Jpmorgan Chase & Co, and AWSHX - WASHINGTON MUTUAL INVESTORS FUND Class A .
Comcast Corporation (NasdaqGS:CMCSA) institutionel ejerskabsstruktur viser aktuelle positioner i virksomheden efter institutioner og fonde, samt seneste ændringer i positionsstørrelse. Større aktionærer kan omfatte individuelle investorer, investeringsforeninger, hedgefonde eller institutioner. Skema 13D angiver, at investoren besidder (eller besidder) mere end 5 % af virksomheden og har til hensigt (eller har til hensigt at) aktivt at forfølge en ændring i forretningsstrategi. Skema 13G indikerer en passiv investering på over 5%.
The share price as of March 13, 2026 is 30,16 / share. Previously, on March 17, 2025, the share price was 35,75 / share. This represents a decline of 15,64% over that period.

Fondens stemningsscore
Fund Sentiment Score (fka Ownership Accumulation Score) finder de aktier, der bliver mest købt af fonde. Det er resultatet af en sofistikeret, multi-faktor kvantitativ model, der identificerer virksomheder med de højeste niveauer af institutionel akkumulering. Scoringsmodellen bruger en kombination af den samlede stigning i oplyste ejere, ændringerne i porteføljeallokeringer i disse ejere og andre målinger. Tallet går fra 0 til 100, hvor højere tal indikerer et højere niveau af akkumulering for sine jævnaldrende, og 50 er gennemsnittet.
Opdateringsfrekvens: Dagligt
Se Ownership Explorer, som giver en liste over højest rangerende virksomheder.
AI+ Ask Fintel’s AI assistant about Comcast Corporation.
Select a question to share a public post with an AI-crafted answer.
Thinking of good questions…
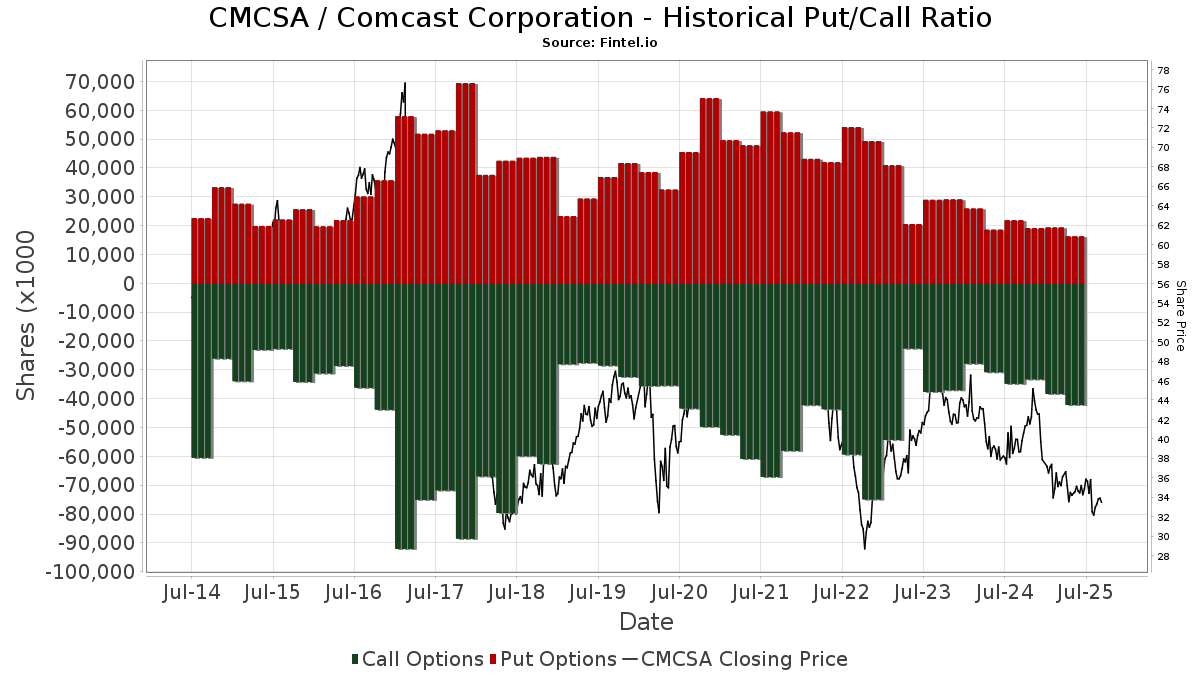
Institutionel Put/Call-forhold
Ud over at indberette standardaktie- og gældsudstedelser skal institutter med mere end 100 mill. aktiver under forvaltning også oplyse deres put- og call-optionsbeholdninger. Da salgsoptioner generelt indikerer negativ stemning, og købsoptioner indikerer positiv stemning, kan vi få en fornemmelse af den overordnede institutionelle stemning ved at plotte forholdet mellem put og kald. Diagrammet til højre viser det historiske put/call-forhold for dette instrument.
Brug af Put/Call Ratio som en indikator for investorernes stemning overvinder en af de vigtigste mangler ved at bruge totalt institutionelt ejerskab, som er, at en betydelig mængde af aktiver under forvaltning investeres passivt for at spore indekser. Passivt forvaltede fonde køber typisk ikke optioner, så indikatoren for put/call-forholdet følger mere nøje følelsen af aktivt forvaltede fonde.
13D/G-arkivering
Vi præsenterer 13D/G ansøgninger separat fra 13F ansøgninger på grund af den forskellige behandling af SEC. 13D/G-ansøgninger kan indgives af grupper af investorer (med én ledende), hvorimod 13F-ansøgninger ikke kan. Dette resulterer i situationer, hvor en investor kan indsende en 13D/G, der rapporterer én værdi for de samlede aktier (der repræsenterer alle de aktier, der ejes af investorgruppen), men derefter indsender en 13F, der rapporterer en anden værdi for de samlede aktier (der udelukkende repræsenterer deres egne) ejendomsret). Det betyder, at aktieejerskab af 13D/G-arkiver og 13F-arkiveringer ofte ikke er direkte sammenlignelige, så vi præsenterer dem separat.
Bemærk: Fra den 16. maj 2021 viser vi ikke længere ejere, der ikke har indsendt en 13D/G inden for det seneste år. Tidligere viste vi den fulde historie af 13D/G-arkiver. Generelt skal enheder, der er forpligtet til at indgive 13D/G-ansøgninger, indgive mindst årligt, før de indsender en afsluttende ansøgning. Dog forlader fonde nogle gange positioner uden at indsende en afsluttende ansøgning (dvs. de afvikler), så visning af den fulde historie resulterede nogle gange i forvirring om det nuværende ejerskab. For at undgå forvirring viser vi nu kun 'aktuelle' ejere - det vil sige - ejere, der har anmeldt inden for det seneste år.
Upgrade to unlock premium data.
| Fil dato | Form | Investor | Forrige Aktier |
Seneste Aktier |
Δ Aktier (Procent) |
Ejendomsret (Procent) |
Δ Ejerskab (Procent) |
|
|---|---|---|---|---|---|---|---|---|
| 2026-02-09 | STATE STREET CORP | 186,826,370 | 5.10 | |||||
| 2025-06-05 | VANGUARD GROUP INC | 378,000,220 | 373,581,278 | -1.17 | 10.03 | 6.59 |
13F og NPORT arkivering
Detaljer om 13F-arkivering er gratis. Detaljer om NP-ansøgninger kræver et premium-medlemskab. Grønne rækker angiver nye positioner. Røde rækker angiver lukkede positioner. Klik på linket ikon for at se den fulde transaktionshistorik.
Opgrader
for at låse premium-data op og eksportere til Excel ![]() .
.
Important Note
In an effort to reduce load times for our mobile users, we are testing some ways to deliver lighter pages.
In this first test, we will deliver only the most recent 750 transactions (out of 3073 for this stock). If you are interested in loading *all* the transactions for this company, click the "load all" button below. This is just a test and if you don't like it, please let us know by submitting some gentle feedback via the link at the bottom of this page.
Load All| Fil dato | Kilde | Investor | Type | Gennemsnitlig pris (Øst) |
Aktier | Δ Aktier (%) |
Rapporteret Værdi ($1000) |
Δ Værdi (%) |
Port Alloc (%) |
|
|---|---|---|---|---|---|---|---|---|---|---|
| 2026-02-03 | 13F | Lumbard & Kellner, LLC | 10.913 | 0,00 | 326 | -4,68 | ||||
| 2025-09-26 | NP | USISX - Income Stock Fund Shares | 724.856 | 0,00 | 24.087 | -2,84 | ||||
| 2026-02-09 | 13F | Tandem Investment Advisors, Inc. | 0 | -100,00 | 0 | |||||
| 2026-02-02 | 13F | Danske Bank A/s | 2.161.121 | 2,19 | 64.596 | -2,79 | ||||
| 2026-02-17 | 13F | Advanced Portfolio Management, LLC | 35.869 | -20,29 | 1.072 | -24,13 | ||||
| 2026-01-21 | 13F | Raleigh Capital Management Inc. | 6.772 | -17,22 | 202 | -21,40 | ||||
| 2026-02-09 | 13F | Legal & General Group Plc | 23.999.625 | -0,44 | 717.349 | -5,28 | ||||
| 2026-01-29 | 13F | Obermeyer Wood Investment Counsel, Lllp | 7.510 | -98,09 | 224 | -98,19 | ||||
| 2025-09-26 | NP | LCEAX - Invesco Diversified Dividend Fund Class A | 2.595.860 | 0,00 | 86.260 | -2,84 | ||||
| 2026-02-10 | 13F | Lido Advisors, LLC | 104.717 | -52,03 | 3.242 | -52,75 | ||||
| 2026-01-29 | 13F | Dunhill Financial, LLC | 119 | 41,67 | 4 | 50,00 | ||||
| 2025-09-29 | NP | QTR - Global X NASDAQ 100 Tail Risk ETF This fund is a listed as child fund of Mirae Asset Global Investments Co., Ltd. and if that institution has disclosed ownership in this security, then these positions will not be double counted when calculating total shares and total value | 567 | -3,74 | 19 | -10,00 | ||||
| 2026-01-20 | 13F | AdvisorNet Financial, Inc | 11.110 | 0,31 | 332 | -4,60 | ||||
| 2025-11-14 | 13F | Point72 Hong Kong Ltd | 0 | -100,00 | 0 | -100,00 | ||||
| 2025-09-26 | NP | JHAAX - Multi-Asset Absolute Return Fund Class A | 53.970 | -7,50 | 1.793 | -10,13 | ||||
| 2026-01-13 | 13F | Synergy Financial Management, LLC | 0 | -100,00 | 0 | |||||
| 2026-02-09 | 13F | Knights of Columbus Asset Advisors LLC | 174.461 | -31,67 | 5.215 | -35,00 | ||||
| 2026-02-10 | 13F | Westpac Banking Corp | 32.589 | 70,60 | 974 | 62,33 | ||||
| 2026-01-08 | 13F | Sanders Morris Harris Llc | 0 | -100,00 | 0 | -100,00 | ||||
| 2026-01-21 | 13F | SJS Investment Consulting Inc. | 3.702 | 32,88 | 111 | 26,44 | ||||
| 2025-09-25 | NP | DFUV - Dimensional US Marketwide Value ETF | 2.944.788 | -6,74 | 97.855 | -9,38 | ||||
| 2026-02-17 | 13F | Jump Financial, LLC | 62.623 | -95,29 | 1.872 | -95,52 | ||||
| 2026-02-17 | 13F | CHICAGO TRUST Co NA | 0 | -100,00 | 0 | |||||
| 2025-09-23 | NP | EPLIX - MainStay Epoch U.S. Equity Yield Fund Investor Class | 337.653 | -0,85 | 11.220 | -3,66 | ||||
| 2026-02-13 | 13F | Soros Fund Management Llc | 73.440 | 2.195 | ||||||
| 2025-09-24 | NP | REVS - Columbia Research Enhanced Value ETF | 12.412 | -16,57 | 412 | -18,90 | ||||
| 2026-01-16 | 13F | Hopwood Financial Services, Inc. | 0 | -100,00 | 0 | |||||
| 2026-02-13 | 13F | Cladis Investment Advisory, LLC | 7.650 | 0,00 | 229 | -5,00 | ||||
| 2026-02-17 | 13F | Integrated Advisors Network LLC | 23.869 | -37,04 | 713 | -40,13 | ||||
| 2026-02-12 | 13F | M&G Plc | 443.880 | 18,34 | 13.316 | 14,53 | ||||
| 2026-02-13 | 13F | Searle & Co. | 0 | -100,00 | 0 | |||||
| 2026-02-17 | 13F | Bank Of America Corp /de/ | Put | 0 | -100,00 | 0 | ||||
| 2025-11-17 | 13F | Vivaldi Capital Management, LLC | 0 | -100,00 | 0 | -100,00 | ||||
| 2026-02-13 | 13F | Sienna Gestion | 343.574 | 0,00 | 10.246 | 4,09 | ||||
| 2026-02-12 | 13F | Raiffeisen Bank International AG | 102.134 | 85,49 | 3.061 | 76,57 | ||||
| 2025-09-25 | NP | Dfa Investment Dimensions Group Inc - Va U.s. Large Value Portfolio This fund is a listed as child fund of Dimensional Fund Advisors Lp and if that institution has disclosed ownership in this security, then these positions will not be double counted when calculating total shares and total value | 191.883 | 0,00 | 6.376 | -2,83 | ||||
| 2026-02-17 | 13F | Bank Of America Corp /de/ | Call | 0 | -100,00 | 0 | ||||
| 2026-01-26 | 13F | Chicago Capital, LLC | 61.770 | -2,00 | 1.846 | -6,77 | ||||
| 2026-02-06 | 13F | Cullen/frost Bankers, Inc. | 364.253 | 1,75 | 10.888 | -3,21 | ||||
| 2025-09-26 | NP | SUNAMERICA SERIES TRUST - SA MFS Total Return Portfolio Class 1 | 200.492 | 1,28 | 6.662 | -1,60 | ||||
| 2026-02-13 | 13F | Pinnacle Wealth Planning Services, Inc. | 9.080 | -26,12 | 271 | -29,79 | ||||
| 2026-01-22 | 13F | City Holding Co | 2.612 | -50,59 | 78 | -53,01 | ||||
| 2026-01-21 | 13F | Clayton Financial Group LLC | 545 | 498,90 | 16 | 700,00 | ||||
| 2026-02-13 | 13F | Manufacturers Life Insurance Company, The | 0 | -100,00 | 0 | |||||
| 2026-02-17 | 13F | Magnetar Financial LLC | 86.688 | -69,76 | 2.591 | -71,23 | ||||
| 2026-01-30 | 13F | Woodside Wealth Management LLC | 7.191 | 215 | ||||||
| 2026-02-10 | 13F | Quantbot Technologies LP | 0 | -100,00 | 0 | |||||
| 2025-10-07 | 13F | GFG Capital, LLC | 0 | -100,00 | 0 | -100,00 | ||||
| 2026-01-14 | 13F | Mitchell & Pahl Private Wealth, Llc | 91.878 | 1,45 | 2.746 | -3,48 | ||||
| 2026-02-06 | 13F | Twin Capital Management Inc | 84.220 | -28,51 | 2.517 | -31,99 | ||||
| 2026-02-17 | 13F | DZ BANK AG Deutsche Zentral Genossenschafts Bank, Frankfurt am Main | 0 | -100,00 | 0 | |||||
| 2025-10-22 | 13F | Northstar Asset Management Llc | 0 | -100,00 | 0 | |||||
| 2026-02-17 | 13F | Signature Equity Partners, LLC | 2.018 | 60 | ||||||
| 2026-02-13 | 13F | United Bank | 13.179 | 0,00 | 394 | -5,07 | ||||
| 2025-11-05 | 13F | Lokken Investment Group LLC | 37.257 | 1.171 | ||||||
| 2026-02-05 | 13F | AlphaCore Capital LLC | 25.363 | -4,00 | 758 | -8,67 | ||||
| 2025-09-25 | NP | DFVEX - U.s. Vector Equity Portfolio - Institutional Class This fund is a listed as child fund of Dimensional Fund Advisors Lp and if that institution has disclosed ownership in this security, then these positions will not be double counted when calculating total shares and total value | 281.916 | -29,73 | 9.368 | -31,72 | ||||
| 2026-02-10 | 13F | Core Wealth Advisors, Llc | 181 | 5 | ||||||
| 2026-02-17 | 13F | Snowden Capital Advisors LLC | 119.674 | -69,04 | 3.577 | -70,55 | ||||
| 2026-02-13 | 13F | Level Four Advisory Services, Llc | 111.142 | -29,17 | 3.322 | -32,62 | ||||
| 2025-11-06 | 13F | DDD Partners, LLC | 0 | -100,00 | 0 | |||||
| 2026-01-26 | 13F | JNBA Financial Advisors | 1.043 | -27,72 | 31 | -31,11 | ||||
| 2026-02-10 | 13F | Ellevest, Inc. | 11.699 | 27,01 | 350 | 20,76 | ||||
| 2026-02-17 | 13F | Clearline Capital LP | 287.751 | 8.601 | ||||||
| 2026-02-18 | 13F | EP Wealth Advisors, Inc. | 266.031 | -76,35 | 7.952 | -80,19 | ||||
| 2026-02-11 | 13F | Picton Mahoney Asset Management | 127.479 | 3.810 | ||||||
| 2026-02-13 | 13F | Portfolio Resources Advisor Group, Inc. | 87 | 3 | ||||||
| 2026-02-13 | 13F | Diametric Capital, LP | 81.172 | 543,46 | 2.273 | 473,74 | ||||
| 2026-01-20 | 13F | Toth Financial Advisory Corp | 3.656 | -3,00 | 109 | -7,63 | ||||
| 2026-02-23 | 13F | Virtu Financial LLC | 0 | -100,00 | 0 | |||||
| 2026-01-20 | 13F | Steel Peak Wealth Management LLC | 0 | -100,00 | 0 | |||||
| 2025-09-24 | NP | RECS - Columbia Research Enhanced Core ETF | 255.094 | 411,64 | 8.477 | 346,11 | ||||
| 2026-01-15 | 13F | Ironwood Financial, llc | 14.748 | 0,00 | 429 | -7,56 | ||||
| 2026-02-12 | 13F | Conservest Capital Advisors, Inc. | 38.489 | 0,09 | 1.150 | -4,80 | ||||
| 2026-01-22 | 13F | Monte Financial Group, LLC | 40.557 | -79,33 | 1.212 | -80,34 | ||||
| 2026-01-28 | 13F | Mowery & Schoenfeld Wealth Management, LLC | 3.689 | -4,21 | 110 | -9,09 | ||||
| 2026-02-17 | 13F | Sagewood Asset Management LP | 29.671 | 887 | ||||||
| 2026-02-12 | 13F | Advisors Asset Management, Inc. | 711.717 | 15,15 | 21.273 | 9,55 | ||||
| 2025-09-26 | NP | PWV - Invesco Dynamic Large Cap Value ETF This fund is a listed as child fund of Invesco Ltd. and if that institution has disclosed ownership in this security, then these positions will not be double counted when calculating total shares and total value | 444.969 | -44,37 | 14.786 | -55,21 | ||||
| 2026-02-13 | 13F | Neuberger Berman Group LLC | 915.589 | -0,74 | 27.367 | -5,38 | ||||
| 2026-01-14 | 13F | Southland Equity Partners LLC | 7.233 | -7,97 | 216 | -12,20 | ||||
| 2026-02-17 | 13F | Twinbeech Capital Lp | 0 | -100,00 | 0 | -100,00 | ||||
| 2025-09-26 | NP | INVESCO ACTIVELY MANAGED EXCHANGE-TRADED FUND TRUST - Invesco S&P 500 Equal Weight Income Advantage ETF | 17.336 | 33,72 | 576 | 30,02 | ||||
| 2026-02-13 | 13F | Resources Management Corp /ct/ /adv | 1.208 | -38,77 | 0 | |||||
| 2025-11-14 | 13F | ExodusPoint Capital Management, LP | 441.882 | 107,82 | 13.884 | 198.228,57 | ||||
| 2026-02-05 | 13F | RiverFront Investment Group, LLC | 8.645 | 16,15 | 258 | 10,73 | ||||
| 2025-10-24 | 13F | Philip James Wealth Mangement, LLC | 0 | -100,00 | 0 | -100,00 | ||||
| 2026-02-13 | 13F | Pathstone Holdings, LLC | 1.196.428 | -4,44 | 35.761 | -9,09 | ||||
| 2026-02-02 | 13F | Mutual Advisors, LLC | 44.227 | -1,70 | 1.322 | 0,23 | ||||
| 2026-02-13 | 13F | Chevy Chase Trust Holdings, Inc. | 1.859.227 | -1,81 | 55.572 | -6,59 | ||||
| 2025-09-23 | NP | CFIPX - QS Global Equity Fund Class A | 52.130 | 0,00 | 1.732 | -2,81 | ||||
| 2025-09-26 | NP | BLUC - Bluemonte Large Cap Core ETF | 18 | 1 | ||||||
| 2025-09-29 | NP | CRTVX - CATHOLIC RESPONSIBLE INVESTMENTS MULTI-STYLE US EQUITY FUND Investor Shares | 4.986 | -45,00 | 166 | -46,77 | ||||
| 2026-02-09 | 13F | Tiff Advisory Services Inc | 17 | 1 | ||||||
| 2026-02-13 | 13F | Whalerock Point Partners, Llc | 25.981 | -6,48 | 777 | -11,01 | ||||
| 2026-02-17 | 13F | Css Llc/il | 24.408 | -49,27 | 730 | -51,75 | ||||
| 2025-09-29 | NP | KCVIX - Knights of Columbus Large Cap Value Fund I Shares | 82.633 | 2,76 | 2.746 | -0,18 | ||||
| 2026-01-02 | 13F | Boltwood Capital Management | 0 | -100,00 | 0 | |||||
| 2026-02-06 | 13F | Creative Financial Designs Inc /adv | 4.057 | -5,87 | 121 | -10,37 | ||||
| 2026-01-20 | 13F | Savvy Advisors, Inc. | 22.672 | -3,83 | 678 | -8,51 | ||||
| 2026-02-17 | 13F | Jain Global LLC | Call | 92.500 | 2.765 | |||||
| 2026-01-27 | 13F | Birch Hill Investment Advisors LLC | 6.918 | -15,41 | 207 | -19,53 | ||||
| 2026-02-02 | 13F | Strs Ohio | 2.173.257 | -2,00 | 64.959 | -6,77 | ||||
| 2026-02-05 | 13F | Chancellor Financial Group WB LP | 0 | -100,00 | 0 | |||||
| 2026-01-09 | 13F | Community Trust & Investment Co | 93.626 | 14,80 | 2.798 | 9,21 | ||||
| 2026-02-17 | 13F | Alliancebernstein L.p. | 5.365.502 | -32,10 | 160.375 | -35,41 | ||||
| 2025-09-26 | NP | FEKFX - Fidelity Equity-Income K6 Fund This fund is a listed as child fund of Fmr Llc and if that institution has disclosed ownership in this security, then these positions will not be double counted when calculating total shares and total value | 57.939 | -11,88 | 1.925 | -14,37 | ||||
| 2026-01-14 | 13F | Centurion Wealth Management LLC | 11.508 | -23,35 | 344 | -27,18 | ||||
| 2026-01-23 | 13F | Rede Wealth, LLC | 0 | -100,00 | 0 | |||||
| 2026-02-13 | 13F | Blueshift Asset Management, LLC | 0 | -100,00 | 0 | |||||
| 2026-02-13 | 13F | Healthcare Of Ontario Pension Plan Trust Fund | 1.256.690 | -70,21 | 37.562 | -71,66 | ||||
| 2026-01-12 | 13F | Brucke Financial, Inc. | 26.923 | 46,57 | 805 | 57,34 | ||||
| 2026-02-10 | 13F | Commonwealth Of Pennsylvania Public School Empls Retrmt Sys | 845.393 | -4,41 | 25.269 | -9,06 | ||||
| 2026-02-13 | 13F | Ariadne Wealth Management, LP | 8.927 | 284 | ||||||
| 2026-02-17 | 13F | Advisor Group Holdings, Inc. | 878.122 | -26,20 | 26.254 | -32,67 | ||||
| 2026-02-11 | 13F | Rise Advisors, LLC | 0 | -100,00 | 0 | |||||
| 2026-01-23 | 13F | FSM Wealth Advisors, LLC | 8.985 | -22,89 | 269 | -26,78 | ||||
| 2026-01-30 | 13F | Interchange Capital Partners, LLC | 21.834 | 8,50 | 653 | 2,84 | ||||
| 2026-02-17 | 13F | Credit Agricole S A | Put | 190.000 | 5.679 | |||||
| 2026-02-17 | 13F | Credit Agricole S A | 1.586.955 | 1,27 | 47.434 | -3,66 | ||||
| 2026-02-06 | 13F | McKinley Carter Wealth Services, Inc. | 40.179 | -10,70 | 1.201 | -15,07 | ||||
| 2026-02-10 | 13F | Godfrey Financial Associates, Inc. | 1.190 | 36 | ||||||
| 2026-02-12 | 13F | Dimensional Fund Advisors Lp | 28.954.211 | -6,98 | 865.461 | -11,51 | ||||
| 2026-02-12 | 13F | Triumph Capital Management | 15.452 | 188,71 | 462 | 174,40 | ||||
| 2026-02-11 | 13F | Boston Research & Management Inc | 96.971 | -30,67 | 3 | -50,00 | ||||
| 2026-02-02 | 13F | Avidian Wealth Solutions, LLC | 9.456 | -22,01 | 283 | -25,79 | ||||
| 2026-02-05 | 13F | Avantax Planning Partners, Inc. | 8.634 | 0,30 | 258 | -4,44 | ||||
| 2026-02-23 | 13F | Mv Capital Management, Inc. | 8.676 | 6,27 | 259 | -11,00 | ||||
| 2025-09-26 | NP | BVAL - Bluemonte Large Cap Value ETF | 8 | 0 | ||||||
| 2026-02-12 | 13F | Richard W. Paul & Associates, LLC | 0 | -100,00 | 0 | |||||
| 2025-09-26 | NP | FEAMX - First Eagle Fund of America Class C | 641.779 | -1,38 | 21.326 | -4,18 | ||||
| 2026-01-16 | 13F | Crewe Advisors LLC | 7.705 | 0,98 | 230 | -3,77 | ||||
| 2025-09-26 | NP | TILVX - TIAA-CREF Large-Cap Value Index Fund Institutional Class | 1.475.225 | -6,40 | 49.022 | -9,05 | ||||
| 2026-01-12 | 13F | Avanza Fonder AB | 292.722 | 9,27 | 8.749 | 3,96 | ||||
| 2026-01-23 | 13F | Halbert Hargrove Global Advisors, Llc | 0 | -100,00 | 0 | |||||
| 2025-09-29 | NP | AWYIX - CIBC ATLAS EQUITY INCOME FUND Institutional Class Shares | 98.180 | 0,00 | 3.263 | -2,83 | ||||
| 2025-09-29 | NP | VEGN - US Vegan Climate ETF | 20.228 | 9,45 | 672 | 6,33 | ||||
| 2026-01-16 | 13F | Tema Etfs Llc | 62.120 | -0,30 | 1.857 | -5,16 | ||||
| 2026-02-17 | 13F | Sterling Wealth Management, Inc. | 33.829 | -0,09 | 1.011 | -4,89 | ||||
| 2026-02-17 | 13F | Ibex Wealth Advisors | 152.382 | 4.555 | ||||||
| 2026-01-26 | 13F | Quadrant Private Wealth Management, LLC | 14.452 | 8,44 | 432 | 3,11 | ||||
| 2026-01-12 | 13F | Schaper Benz & Wise Investment Counsel Inc/wi | 318.635 | -3,77 | 9.524 | -8,46 | ||||
| 2026-02-17 | 13F | Private Advisor Group, LLC | 271.455 | -14,80 | 8.114 | -18,96 | ||||
| 2026-02-03 | 13F | Wulff, Hansen & Co. | 8.164 | 0,00 | 244 | -4,69 | ||||
| 2026-02-12 | 13F | Keel Point, LLC | 12.751 | -7,38 | 381 | -11,81 | ||||
| 2026-02-13 | 13F | Voya Financial Advisors, Inc. | 92.897 | -0,35 | 2.775 | -5,49 | ||||
| 2026-02-05 | 13F | Cardinal Point Capital Management, ULC | 173.370 | -18,52 | 5.182 | -22,48 | ||||
| 2026-02-06 | 13F | Vestmark Advisory Solutions, Inc. | 936.640 | 3.584,51 | 27.996 | 3.408,27 | ||||
| 2026-01-26 | 13F | Townsend & Associates, Inc | 17.300 | 0,00 | 490 | -4,11 | ||||
| 2026-02-13 | 13F | Banco Santander, S.A. | 903.579 | 36,14 | 25.302 | 21,33 | ||||
| 2026-01-26 | 13F | KBC Group NV | 1.740.659 | -47,89 | 52 | -50,00 | ||||
| 2026-01-27 | 13F | GHP Investment Advisors, Inc. | 109.816 | -8,70 | 3.282 | -13,15 | ||||
| 2025-11-12 | 13F | Berry Wealth Group, LP | 0 | -100,00 | 0 | -100,00 | ||||
| 2025-09-26 | NP | BLGR - Bluemonte Large Cap Growth ETF | 14 | 0 | ||||||
| 2026-02-02 | 13F | Syntax Research, Inc. | 1.780 | -15,56 | 53 | -19,70 | ||||
| 2026-02-03 | 13F | Cheviot Value Management, LLC | 557.851 | 12,02 | 15.849 | 8,70 | ||||
| 2026-02-13 | 13F | SRB Corp | 1.096.685 | 8,89 | 32.780 | 3,59 | ||||
| 2026-02-12 | 13F | Colony Capital, Inc. | 1.123.239 | 36,07 | 33.574 | 29,44 | ||||
| 2026-01-23 | 13F | Bowman & Co S.C. | 31.442 | -12,38 | 940 | -16,68 | ||||
| 2026-01-20 | 13F | Fundamentun, Llc | 0 | -100,00 | 0 | |||||
| 2026-02-05 | 13F | High Note Wealth, LLC | 1.183 | -12,63 | 35 | -16,67 | ||||
| 2026-01-28 | 13F | Key Client Fiduciary Advisors, LLC | 8.193 | -7,51 | 245 | -12,23 | ||||
| 2026-01-23 | 13F | Cantor Fitzgerald Investment Adviser L.p. | 286.427 | -20,35 | 8.561 | -24,23 | ||||
| 2026-01-27 | 13F | Osborne Partners Capital Management, Llc | 8.661 | 0,37 | 259 | -4,80 | ||||
| 2026-01-22 | 13F | Personal Cfo Solutions, Llc | 47.229 | -2,78 | 1.412 | -7,54 | ||||
| 2026-02-04 | 13F | Tsfg, Llc | 432 | -63,42 | 0 | |||||
| 2026-01-12 | 13F | Robinson Value Management, Ltd. | 106.546 | 6,35 | 3.185 | 1,18 | ||||
| 2026-02-17 | 13F | Quantinno Capital Management LP | 2.570.540 | 92,00 | 76.833 | 82,65 | ||||
| 2026-02-04 | 13F | Paradigm Asset Management Co Llc | 14.000 | 0,00 | 418 | -4,78 | ||||
| 2026-02-13 | 13F | Ausdal Financial Partners, Inc. | 22.811 | 8,20 | 682 | 2,87 | ||||
| 2026-02-24 | 13F | MidFirst Bank | 59.343 | 1.451 | ||||||
| 2026-01-23 | 13F | Whitener Capital Management, Inc. | 9.870 | 0,00 | 295 | -4,84 | ||||
| 2026-01-08 | 13F | Signet Financial Management, Llc | 46.078 | -40,98 | 1.377 | -43,84 | ||||
| 2026-02-12 | 13F | SWAN Capital LLC | 542 | 0,00 | 16 | -5,88 | ||||
| 2026-02-05 | 13F | Bessemer Group Inc | 52.195 | -97,73 | 2 | -98,61 | ||||
| 2026-02-13 | 13F | Bridgewater Associates, LP | 3.510.012 | -48,83 | 104.914 | -51,32 | ||||
| 2026-01-26 | 13F | BTS Asset Management, Inc. | 15.951 | -12,74 | 474 | -17,42 | ||||
| 2026-02-10 | 13F | Peapack Gladstone Financial Corp | 79.712 | -20,75 | 2 | -33,33 | ||||
| 2025-09-25 | NP | DFA INVESTMENT DIMENSIONS GROUP INC - U.S. Large Cap Equity Portfolio Institutional Class This fund is a listed as child fund of Dimensional Fund Advisors Lp and if that institution has disclosed ownership in this security, then these positions will not be double counted when calculating total shares and total value | 197.002 | 0,00 | 6.546 | -2,84 | ||||
| 2026-01-27 | 13F | Novem Group | 26.417 | -76,33 | 790 | -77,50 | ||||
| 2025-10-27 | 13F | Jacobsen Capital Management | 0 | -100,00 | 0 | |||||
| 2026-01-28 | 13F | Proathlete Wealth Management Llc | 362 | 0,00 | 11 | -9,09 | ||||
| 2026-02-11 | 13F | Allianz Asset Management GmbH | Put | 144.400 | 9,73 | 4.316 | 4,40 | |||
| 2026-02-13 | 13F | Valueworks Llc | 139.245 | 0,58 | 4.162 | -4,30 | ||||
| 2025-10-07 | 13F | Montecito Bank & Trust | 0 | -100,00 | 0 | -100,00 | ||||
| 2026-02-11 | 13F | Allianz Asset Management GmbH | Call | 132.900 | 30,68 | 3.972 | 24,32 | |||
| 2026-02-11 | 13F | Allianz Asset Management GmbH | 12.538.285 | 2,94 | 352.987 | -7,76 | ||||
| 2026-02-09 | 13F | Wellington Shields Capital Management, LLC | 1.068 | -8,25 | 32 | -13,89 | ||||
| 2025-11-14 | 13F | Point72 (DIFC) Ltd | Put | 2.500 | -94,65 | 79 | -95,32 | |||
| 2026-02-09 | 13F | Frazier Financial Advisors, LLC | 745 | 0,00 | 22 | -4,35 | ||||
| 2026-02-06 | 13F | Resona Asset Management Co.,Ltd. | 1.209.220 | -4,87 | 36.139 | -9,55 | ||||
| 2025-11-14 | 13F | Point72 (DIFC) Ltd | Call | 800 | -97,57 | 25 | -97,87 | |||
| 2026-02-10 | 13F | Peak Retirement Planning, Inc. | 67.834 | 35,64 | 2.028 | 29,03 | ||||
| 2025-11-14 | 13F | Point72 (DIFC) Ltd | 665.750 | 425,63 | 20.918 | 362,77 | ||||
| 2026-02-17 | 13F | Hotchkis & Wiley Capital Management Llc | 27.768.597 | 33,02 | 830.003 | 26,55 | ||||
| 2026-01-20 | 13F | Trust Co Of Toledo Na /oh/ | 64.843 | -19,50 | 1.938 | -23,40 | ||||
| 2026-02-13 | 13F | Neo Ivy Capital Management | 173.071 | 18,65 | 5.173 | 12,87 | ||||
| 2026-01-13 | 13F | Sendero Wealth Management, LLC | 49.430 | -9,47 | 1.477 | -13,88 | ||||
| 2026-01-14 | 13F | Centennial Wealth Advisory LLC | 7.650 | 229 | ||||||
| 2025-10-16 | 13F | LeConte Wealth Management, LLC | 0 | -100,00 | 0 | -100,00 | ||||
| 2026-02-17 | 13F | Prosperity Consulting Group, LLC | 15.491 | 15,21 | 463 | 9,72 | ||||
| 2026-02-09 | 13F | Cary Street Partners Financial Llc | 23.160 | -13,75 | 692 | -17,91 | ||||
| 2026-01-28 | 13F | Citizens & Northern Corp | 11.030 | -75,57 | 330 | -76,80 | ||||
| 2026-01-29 | 13F | Traub Capital Management LLC | 20.166 | 3,44 | 603 | -1,63 | ||||
| 2026-01-29 | 13F | Teachers Retirement System Of The State Of Kentucky | 298.455 | 0,00 | 9 | -11,11 | ||||
| 2026-01-21 | 13F | Crux Wealth Advisors | 47.098 | 0,11 | 1.408 | -4,80 | ||||
| 2026-02-05 | 13F | Everstar Asset Management, LLC | 0 | -100,00 | 0 | |||||
| 2026-02-09 | 13F | Clear Investment Research, Llc | 0 | -100,00 | 0 | |||||
| 2025-11-14 | 13F | Texas Permanent School Fund | 0 | -100,00 | 0 | -100,00 | ||||
| 2026-02-17 | 13F | SageView Advisory Group, LLC | 21.596 | -2,47 | 646 | -7,19 | ||||
| 2026-01-23 | 13F | Parthenon Llc | 7.370 | -1,21 | 220 | -5,98 | ||||
| 2026-02-11 | 13F | Peachtree Investment Partners, LLC | 8.140 | -0,73 | 243 | -5,45 | ||||
| 2026-02-18 | 13F/A | Empowered Funds, LLC | 731.415 | 27,09 | 21.862 | 22,18 | ||||
| 2026-02-11 | 13F | Next Capital Management LLC | 10.928 | -2,24 | 327 | -7,12 | ||||
| 2026-02-17 | 13F | Public Employees Retirement System Of Ohio | 1.759.476 | 1,53 | 52.591 | -3,41 | ||||
| 2026-02-11 | 13F | Vise Technologies, Inc. | 116.749 | 48,69 | 3.490 | 41,43 | ||||
| 2026-02-09 | 13F | Hantz Financial Services, Inc. | 287.293 | -8,95 | 9 | -11,11 | ||||
| 2025-09-26 | NP | FVLAX - Fidelity Advisor Value Leaders Fund Class A This fund is a listed as child fund of Fmr Llc and if that institution has disclosed ownership in this security, then these positions will not be double counted when calculating total shares and total value | 9.560 | -55,66 | 318 | -56,99 | ||||
| 2026-01-29 | 13F | Calamos Advisors LLC | 794.217 | -3,90 | 23.739 | -8,58 | ||||
| 2026-01-12 | 13F | Moody National Bank Trust Division | 6.786 | -77,09 | 203 | -78,28 | ||||
| 2026-02-17 | 13F | Boreal Capital Management LLC | 561 | 0,00 | 17 | -5,88 | ||||
| 2026-02-25 | 13F | Mariner Investment Group Llc | 42.500 | 1.270 | ||||||
| 2025-11-07 | 13F | Sierra Ocean, Llc | 0 | -100,00 | 0 | |||||
| 2026-01-14 | 13F | Woodstock Corp | 130.500 | -7,64 | 3.901 | -12,14 | ||||
| 2026-02-25 | 13F | Mariner Investment Group Llc | Put | 120.000 | 0,00 | 41 | -74,53 | |||
| 2026-02-02 | 13F | Sachetta, LLC | 1.782 | 22,05 | 53 | 17,78 | ||||
| 2026-02-09 | 13F | Fidelis Capital Partners, LLC | 18.869 | -22,48 | 564 | -26,31 | ||||
| 2026-02-05 | 13F | Navalign, LLC | 207 | 6 | ||||||
| 2026-02-17 | 13F | Jones Financial Companies Lllp | 1.055.139 | -18,60 | 31.543 | -23,15 | ||||
| 2026-02-13 | 13F | 1248 Management, LLC | 5.000 | 2.531,58 | 149 | 2.880,00 | ||||
| 2026-02-09 | 13F | Smith Chas P & Associates Pa Cpas | 0 | -100,00 | 0 | |||||
| 2026-01-07 | 13F | Retirement Wealth Solutions LLC | 616 | 21,26 | 18 | 20,00 | ||||
| 2026-01-22 | 13F | Trilogy Capital Inc. | 0 | -100,00 | 0 | |||||
| 2026-02-27 | 13F | Strategic Investment Solutions, Inc. /IL | 5.217 | 330,09 | 156 | 307,89 | ||||
| 2025-09-25 | NP | BBUS - JPMorgan BetaBuilders U.S. Equity ETF | 349.197 | 6,71 | 11.604 | 3,68 | ||||
| 2026-02-13 | 13F | Wbi Investments, Inc. | 0 | -100,00 | 0 | |||||
| 2026-02-10 | 13F | Natixis Advisors, L.p. | 2.020.271 | 3,47 | 57 | -8,20 | ||||
| 2026-02-04 | 13F | Advisor OS, LLC | 39.373 | 18,18 | 1.177 | 12,43 | ||||
| 2025-09-29 | NP | QYLD - Global X NASDAQ 100 Covered Call ETF This fund is a listed as child fund of Mirae Asset Global Investments Co., Ltd. and if that institution has disclosed ownership in this security, then these positions will not be double counted when calculating total shares and total value | 1.810.805 | -20,71 | 60.173 | -22,95 | ||||
| 2026-02-10 | 13F | Greenwich Wealth Management LLC | 9.245 | -2,92 | 0 | |||||
| 2026-02-10 | 13F | Founders Financial Securities Llc | 105.054 | 7,75 | 3.140 | 2,51 | ||||
| 2026-02-14 | 13F | American Trust | 54.565 | -17,28 | 1.631 | -21,33 | ||||
| 2026-01-16 | 13F | McLean Asset Management Corp | 0 | -100,00 | 0 | |||||
| 2026-02-13 | 13F | Umb Bank N A/mo | 73.756 | -14,23 | 2.205 | -18,40 | ||||
| 2026-01-23 | 13F | Oxler Private Wealth LLC | 31.863 | -1,02 | 952 | -5,84 | ||||
| 2025-11-03 | 13F | Aspetuck Financial Management LLC | 0 | -100,00 | 0 | |||||
| 2026-01-21 | 13F | Franklin Street Advisors Inc /nc | 0 | -100,00 | 0 | |||||
| 2026-02-17 | 13F | Fairview Capital Investment Management, Llc | 0 | -100,00 | 0 | |||||
| 2025-11-06 | 13F | Waterfront Wealth Inc. | 0 | -100,00 | 0 | |||||
| 2026-01-27 | 13F | Forum Financial Management, LP | 47.729 | -12,42 | 1.427 | -16,71 | ||||
| 2026-02-05 | 13F | Center for Financial Planning, Inc. | 9.601 | -20,90 | 287 | -24,93 | ||||
| 2025-09-25 | NP | RPGAX - T. Rowe Price Global Allocation Fund, Inc. This fund is a listed as child fund of Price T Rowe Associates Inc /md/ and if that institution has disclosed ownership in this security, then these positions will not be double counted when calculating total shares and total value | 12.504 | -15,54 | 416 | -17,98 | ||||
| 2026-02-19 | 13F | Van Diest Capital, LLC | 11.378 | 340 | ||||||
| 2026-02-13 | 13F | Missouri Trust & Investment Co | 177 | 0,00 | 5 | 0,00 | ||||
| 2025-09-26 | NP | FERRX - First Eagle Global Real Assets Fund Class R6 | 4.002 | -0,79 | 133 | -3,65 | ||||
| 2026-01-23 | 13F | Patton Fund Management, Inc. | 7.970 | 22,67 | 238 | 16,67 | ||||
| 2026-02-13 | 13F | Kcm Investment Advisors Llc | 22.489 | -3,09 | 672 | -7,82 | ||||
| 2026-02-11 | 13F | Pettyjohn, Wood & White, Inc | 49.176 | -18,62 | 1.470 | -22,60 | ||||
| 2026-01-30 | 13F | Ares Financial Consulting, LLC | 253 | 8 | ||||||
| 2026-02-06 | 13F | Associated Banc-corp | 366.216 | -2,18 | 10.946 | -6,95 | ||||
| 2026-01-12 | 13F | VisionPoint Advisory Group, LLC | 26.763 | 4,77 | 800 | -0,37 | ||||
| 2026-02-17 | 13F | Kemnay Advisory Services Inc. | 1.440 | 43 | ||||||
| 2026-02-20 | 13F | Sunbelt Securities, Inc. | 25.027 | -11,37 | 748 | -15,67 | ||||
| 2026-02-17 | 13F | Laird Norton Trust Company, Llc | 83.474 | 2.495 | ||||||
| 2026-01-15 | 13F | Westend Capital Management LLC | 163 | 5 | ||||||
| 2025-09-29 | NP | RSRFX - REAVES UTILITIES AND ENERGY INFRASTRUCTURE FUND INSTITUTIONAL CLASS SHARES | 0 | -100,00 | 0 | -100,00 | ||||
| 2025-09-26 | NP | TISPX - TIAA-CREF S&P 500 Index Fund Institutional Class | 785.949 | -3,58 | 26.117 | -6,32 | ||||
| 2026-01-28 | 13F | Davis Capital Management | 2.726 | -93,66 | 81 | -94,00 | ||||
| 2026-02-13 | 13F | Public Sector Pension Investment Board | 0 | -100,00 | 0 | |||||
| 2026-02-12 | 13F | Marex Group plc | 21.803 | 80,82 | 652 | 72,22 | ||||
| 2026-02-13 | 13F | Seneschal Advisors, LLC | 28 | -50,00 | 1 | -100,00 | ||||
| 2026-01-21 | 13F | Canton Hathaway, LLC | 5.128 | 0,00 | 153 | -4,97 | ||||
| 2026-01-23 | 13F | Gibbs Wealth Management | 23.596 | -18,58 | 669 | -26,48 | ||||
| 2026-02-09 | 13F | Hartland & Co., LLC | 74.398 | -6,67 | 2.224 | -11,22 | ||||
| 2026-01-14 | 13F | Wolff Wiese Magana Llc | 681 | 6,41 | 20 | 0,00 | ||||
| 2026-02-13 | 13F | Dixon Mitchell Investment Counsel Inc. | 1.241 | -99,67 | 60 | -99,50 | ||||
| 2026-02-03 | 13F | Farmers & Merchants Investments Inc | 204.658 | -47,31 | 6.117 | -49,88 | ||||
| 2026-02-13 | 13F | Bollard Group LLC | 37.202 | -4,94 | 1 | 0,00 | ||||
| 2026-02-12 | 13F | Penserra Capital Management LLC | 147.696 | 50,66 | 4 | 33,33 | ||||
| 2026-01-15 | 13F | Capital Advisors Inc/ok | 11.929 | 1,89 | 357 | -3,00 | ||||
| 2026-02-13 | 13F | Alberta Investment Management Corp | 272.200 | 662,46 | 8.136 | 625,78 | ||||
| 2026-02-10 | 13F | CFS Investment Advisory Services, LLC | 23.993 | 16,13 | 717 | 18,71 | ||||
| 2026-02-17 | 13F | Ancora Advisors, LLC | 57.306 | -7,75 | 1.713 | -12,25 | ||||
| 2025-10-28 | 13F | Dillon & Associates Inc | 0 | -100,00 | 0 | |||||
| 2025-11-21 | 13F/A | CIBC Bancorp USA Inc. | 1.176.517 | 36.966 | ||||||
| 2026-02-11 | 13F | CenterBook Partners LP | 17.565 | 525 | ||||||
| 2026-02-12 | 13F | Jane Street Group, Llc | 1.402.723 | -37,98 | 41.927 | -41,00 | ||||
| 2026-02-12 | 13F | Jane Street Group, Llc | Put | 1.248.300 | 101,63 | 37.312 | 91,81 | |||
| 2026-02-12 | 13F | Jane Street Group, Llc | Call | 4.127.400 | 37,01 | 123.368 | 30,34 | |||
| 2026-01-20 | 13F | Ethos Financial Group, LLC | 13.298 | -1,14 | 397 | -5,92 | ||||
| 2025-09-29 | NP | CATH - Global X S&P 500 Catholic Values ETF This fund is a listed as child fund of Mirae Asset Global Investments Co., Ltd. and if that institution has disclosed ownership in this security, then these positions will not be double counted when calculating total shares and total value | 68.693 | -1,27 | 2.283 | -4,08 | ||||
| 2026-02-12 | 13F | Advocate Investing Services LLC | 22.570 | 675 | ||||||
| 2026-01-29 | 13F | Kestra Private Wealth Services, Llc | 63.258 | -40,03 | 1.891 | -42,97 | ||||
| 2026-01-22 | 13F | Flagship Capital Management Inc. | 25.890 | 774 | ||||||
| 2026-02-10 | 13F | FUKOKU MUTUAL LIFE INSURANCE Co | 8.138 | 0,81 | 243 | -3,95 | ||||
| 2025-09-26 | NP | FZROX - Fidelity ZERO Total Market Index Fund This fund is a listed as child fund of Fmr Llc and if that institution has disclosed ownership in this security, then these positions will not be double counted when calculating total shares and total value | 1.745.581 | 1,29 | 58.006 | -1,58 | ||||
| 2026-02-12 | 13F | Colonial Trust Advisors | 22.199 | -69,38 | 664 | -70,88 | ||||
| 2026-02-06 | 13F | Hardy Reed LLC | 0 | -100,00 | 0 | |||||
| 2026-02-11 | 13F | J.w. Cole Advisors, Inc. | 99.787 | -25,18 | 2.719 | -35,11 | ||||
| 2026-02-10 | 13F | Marshall & Sterling Wealth Advisors Inc. | 264 | -61,46 | 8 | -66,67 | ||||
| 2026-02-13 | 13F | Tradewinds, LLC. | 7.912 | 0,55 | 236 | -4,45 | ||||
| 2025-10-23 | 13F | First Bancorp, Inc /ME/ | 0 | -100,00 | 0 | -100,00 | ||||
| 2025-09-26 | NP | FYEE - Fidelity Yield Enhanced Equity ETF | 0 | -100,00 | 0 | -100,00 | ||||
| 2026-02-06 | 13F | Texas Bank & Trust Co | 30.718 | -5,85 | 918 | -10,44 | ||||
| 2026-01-15 | 13F | SILVER OAK SECURITIES, Inc | 11.036 | 8,45 | 331 | 3,45 | ||||
| 2026-02-04 | 13F | Garrett Wealth Advisory Group, LLC | 0 | -100,00 | 0 | |||||
| 2026-02-11 | 13F | LPL Financial LLC | 3.773.599 | -10,88 | 112.793 | -15,22 | ||||
| 2026-02-11 | 13F | LPL Financial LLC | Call | 12.500 | 374 | |||||
| 2026-02-17 | 13F | Lantern Wealth Advisors, LLC | 55.524 | 19,86 | 1.660 | 14,02 | ||||
| 2026-02-13 | 13F | Stifel Financial Corp | 3.563.439 | -6,99 | 106.511 | -11,52 | ||||
| 2026-02-13 | 13F | Dynamic Technology Lab Private Ltd | 0 | -100,00 | 0 | |||||
| 2026-02-19 | 13F/A | Axxcess Wealth Management, Llc | 167.140 | 24,75 | 4.996 | 18,67 | ||||
| 2026-02-17 | 13F | Canada Pension Plan Investment Board | 11.646.730 | -4,08 | 348.121 | -8,75 | ||||
| 2026-02-10 | 13F/A | Northwestern Mutual Wealth Management Co | 220.938 | -19,77 | 6.604 | -23,68 | ||||
| 2026-01-22 | 13F | Apollon Wealth Management, LLC | 69.725 | -25,01 | 2.084 | -28,65 | ||||
| 2026-02-04 | 13F | Biltmore Family Office, LLC | 13.387 | 17,55 | 400 | 12,04 | ||||
| 2026-01-30 | 13F | New York State Teachers Retirement System | 3.301.650 | -2,56 | 99 | -7,55 | ||||
| 2026-02-05 | 13F | Amalgamated Bank | 679.852 | -3,31 | 20 | -9,09 | ||||
| 2026-01-09 | 13F | Clear Trail Advisors, LLC | 91.320 | 2.730 | ||||||
| 2026-02-13 | 13F | Johnson Investment Counsel Inc | 108.047 | -27,37 | 3.230 | -30,92 | ||||
| 2025-12-15 | 13F/A | Hudson Bay Capital Management LP | Call | 0 | -100,00 | 0 | -100,00 | |||
| 2025-12-15 | 13F/A | Hudson Bay Capital Management LP | Put | 0 | -100,00 | 0 | -100,00 | |||
| 2026-01-26 | 13F | Patriot Financial Group Insurance Agency, LLC | 128.717 | 34,47 | 3.847 | 27,93 | ||||
| 2026-01-26 | 13F | PDS Planning, Inc | 15.393 | 3,96 | 460 | -1,08 | ||||
| 2026-02-17 | 13F | Amundi | 14.175.517 | 59,67 | 423.708 | 53,45 | ||||
| 2026-02-13 | 13F | Cohen & Steers, Inc. | 4.000 | 0,00 | 0 | |||||
| 2026-01-27 | 13F | Evergreen Capital Management Llc | 60.706 | -13,66 | 1.815 | -17,88 | ||||
| 2026-01-27 | 13F | Gf Fund Management Co. Ltd. | 766.628 | 3,36 | 22.915 | -1,68 | ||||
| 2026-01-28 | 13F | Cora Capital Advisors Llc | 11.013 | 3,40 | 329 | -1,50 | ||||
| 2026-02-13 | 13F | Financial Network Wealth Advisors LLC | 854 | -9,44 | 26 | -13,79 | ||||
| 2026-01-16 | 13F | Compagnie Lombard Odier SCmA | 237.000 | 0,00 | 7.084 | -4,88 | ||||
| 2026-01-29 | 13F | Klingman & Associates, LLC | 7.956 | 22,85 | 238 | 16,75 | ||||
| 2026-02-17 | 13F | Safe Harbor Fiduciary, LLC | 473 | 0,00 | 14 | -12,50 | ||||
| 2026-01-28 | 13F | Oversea-Chinese Banking CORP Ltd | 41.367 | 36,79 | 1.236 | 30,11 | ||||
| 2026-01-22 | 13F | Foundation Resource Management Inc | 625.932 | 196,96 | 18.709 | 182,53 | ||||
| 2026-02-17 | 13F | Caption Management, LLC | Call | 300.000 | 50,00 | 8.967 | 42,70 | |||
| 2026-01-22 | 13F | Charter Trust Co | 0 | -100,00 | 0 | |||||
| 2026-02-17 | 13F | Caption Management, LLC | 55.000 | 450,00 | 1.644 | 423,25 | ||||
| 2026-01-21 | 13F | Newbridge Financial Services Group, Inc. | 3.739 | 376,31 | 112 | 362,50 | ||||
| 2025-10-14 | 13F | Apeiron RIA LLC | 0 | -100,00 | 0 | |||||
| 2026-02-12 | 13F | Bradley Foster & Sargent Inc/ct | 31.253 | -58,77 | 934 | -60,77 | ||||
| 2026-02-13 | 13F | Jacobs Levy Equity Management, Inc | 960.317 | -47,23 | 28.704 | -49,80 | ||||
| 2026-02-03 | 13F | Cassaday & Co Wealth Management LLC | 17.982 | 18,51 | 537 | 12,82 | ||||
| 2025-09-26 | NP | PDAVX - PineBridge Dynamic Asset Allocation Fund Investor Servicing Shares | 5.346 | 7,85 | 178 | 4,73 | ||||
| 2026-01-28 | 13F | Columbia Asset Management | 22.869 | 54,22 | 684 | 46,88 | ||||
| 2025-09-17 | NP | GTLOX - Quantitative U.S. Large Cap Core Equity Portfolio - Advisor Shares | 138.132 | -46,15 | 4.590 | -47,67 | ||||
| 2026-02-13 | 13F | Ranmore Fund Management Ltd | 1.623.669 | 48.531 | ||||||
| 2025-11-12 | 13F | Bedell Frazier Investment Counseling, LLC | 0 | -100,00 | 0 | -100,00 | ||||
| 2026-01-22 | 13F | Weaver Capital Management LLC | 0 | -100,00 | 0 | -100,00 | ||||
| 2025-11-13 | 13F | Systematic Financial Management Lp | 0 | -100,00 | 0 | |||||
| 2026-02-13 | 13F | Quinn Opportunity Partners LLC | 2.980.021 | 56,91 | 89.073 | 49,26 | ||||
| 2026-02-09 | 13F | MQS Management LLC | 0 | -100,00 | 0 | |||||
| 2026-02-11 | 13F | Compass Rose Asset Management, LP | Call | 2.500.000 | 70.000 | |||||
| 2026-02-11 | 13F | Compass Rose Asset Management, LP | 515.000 | 15.393 | ||||||
| 2026-02-11 | 13F | Winnow Wealth Llc | 34.983 | 16,47 | 1.049 | 9,16 | ||||
| 2025-11-18 | 13F | Vertex Planning Partners, LLC | 0 | -100,00 | 0 | |||||
| 2025-09-26 | NP | MSTGX - Morningstar Global Income Fund | 20.020 | 16,69 | 665 | 13,48 | ||||
| 2026-02-17 | 13F | Silver Rock Financial LP | 611.500 | 0,00 | 18.278 | -4,87 | ||||
| 2026-02-12 | 13F | Brinker Capital Investments, LLC | 221.393 | 13,16 | 6.617 | 7,65 | ||||
| 2026-01-22 | 13F | Maseco Llp | 2.921 | -5,90 | 87 | -10,31 | ||||
| 2026-02-06 | 13F | Radnor Capital Management, LLC | 94.507 | -14,36 | 2.825 | -18,55 | ||||
| 2026-02-03 | 13F | Ballentine Partners, LLC | 25.294 | -35,78 | 756 | -38,88 | ||||
| 2026-01-26 | 13F | Whittier Trust Co Of Nevada Inc | 190.100 | -0,57 | 5.213 | -11,77 | ||||
| 2026-02-17 | 13F | Engineers Gate Manager LP | 549.846 | -9,58 | 16.435 | -13,99 | ||||
| 2025-09-17 | NP | GWILX - Women in Leadership U.S. Equity Portfolio | 2.665 | -74,25 | 89 | -75,14 | ||||
| 2026-01-16 | 13F | Trust Co Of Vermont | 81.045 | -47,16 | 2.422 | -49,74 | ||||
| 2026-01-27 | 13F | Meritage Portfolio Management | 104.166 | -4,58 | 3.114 | -9,22 | ||||
| 2026-01-22 | 13F | Alpha Omega Wealth Management LLC | 0 | -100,00 | 0 | |||||
| 2026-02-09 | 13F | Kingsview Wealth Management, LLC | 315.531 | -2,28 | 9.431 | -7,04 | ||||
| 2026-02-12 | 13F | Principal Securities, Inc. | 170.980 | 18,64 | 5.111 | 12,85 | ||||
| 2026-01-16 | 13F | CRA Financial Services, LLC | 0 | -100,00 | 0 | -100,00 | ||||
| 2025-10-14 | 13F | Flywheel Private Wealth LLC | 0 | -100,00 | 0 | -100,00 | ||||
| 2025-11-14 | 13F/A | Mubadala Investment Co PJSC | 0 | -100,00 | 0 | |||||
| 2026-01-30 | 13F | Simplicity Wealth,LLC | 18.119 | -37,09 | 542 | -40,15 | ||||
| 2026-02-06 | 13F/A | Rathbone Brothers plc | 27.360 | -3,46 | 818 | -8,20 | ||||
| 2026-01-23 | 13F | Deprince Race & Zollo Inc | 1.025.466 | 9,44 | 30.651 | 4,11 | ||||
| 2026-02-10 | 13F | Phillips Wealth Planners LLC | 0 | -100,00 | 0 | |||||
| 2026-02-13 | 13F | Pin Oak Investment Advisors Inc | 796 | -31,97 | 0 | -100,00 | ||||
| 2026-01-20 | 13F | Meridian Investment Counsel Inc. | 75.147 | -5,43 | 2.246 | -10,02 | ||||
| 2026-01-29 | 13F | UBS Group AG | Put | 276.600 | -77,29 | 8.268 | -78,40 | |||
| 2026-01-29 | 13F | UBS Group AG | Call | 689.000 | 217,86 | 20.594 | 202,41 | |||
| 2026-01-29 | 13F | UBS Group AG | 14.000.498 | 32,51 | 418.475 | 26,06 | ||||
| 2026-01-29 | 13F | Cornerstone National Bank & Trust Co | 17.936 | -58,98 | 536 | -60,96 | ||||
| 2026-02-13 | 13F | Klingenstein Fields & Co Lp | 161.775 | -0,42 | 4.835 | -5,27 | ||||
| 2026-01-28 | 13F | B. Metzler seel. Sohn & Co. AG | 260.907 | -20,21 | 7.801 | -24,08 | ||||
| 2026-02-12 | 13F | Ullmann Financial Group, Inc. | 9.215 | 2,56 | 256 | -9,22 | ||||
| 2026-02-17 | 13F | Cim Investment Mangement Inc | 8.827 | 0,00 | 264 | -5,05 | ||||
| 2026-02-17 | 13F | VestGen Advisors, LLC | 39.707 | -55,58 | 1.187 | -57,76 | ||||
| 2025-09-26 | NP | AADBX - American Beacon Balanced Fund Institutional Class | 32.802 | -3,09 | 1.090 | -5,79 | ||||
| 2026-01-23 | 13F | Beacon Harbor Wealth Advisors, Inc. | 0 | -100,00 | 0 | |||||
| 2025-11-14 | 13F | Lombard Odier Asset Management (USA) Corp | 0 | -100,00 | 0 | -100,00 | ||||
| 2026-01-13 | 13F | Regatta Capital Group, Llc | 10.163 | -12,41 | 304 | -16,76 | ||||
| 2026-01-21 | 13F | Carolina Wealth Advisors, LLC | 1.746 | -0,57 | 52 | -5,45 | ||||
| 2026-02-02 | 13F | SNS Financial Group, LLC | 0 | -100,00 | 0 | |||||
| 2026-02-13 | 13F | Truvestments Capital Llc | 204 | -98,42 | 6 | -98,52 | ||||
| 2025-09-29 | NP | QQWZ - Pacer Cash COWZ 100-Nasdaq 100 Rotator ETF | 1.970 | 65 | ||||||
| 2026-02-17 | 13F | Adage Capital Partners Gp, L.l.c. | 3.081.159 | 1,89 | 92.096 | -3,07 | ||||
| 2026-02-12 | 13F | Tiemann Investment Advisors, Llc | 9.910 | -19,33 | 296 | -23,12 | ||||
| 2026-02-11 | 13F | Manchester Capital Management LLC | 5.933 | 28,14 | 177 | 22,07 | ||||
| 2026-01-07 | 13F | Corsicana & Co. | 1.015 | 0,00 | 30 | -3,23 | ||||
| 2026-01-12 | 13F | National Wealth Management Group, LLC | 11.098 | -38,93 | 332 | -42,03 | ||||
| 2026-02-17 | 13F | Raymond James Financial Inc | 15.204.835 | -18,44 | 454.493 | -22,41 | ||||
| 2026-02-09 | 13F | Huntington National Bank | 157.672 | -18,51 | 4.713 | -22,49 | ||||
| 2026-02-17 | 13F | Citadel Advisors Llc | Call | 3.934.500 | 64,49 | 117.602 | 56,48 | |||
| 2026-02-02 | 13F | Eq Wealth Advisors, Llc | 482 | 14 | ||||||
| 2026-02-17 | 13F | Citadel Advisors Llc | 4.730.708 | -35,11 | 141.401 | -38,27 | ||||
| 2026-02-17 | 13F | Wellington Management Group Llp | Put | 0 | -100,00 | 0 | ||||
| 2026-02-17 | 13F | Citadel Advisors Llc | Put | 2.804.700 | 165,19 | 83.832 | 152,29 | |||
| 2026-01-30 | 13F | Torren Management, LLC | 2.922 | 87 | ||||||
| 2026-02-02 | 13F | Alliance Wealth Advisors, LLC /UT | 9.808 | -11,26 | 293 | -15,56 | ||||
| 2026-02-11 | 13F | Capital International Sarl | 179.668 | 36,38 | 5.370 | 29,74 | ||||
| 2026-01-12 | 13F | DAVENPORT & Co LLC | 4.103.716 | -5,35 | 114.912 | -15,69 | ||||
| 2026-01-12 | 13F | Byrne Asset Management LLC | 0 | -100,00 | 0 | |||||
| 2026-02-17 | 13F | IHT Wealth Management, LLC | 35.351 | -16,52 | 1.057 | -20,47 | ||||
| 2026-01-07 | 13F | Everpar Advisors Llc | 10.686 | 14,58 | 319 | 8,87 | ||||
| 2026-02-03 | 13F | Encompass More Asset Management | 19.430 | 20,92 | 581 | 15,08 | ||||
| 2026-02-13 | 13F | Entropy Technologies, LP | 398.871 | 7,51 | 11.922 | 2,28 | ||||
| 2026-01-23 | 13F | Live Oak Private Wealth LLC | 0 | -100,00 | 0 | -100,00 | ||||
| 2026-02-17 | 13F | Angeles Wealth Management, Llc | 6.894 | 206 | ||||||
| 2025-09-23 | NP | FSTRX - Federated MDT Large Cap Value Fund Class A Shares | 119.750 | -10,56 | 3.979 | -13,10 | ||||
| 2026-02-09 | 13F | Quest Partners LLC | 19.274 | -82,55 | 576 | -83,40 | ||||
| 2026-02-05 | 13F | Gabelli Funds Llc | 901.230 | -9,50 | 26.938 | -13,91 | ||||
| 2026-02-09 | 13F | CBIZ Investment Advisory Services, LLC | 2.029 | 149,26 | 61 | 140,00 | ||||
| 2026-01-30 | 13F | Valued Wealth Advisors LLC | 1.057 | -11,10 | 32 | -16,22 | ||||
| 2025-11-14 | 13F | London Co Of Virginia | 0 | -100,00 | 0 | |||||
| 2025-10-28 | 13F | Ariston Services Group | 0 | -100,00 | 0 | -100,00 | ||||
| 2026-02-12 | 13F | Fortress Private Ledger, Llc | 16.646 | -26,73 | 498 | -30,29 | ||||
| 2026-01-21 | 13F | Crews Bank & Trust | 4.790 | -7,26 | 143 | -11,73 | ||||
| 2026-02-12 | 13F | Johnson Financial Group, Inc. | 27.147 | -26,20 | 811 | -29,78 | ||||
| 2026-02-13 | 13F | Walleye Capital LLC | Put | 472.000 | 342,78 | 14.108 | 321,26 | |||
| 2025-09-29 | NP | CAMX - Cambiar Aggressive Value ETF | 51.500 | 7,29 | 1.711 | 4,27 | ||||
| 2026-02-13 | 13F | Walleye Capital LLC | 739.139 | 992,69 | 22.093 | 939,62 | ||||
| 2026-02-03 | 13F | International Assets Investment Management, Llc | 19.690 | -3,28 | 589 | -20,43 | ||||
| 2026-02-13 | 13F | Walleye Capital LLC | Call | 217.500 | 121,71 | 6.501 | 110,93 | |||
| 2026-02-06 | 13F | Ironwood Investment Counsel, LLC | 200.739 | 23,93 | 6.000 | 17,90 | ||||
| 2026-01-02 | 13F | Global Wealth Strategies & Associates | 600 | 0,00 | 18 | -5,56 | ||||
| 2025-11-13 | 13F | Css Llc/il | Call | 0 | -100,00 | 0 | -100,00 | |||
| 2026-02-17 | 13F | Evercore Wealth Management, LLC | 34.752 | -6,34 | 1.039 | -10,90 | ||||
| 2025-10-27 | 13F | Kiker Wealth Management, LLC | 0 | -100,00 | 0 | -100,00 | ||||
| 2026-01-16 | 13F | FNY Investment Advisers, LLC | 200 | 0 | ||||||
| 2026-02-02 | 13F | Horizon Investments, LLC | 359.046 | -0,39 | 9.938 | -11,32 | ||||
| 2026-01-09 | 13F | Atlas Brown,Inc. | 31.324 | 12,30 | 936 | 6,85 | ||||
| 2026-01-20 | 13F | Tritonpoint Wealth, Llc | 0 | -100,00 | 0 | |||||
| 2025-09-23 | NP | PEYAX - PUTNAM EQUITY INCOME FUND Class A Shares | 5.558.483 | 0,00 | 184.708 | -2,84 | ||||
| 2025-11-13 | 13F | Advisor Resource Council | 0 | -100,00 | 0 | |||||
| 2026-02-04 | 13F | Naples Global Advisors, Llc | 8.301 | -42,66 | 248 | -45,37 | ||||
| 2025-09-22 | NP | GSRAX - Goldman Sachs Rising Dividend Growth Fund Class A | 291.659 | 4,24 | 9.692 | 1,27 | ||||
| 2025-09-24 | NP | BlackRock ETF Trust - Blackrock Future U.S. Themes ETF This fund is a listed as child fund of BlackRock, Inc. and if that institution has disclosed ownership in this security, then these positions will not be double counted when calculating total shares and total value | 272.444 | 9.053 | ||||||
| 2025-09-29 | NP | CAMWX - Cambiar Opportunity Fund Institutional Class Shares | 272.000 | -13,38 | 9.039 | -15,83 | ||||
| 2026-02-10 | 13F | Lcnb Corp | 13.010 | 7,86 | 389 | 2,65 | ||||
| 2026-01-29 | 13F | Comerica Bank | 716.998 | -20,29 | 21.431 | -24,17 | ||||
| 2026-02-09 | 13F | Mizuho Securities Usa Llc | 264.637 | -1,34 | 7.063 | -22,48 | ||||
| 2025-11-04 | 13F | Pineridge Advisors LLC | 22 | -81,36 | 1 | -100,00 | ||||
| 2026-01-29 | 13F | Scissortail Wealth Management, LLC | 58.936 | -4,29 | 1.762 | -8,95 | ||||
| 2026-02-24 | 13F | Astoria Portfolio Advisors LLC. | 8.924 | -7,89 | 282 | -5,37 | ||||
| 2026-01-21 | 13F | Stock Yards Bank & Trust Co | 26.137 | -5,32 | 781 | -9,92 | ||||
| 2026-01-05 | 13F | Coastline Trust Co | 20.102 | -0,17 | 601 | -5,06 | ||||
| 2026-01-15 | 13F | McGlone Suttner Wealth Management, Inc. | 9.786 | -6,12 | 292 | -10,70 | ||||
| 2026-01-29 | 13F | Pictet Asset Management Holding SA | 2.188.591 | -9,19 | 65.417 | -13,62 | ||||
| 2026-01-15 | 13F | Scharf Investments, Llc | 85.847 | -96,53 | 2.566 | -96,70 | ||||
| 2025-11-14 | 13F | Zurich Insurance Group Ltd/FI | 0 | -100,00 | 0 | -100,00 | ||||
| 2026-01-15 | 13F | Hengehold Capital Management Llc | 81.367 | -1,70 | 2.432 | -6,46 | ||||
| 2026-02-13 | 13F | McAdam, LLC | 15.853 | 9,32 | 474 | 3,96 | ||||
| 2026-02-10 | 13F | Nelson Capital Management, LLC | 0 | -100,00 | 0 | |||||
| 2026-02-11 | 13F | Gilpin Wealth Management, Llc | 198 | 6 | ||||||
| 2025-10-31 | 13F | Latitude Advisors, LLC | 0 | -100,00 | 0 | -100,00 | ||||
| 2025-10-24 | 13F | World Equity Group, Inc. | 0 | -100,00 | 0 | |||||
| 2026-01-12 | 13F | Quantum Financial Advisors, LLC | 0 | -100,00 | 0 | |||||
| 2026-01-23 | 13F | Founders Capital Management, Llc | 211.794 | -5,06 | 6.331 | -9,69 | ||||
| 2026-02-17 | 13F | Goldentree Asset Management Lp | 7.824.614 | 284,57 | 233.557 | 266,00 | ||||
| 2026-01-26 | 13F | Asset Dedication, LLC | 15.391 | -33,62 | 460 | -36,81 | ||||
| 2026-02-12 | 13F | Davy Global Fund Management Ltd | 174.590 | 0,00 | 5.218 | -4,87 | ||||
| 2026-02-17 | 13F | City National Bank Of Florida /msd | 12.061 | -7,53 | 361 | -11,98 | ||||
| 2026-01-23 | 13F | Harbor Island Capital LLC | 480.401 | 54,77 | 14.359 | 47,24 | ||||
| 2026-01-29 | 13F | Golden State Equity Partners | 17.881 | -11,34 | 534 | -15,64 | ||||
| 2025-09-26 | NP | BKLC - BNY Mellon US Large Cap Core Equity ETF | 256.042 | 24,57 | 8.508 | 21,04 | ||||
| 2026-02-10 | 13F | Carnegie Lake Advisors LLC | 10.496 | 0,00 | 314 | -4,86 | ||||
| 2025-09-26 | NP | VLLU - Harbor AlphaEdge Large Cap Value ETF | 2.349 | 97,06 | 78 | 95,00 | ||||
| 2025-09-26 | NP | SUNAMERICA SERIES TRUST - SA T. Rowe Price Asset Allocation Growth Portfolio Class 1 | 19.611 | -29,42 | 652 | -31,47 | ||||
| 2026-01-20 | 13F/A | Miller Wealth Advisors, Llc | 629 | -17,67 | 19 | -25,00 | ||||
| 2026-01-21 | 13F | Future Financial Wealth Managment LLC | 0 | -100,00 | 0 | |||||
| 2025-09-25 | NP | NFRA - FlexShares STOXX Global Broad Infrastructure Index Fund | 1.474.536 | 19,42 | 48.999 | 16,03 | ||||
| 2026-02-12 | 13F | Hibernia Wealth Partners, LLC | 6.816 | 204 | ||||||
| 2026-01-20 | 13F | C2P Capital Advisory Group, LLC d.b.a. Prosperity Capital Advisors | 0 | -100,00 | 0 | |||||
| 2026-01-26 | 13F | Nabity-Jensen Investment Management Inc | 9.425 | 0,00 | 282 | -5,07 | ||||
| 2026-01-30 | 13F | Citizens National Bank Trust Department | 42.457 | -13,87 | 1.269 | -18,02 | ||||
| 2026-02-13 | 13F | Epoch Investment Partners, Inc. | 753.175 | 9,05 | 22.512 | 3,74 | ||||
| 2025-09-26 | NP | PFM - Invesco Dividend Achievers ETF | 107.148 | -2,24 | 3.561 | -5,02 | ||||
| 2026-01-16 | 13F | Crowley Wealth Management, Inc. | 0 | -100,00 | 0 | |||||
| 2026-02-04 | 13F | Wsfs Capital Management, Llc | 7.510 | 12,80 | 224 | 7,18 | ||||
| 2026-01-14 | 13F | Wedge Capital Management L L P/nc | 7.597 | -5,50 | 227 | -9,92 | ||||
| 2026-02-10 | 13F | Dover Advisors, Llc | 0 | -100,00 | 0 | |||||
| 2026-03-06 | 13F | Union Savings Bank | 2.300 | 13,36 | 69 | 1,49 | ||||
| 2026-02-13 | 13F | Hurley Capital, LLC | 906 | -95,03 | 27 | -95,29 | ||||
| 2026-02-13 | 13F | Tower Bridge Advisors | 13.671 | 0,00 | 409 | -4,90 | ||||
| 2026-02-17 | 13F | GeoWealth Management, LLC | 39.141 | -19,11 | 1.170 | -23,09 | ||||
| 2026-01-20 | 13F | Maryland Capital Advisors Inc. | 426 | 0,00 | 13 | -7,69 | ||||
| 2026-02-02 | 13F | Estate Counselors, LLC | 89.500 | -17,23 | 2.675 | -21,25 | ||||
| 2025-09-29 | NP | EGLE - Global X S&P 500 U.S. Revenue Leaders ETF | 329 | -30,00 | 11 | -37,50 | ||||
| 2026-01-23 | 13F | U.S. Capital Wealth Advisors, LLC | 80.004 | 18,15 | 2.391 | 12,41 | ||||
| 2026-01-20 | 13F | Pflug Koory, LLC | 4.157 | 0,00 | 124 | -4,62 | ||||
| 2026-02-12 | 13F | Counterpoint Mutual Funds LLC | 9.817 | 293 | ||||||
| 2025-10-21 | 13F | Riverbend Wealth Management, LLC | 0 | -100,00 | 0 | |||||
| 2026-02-10 | 13F | MUFG Securities EMEA plc | 1.129.675 | 1.502,58 | 31.633 | 1.328,77 | ||||
| 2026-02-10 | 13F | Vantus Wealth LLC | 8.647 | 258 | ||||||
| 2025-10-30 | 13F | Coign Capital Advisors LLC | 0 | -100,00 | 0 | |||||
| 2025-09-26 | NP | FVAL - Fidelity Value Factor ETF This fund is a listed as child fund of Fmr Llc and if that institution has disclosed ownership in this security, then these positions will not be double counted when calculating total shares and total value | 138.154 | -0,23 | 4.591 | -3,06 | ||||
| 2026-02-13 | 13F | Seven Mile Advisory | 8.819 | -56,10 | 264 | -58,32 | ||||
| 2025-09-26 | NP | OTPIX - Nasdaq-100 Profund Investor Class | 19.109 | 26,36 | 635 | 22,63 | ||||
| 2026-02-17 | 13F | SPWM Advisors LLC | 23.430 | 700 | ||||||
| 2025-09-24 | NP | VLUE - iShares Edge MSCI USA Value Factor ETF | 2.880.227 | 34,63 | 95.710 | 30,81 | ||||
| 2026-02-12 | 13F | Gardner Russo & Quinn Llc | 2.300.197 | -5,95 | 68.753 | -10,53 | ||||
| 2026-02-10 | 13F | Linscomb & Williams, Inc. | 16.997 | -36,20 | 508 | -39,31 | ||||
| 2026-02-17 | 13F | Imprint Wealth LLC | 237 | -71,75 | 7 | -73,08 | ||||
| 2026-02-11 | 13F | Primecap Management Co/ca/ | 44.800 | -75,40 | 1.339 | -76,60 | ||||
| 2026-01-28 | 13F | Quaker Wealth Management, LLC | 2.100 | 1,20 | 63 | -4,62 | ||||
| 2025-09-26 | NP | UVALX - Value Fund Shares | 165.263 | 0,00 | 5.492 | -2,83 | ||||
| 2026-02-11 | 13F | Miller Investment Management, LP | 30.755 | 0,00 | 919 | -4,87 | ||||
| 2026-02-09 | 13F | Main Street Research LLC | 10.912 | -2,77 | 326 | -7,39 | ||||
| 2025-11-10 | 13F | Axq Capital, Lp | 0 | -100,00 | 0 | |||||
| 2026-02-09 | 13F | Wealthquest Corp | 7.519 | 225 | ||||||
| 2026-02-17 | 13F/A | American Alpha Advisors, LLC | 0 | -100,00 | 0 | |||||
| 2026-02-12 | 13F | Weitz Investment Management, Inc. | 0 | -100,00 | 0 | |||||
| 2025-09-19 | NP | MENAX - Madison Covered Call & Equity Income Fund Covered Call & Equity Income Fund Class A | 86.000 | 0,00 | 2.858 | -2,86 | ||||
| 2026-01-26 | 13F | Moss Adams Wealth Advisors LLC | 9.821 | 29,36 | 294 | 23,11 | ||||
| 2026-02-13 | 13F | Cornercap Investment Counsel Inc | 50.379 | -1,35 | 1.506 | -6,17 | ||||
| 2025-11-06 | 13F | Onyx Bridge Wealth Group LLC | 0 | -100,00 | 0 | |||||
| 2026-02-18 | 13F | Beacon Pointe Advisors, LLC | 76.789 | -12,76 | 2.295 | -17,00 | ||||
| 2025-09-24 | NP | TNBIX - 1290 SmartBeta Equity Fund Class I | 21.804 | 0,00 | 725 | -2,82 | ||||
| 2026-01-22 | 13F | Quotient Wealth Partners, LLC | 16.083 | -9,39 | 481 | -13,82 | ||||
| 2026-01-26 | 13F | Whittier Trust Co | 416.187 | -1,50 | 11.412 | -12,60 | ||||
| 2026-02-17 | 13F | Crabel Capital Management, LLC | 0 | -100,00 | 0 | |||||
| 2026-02-03 | 13F | Rnc Capital Management Llc | 1.273.532 | -9,74 | 38.066 | -14,14 | ||||
| 2026-02-05 | 13F | Sherman Asset Management, Inc. | 258 | 0,00 | 8 | -12,50 | ||||
| 2026-02-10 | 13F | SCS Capital Management LLC | 12.904 | 386 | ||||||
| 2026-01-14 | 13F | Congress Park Capital LLC | 7.400 | 0,00 | 221 | -4,74 | ||||
| 2025-11-13 | 13F | Glenmede Investment Management, LP | 915.875 | -39,63 | 28.777 | -46,86 | ||||
| 2026-01-30 | 13F | North Star Investment Management Corp. | 49.468 | -0,24 | 1.479 | -5,13 | ||||
| 2026-02-02 | 13F | Pittenger & Anderson Inc | 395 | -65,04 | 12 | -68,57 | ||||
| 2026-02-12 | 13F | VUB Generali dochodkova spravcovska spolocnost, a.s. | 9.751 | 291 | ||||||
| 2025-11-13 | 13F | Resurgent Financial Advisors LLC | 0 | -100,00 | 0 | |||||
| 2026-02-11 | 13F | CLARET ASSET MANAGEMENT Corp | 0 | -100,00 | 0 | |||||
| 2026-01-22 | 13F | Intergy Private Wealth, LLC | 0 | -100,00 | 0 | |||||
| 2026-01-20 | 13F | Corundum Trust Company, INC | 0 | -100,00 | 0 | |||||
| 2025-09-23 | NP | MYSPX - MainStay MacKay S&P 500 Index Fund Investor Class | 116.478 | -0,07 | 3.871 | -2,91 | ||||
| 2026-01-29 | 13F | IMC-Chicago, LLC | 641.921 | 44,84 | 19.187 | 37,80 | ||||
| 2026-01-29 | 13F | IMC-Chicago, LLC | Put | 1.329.500 | -48,69 | 39.739 | -51,19 | |||
| 2026-01-29 | 13F | IMC-Chicago, LLC | Call | 1.225.700 | 45,88 | 36.636 | 38,78 | |||
| 2026-02-13 | 13F | Smartleaf Asset Management LLC | 45.352 | -11,27 | 1.359 | -15,54 | ||||
| 2026-02-03 | 13F | Costello Asset Management, INC | 3.532 | -45,74 | 106 | -48,53 | ||||
| 2026-02-05 | 13F | Blume Capital Management, Inc. | 360.131 | 9,02 | 10.764 | 3,71 | ||||
| 2026-02-17 | 13F | Meridiem Capital Partners LP | 707.054 | 21.134 | ||||||
| 2026-01-08 | 13F | Versant Capital Management, Inc | 26.558 | 94,92 | 794 | 85,28 | ||||
| 2026-01-22 | 13F | Ofi Invest Asset Management | 15.648 | 327,42 | 438 | 350,52 | ||||
| 2026-02-04 | 13F | Dogwood Wealth Management LLC | 222 | 43,23 | 7 | 50,00 | ||||
| 2026-01-12 | 13F | Bill Few Associates, Inc. | 7.013 | -18,02 | 210 | -22,01 | ||||
| 2025-09-29 | NP | AIM INVESTMENT FUNDS (INVESCO INVESTMENT FUNDS) - Invesco Oppenheimer Fundamental Alternatives Fund Class R6 | 6.964 | -38,36 | 231 | -40,16 | ||||
| 2026-02-18 | 13F | Garton & Associates Financial Advisors LLC | 7.747 | 232 | ||||||
| 2026-02-04 | 13F | Summit Wealth Group Llc / Co | 0 | -100,00 | 0 | |||||
| 2026-02-09 | 13F | Leavell Investment Management, Inc. | 16.671 | -4,64 | 498 | -9,29 | ||||
| 2026-02-13 | 13F | Walleye Trading LLC | Call | 855.000 | 8,74 | 25.556 | 3,44 | |||
| 2026-02-13 | 13F | Walleye Trading LLC | 992.185 | 29.656 | ||||||
| 2026-02-17 | 13F | Beacon Investment Advisors Llc | 16.815 | -2,16 | 503 | -7,04 | ||||
| 2026-02-13 | 13F | Walleye Trading LLC | Put | 744.100 | 134,21 | 22.241 | 122,81 | |||
| 2026-02-17 | 13F | Worldquant Millennium Advisors Llc | 48.922 | -83,77 | 1.462 | -84,56 | ||||
| 2026-01-27 | 13F | Checchi Capital Advisers, LLC | 17.568 | -38,72 | 525 | -41,67 | ||||
| 2026-02-03 | 13F | Heartland Bank & Trust Co | 0 | -100,00 | 0 | |||||
| 2026-02-04 | 13F | HORAN Wealth, LLC | 78.949 | -10,14 | 2.360 | -14,53 | ||||
| 2026-02-06 | 13F | Aviance Capital Partners, LLC | 67.417 | 3,34 | 2.015 | -1,66 | ||||
| 2026-01-15 | 13F | J. Safra Sarasin Holding AG | 60.664 | -44,13 | 1.813 | -46,85 | ||||
| 2026-02-13 | 13F | OMERS ADMINISTRATION Corp | 148.578 | -8,22 | 4.441 | -12,70 | ||||
| 2026-02-13 | 13F | Glen Eagle Advisors, LLC | 6.430 | -11,11 | 192 | -15,42 | ||||
| 2026-02-03 | 13F | Mma Asset Management Llc | 0 | -100,00 | 0 | |||||
| 2026-02-17 | 13F | Qube Research & Technologies Ltd | 0 | -100,00 | 0 | |||||
| 2026-01-28 | 13F | CAPROCK Group, Inc. | 144.204 | 45,37 | 4.310 | 27,93 | ||||
| 2026-02-02 | 13F | Tevis Investment Management | 42.685 | 0,00 | 1.341 | 0,00 | ||||
| 2025-09-26 | NP | CVAR - Cultivar ETF | 6.042 | 0,78 | 201 | -2,44 | ||||
| 2026-02-06 | 13F | Mach-1 Financial Group, Inc. | 54.363 | 486,44 | 1.625 | 458,08 | ||||
| 2026-02-17 | 13F | Clark Capital Management Group, Inc. | 8.127 | -5,07 | 243 | -9,70 | ||||
| 2026-02-05 | 13F | DnB Asset Management AS | 779.795 | -25,61 | 23.308 | -29,23 | ||||
| 2026-02-10 | 13F | Heritage Trust Co | 15.165 | -88,24 | 453 | -88,82 | ||||
| 2026-02-17 | 13F | Loews Corp | 440.000 | 120,00 | 13.152 | 109,28 | ||||
| 2026-02-12 | 13F | Walled Lake Planning & Wealth Management, Llc | 7.732 | -1,95 | 231 | -6,48 | ||||
| 2025-09-25 | NP | Dfa Investment Trust Co - The U.s. Large Cap Value Series This fund is a listed as child fund of Dimensional Fund Advisors Lp and if that institution has disclosed ownership in this security, then these positions will not be double counted when calculating total shares and total value | 6.713.435 | -19,20 | 223.087 | -21,49 | ||||
| 2026-01-28 | 13F | Loring Wolcott & Coolidge Fiduciary Advisors Llp/ma | 19.985 | -9,24 | 574 | -11,16 | ||||
| 2026-01-16 | 13F | Empirical Financial Services, LLC d.b.a. Empirical Wealth Management | 26.525 | -33,35 | 793 | -36,64 | ||||
| 2026-02-04 | 13F | Oregon Public Employees Retirement Fund | 416.305 | -1,12 | 12.443 | -5,93 | ||||
| 2026-01-06 | 13F | Board of the Pension Protection Fund | 55.900 | 214,04 | 1.671 | 198,75 | ||||
| 2026-01-15 | 13F | Gleason Group, Inc. | 73 | -45,52 | 2 | -50,00 | ||||
| 2026-02-02 | 13F | Bay Harbor Wealth Management, LLC | 174 | 1,16 | 5 | 0,00 | ||||
| 2026-02-02 | 13F | Qrg Capital Management, Inc. | 444.005 | -7,73 | 13.271 | -12,22 | ||||
| 2026-02-06 | 13F | Envestnet Portfolio Solutions, Inc. | 275.914 | -4,50 | 8.247 | -9,15 | ||||
| 2026-01-20 | 13F | Nvwm, Llc | 2.119 | 2,02 | 63 | -3,08 | ||||
| 2026-02-09 | 13F | AIA Group Ltd | 473.351 | -7,96 | 14.148 | -12,45 | ||||
| 2026-02-12 | 13F | Colrain Capital Llc | 229.000 | 3,89 | 6.845 | -1,17 | ||||
| 2026-01-23 | 13F | Guyasuta Investment Advisors Inc | 109.642 | -7,52 | 3.277 | -12,00 | ||||
| 2025-09-26 | NP | FDVV - Fidelity High Dividend ETF This fund is a listed as child fund of Fmr Llc and if that institution has disclosed ownership in this security, then these positions will not be double counted when calculating total shares and total value | 147.699 | 17,23 | 4.908 | 13,93 | ||||
| 2026-02-11 | 13F | Atlanta Consulting Group Advisors, LLC | 0 | -100,00 | 0 | |||||
| 2026-01-20 | 13F | Cromwell Holdings LLC | 0 | -100,00 | 0 | |||||
| 2026-02-11 | 13F | Paces Ferry Wealth Advisors, Llc | 0 | -100,00 | 0 | |||||
| 2025-09-26 | NP | IAUTX - INVESCO Dividend Income Fund Class A | 997.882 | 0,00 | 33.160 | -2,84 | ||||
| 2026-02-13 | 13F | Colony Group, LLC | 1.048.173 | 42,21 | 31.343 | 35,37 | ||||
| 2025-11-05 | 13F | Fullcircle Wealth Llc | 43.905 | -0,35 | 1.205 | -16,04 | ||||
| 2026-02-11 | 13F | Clearbridge Investments, LLC | 18.488.681 | -1,14 | 552.375 | -5,99 | ||||
| 2026-02-11 | 13F | Renaissance Group Llc | 12.654 | 0,47 | 378 | -4,30 | ||||
| 2026-02-09 | 13F | Wellington Shields & Co., LLC | 18.269 | -18,33 | 546 | -22,22 | ||||
| 2026-02-05 | 13F | Meridian Financial Partners LLC | 27.635 | -11,07 | 798 | -16,53 | ||||
| 2026-01-09 | 13F | Diversified Trust Co | 272.399 | 11,79 | 8.142 | 6,35 | ||||
| 2026-02-02 | 13F | Hussman Strategic Advisors, Inc. | 0 | -100,00 | 0 | |||||
| 2026-01-12 | 13F | Thrive Wealth Management, LLC | 10.385 | -22,34 | 310 | -26,19 | ||||
| 2026-02-02 | 13F | Mcdonald Partners Llc | 0 | -100,00 | 0 | |||||
| 2026-01-12 | 13F | Heartwood Wealth Advisors LLC | 0 | -100,00 | 0 | |||||
| 2026-02-11 | 13F | Patron Partners Advisors, Llc | 13.949 | -1,15 | 417 | -6,09 | ||||
| 2026-02-27 | 13F/A | Barclays Plc | Call | 0 | -100,00 | 0 | ||||
| 2026-02-13 | 13F | Bard Associates Inc | 0 | 0 | ||||||
| 2026-02-11 | 13F | Marks Group Wealth Management, Inc | 67.462 | 131,80 | 2.016 | 120,57 | ||||
| 2026-02-13 | 13F | Ingalls & Snyder Llc | 39.417 | -5,98 | 1 | 0,00 | ||||
| 2025-09-25 | NP | TMAAX - Thrivent Moderately Aggressive Allocation Fund Class A | 143.621 | 38,13 | 4.773 | 34,23 | ||||
| 2026-02-03 | 13F | SBI Securities Co., Ltd. | 4.939 | 2,28 | 148 | -2,65 | ||||
| 2025-10-17 | 13F | FSC Wealth Advisors, LLC | 0 | -100,00 | 0 | -100,00 | ||||
| 2026-02-11 | 13F | OneAscent Financial Services LLC | 16.927 | 4,40 | 506 | -0,79 | ||||
| 2026-02-10 | 13F | Welch & Forbes Llc | 254.480 | -32,30 | 7.606 | -35,59 | ||||
| 2026-01-30 | 13F | Turning Point Benefit Group, Inc. | 574 | -10,59 | 17 | -10,53 | ||||
| 2026-02-17 | 13F | Two Sigma Securities, Llc | 9.415 | 281 | ||||||
| 2026-01-05 | 13F | Park Avenue Securities Llc | 70.559 | -7,30 | 2 | 0,00 | ||||
| 2026-01-29 | 13F | Sentinel Trust Co Lba | 20.048 | 0,00 | 1 | |||||
| 2026-02-10 | 13F | Beaton Management Co. Inc. | 11.346 | 0,00 | 0 | |||||
| 2026-02-17 | 13F | Lombard Odier Asset Management (USA) Corp | Call | 0 | -100,00 | 0 | ||||
| 2026-03-12 | 13F | Nalls Sherbakoff Group, Llc | 278 | -21,91 | 8 | -46,67 | ||||
| 2025-09-26 | NP | FDGFX - Fidelity Dividend Growth Fund This fund is a listed as child fund of Fmr Llc and if that institution has disclosed ownership in this security, then these positions will not be double counted when calculating total shares and total value | 1.167.992 | -39,17 | 38.812 | -40,89 | ||||
| 2026-01-27 | 13F | TD Waterhouse Canada Inc. | 126.252 | 8,59 | 3.774 | -21,80 | ||||
| 2026-02-17 | 13F | Warren Averett Asset Management, LLC | 201.211 | 109,09 | 6.014 | 98,94 | ||||
| 2026-01-12 | 13F | JGP Wealth Management, LLC | 0 | -100,00 | 0 | |||||
| 2026-02-06 | 13F | Kennedy Investment Group | 17.655 | 1,49 | 528 | -3,48 | ||||
| 2026-02-13 | 13F | Lavaca Capital Llc | 0 | -100,00 | 0 | |||||
| 2026-01-13 | 13F | Ferguson Wellman Capital Management, Inc | 0 | -100,00 | 0 | |||||
| 2026-01-27 | 13F | Wealth Enhancement Trust Services, Inc. | 569 | 17 | ||||||
| 2025-09-29 | NP | SPDV - AAM S&P 500 High Dividend Value ETF | 44.636 | 25,77 | 1.483 | 22,26 | ||||
| 2025-09-24 | NP | BLACKROCK EQUITY DIVIDEND FUND - BLACKROCK EQUITY DIVIDEND FUND Investor A This fund is a listed as child fund of BlackRock, Inc. and if that institution has disclosed ownership in this security, then these positions will not be double counted when calculating total shares and total value | 8.480.040 | -3,07 | 281.792 | -5,81 | ||||
| 2026-02-12 | 13F | Federated Hermes, Inc. | 211.991 | -27,71 | 6.336 | -31,23 | ||||
| 2026-02-13 | 13F | Sei Investments Co | 3.726.843 | 0,74 | 111.402 | -4,17 | ||||
| 2026-01-07 | 13F | Sagespring Wealth Partners, Llc | 51.585 | -12,20 | 1.542 | -16,48 | ||||
| 2026-02-05 | 13F | Sapient Capital Llc | 27.297 | 2,05 | 818 | -2,85 | ||||
| 2025-09-26 | NP | PCEQX - Victory Pioneer Equity Income Fund Class C | 565.806 | 0,00 | 18.802 | -2,84 | ||||
| 2026-02-11 | 13F | Janney Montgomery Scott LLC | 2.541.652 | -35,27 | 76 | -39,02 | ||||
| 2025-10-21 | 13F | Brookwood Investment Group LLC | 0 | -100,00 | 0 | |||||
| 2026-02-13 | 13F | Graney & King, LLC | 42 | 0,00 | 1 | 0,00 | ||||
| 2026-02-12 | 13F | Federation des caisses Desjardins du Quebec | 313.606 | -26,19 | 9.374 | -29,79 | ||||
| 2025-09-24 | NP | SWDSX - Schwab Dividend Equity Fund This fund is a listed as child fund of Charles Schwab Investment Management Inc and if that institution has disclosed ownership in this security, then these positions will not be double counted when calculating total shares and total value | 260.000 | 0,00 | 8.640 | -2,85 | ||||
| 2026-02-09 | 13F | Catalyst Funds Management Pty Ltd | 12.000 | -56,20 | 359 | -58,37 | ||||
| 2026-02-13 | 13F | Fayez Sarofim & Co | 502.224 | -59,46 | 15.011 | -61,44 | ||||
| 2026-01-12 | 13F | Horizon Financial Services, Llc | 3.428 | 0,00 | 102 | -4,67 | ||||
| 2026-02-17 | 13F/A | Intesa Sanpaolo S.p.a. | 54.169 | 1.623 | ||||||
| 2026-01-21 | 13F | Stone House Investment Management, LLC | 164 | 763,16 | 5 | |||||
| 2026-02-17 | 13F | Trexquant Investment LP | 0 | -100,00 | 0 | |||||
| 2026-01-27 | 13F | Traphagen Investment Advisors Llc | 10.430 | -5,02 | 312 | -9,86 | ||||
| 2026-02-13 | 13F | Treasurer of the State of North Carolina | 1.702.427 | -20,99 | 51 | -25,37 | ||||
| 2026-01-12 | 13F | Salvus Wealth Management, LLC | 0 | -100,00 | 0 | |||||
| 2026-02-19 | 13F | Atomi Financial Group, Inc. | 26.725 | -0,10 | 799 | -5,00 | ||||
| 2026-02-12 | 13F | Wesleyan Assurance Society | 121.000 | 0,00 | 4 | 0,00 | ||||
| 2026-02-13 | 13F | Senator Investment Group LP | 1.170.000 | 34.971 | ||||||
| 2026-01-13 | 13F | Stablepoint Partners, LLC | 37.194 | -26,54 | 1.112 | -30,13 | ||||
| 2025-10-21 | 13F | Cascade Financial Partners, LLC | 0 | -100,00 | 0 | |||||
| 2026-01-09 | 13F | Appleton Partners Inc/ma | 33.805 | -3,83 | 1 | 0,00 | ||||
| 2026-02-06 | 13F | Gsa Capital Partners Llp | 7.875 | -91,06 | 0 | -100,00 | ||||
| 2026-02-09 | 13F | King Luther Capital Management Corp | 39.140 | -13,11 | 1.170 | -17,39 | ||||
| 2026-02-17 | 13F | Benchstone Capital Management LP | 366.713 | 10.961 | ||||||
| 2025-09-25 | NP | ESG - FlexShares STOXX US ESG Impact Index Fund | 6.831 | -3,87 | 227 | -7,00 | ||||
| 2026-02-27 | 13F | Groupama Asset Managment | 107.135 | -7,89 | 3.202 | -12,37 | ||||
| 2026-01-27 | 13F | Arcataur Capital Management LLC | 7.669 | -0,71 | 229 | -5,37 | ||||
| 2025-09-24 | NP | SWPPX - Schwab S&P 500 Index Fund This fund is a listed as child fund of Charles Schwab Investment Management Inc and if that institution has disclosed ownership in this security, then these positions will not be double counted when calculating total shares and total value | 8.305.093 | -0,62 | 275.978 | -3,44 | ||||
| 2026-01-06 | 13F | RDA Financial Network | 10.420 | -2,56 | 311 | -7,16 | ||||
| 2025-09-19 | NP | BHBFX - Madison Dividend Income Fund Dividend Income Fund Class Y | 89.700 | -6,66 | 2.981 | -9,31 | ||||
| 2026-02-05 | 13F | Allworth Financial LP | 252.418 | 178,79 | 7.545 | 165,26 | ||||
| 2025-09-25 | NP | DGRO - iShares Core Dividend Growth ETF | 10.635.579 | 10,95 | 353.420 | 7,80 | ||||
| 2026-02-06 | 13F | Frisch Financial Group, Inc. | 7.237 | -3,70 | 216 | -8,47 | ||||
| 2026-02-10 | 13F | Principia Wealth Advisory, LLC | 182 | 46,77 | 5 | 66,67 | ||||
| 2026-01-30 | 13F | Oakworth Capital, Inc. | 5.479 | 7,39 | 164 | 1,88 | ||||
| 2025-09-26 | NP | TOV - JLens 500 Jewish Advocacy U.S. ETF | 11.945 | 18,76 | 397 | 15,45 | ||||
| 2025-09-29 | NP | PTLC - Pacer Trendpilot US Large Cap ETF | 233.591 | -10,11 | 7.762 | -11,26 | ||||
| 2025-09-26 | NP | NUGAX - Nuveen Santa Barbara Global Dividend Growth Fund Class A This fund is a listed as child fund of Nuveen Asset Management, LLC and if that institution has disclosed ownership in this security, then these positions will not be double counted when calculating total shares and total value | 7.040 | -3,22 | 234 | -6,05 | ||||
| 2026-01-26 | 13F | Old Point Trust & Financial Services N A | 200 | -47,64 | 6 | -58,33 | ||||
| 2025-11-07 | 13F | Beacon Capital Management, LLC | 0 | -100,00 | 0 | |||||
| 2026-02-17 | 13F | Man Group plc | 7.457.314 | -11,07 | 222.899 | -15,40 | ||||
| 2026-02-13 | 13F | SYM FINANCIAL Corp | 9.001 | 269 | ||||||
| 2025-10-17 | 13F | Constitution Capital LLC | 0 | -100,00 | 0 | |||||
| 2026-02-13 | 13F | 71 West Capital Partners | 7.319 | 219 | ||||||
| 2026-02-17 | 13F | Coppell Advisory Solutions LLC | 54.723 | 13,41 | 1.640 | 7,97 | ||||
| 2026-01-23 | 13F | Newton One Investments LLC | 491 | 0,00 | 15 | -6,67 | ||||
| 2026-02-12 | 13F | Andra AP-fonden | 625.393 | -7,82 | 18.693 | -12,31 | ||||
| 2025-09-25 | NP | Reaves Utility Income Fund | 1.832.400 | 0,00 | 60.891 | -2,84 | ||||
| 2025-09-26 | NP | PASIX - PACE Alternative Strategies Investments Class A | 252 | 0,00 | 8 | 0,00 | ||||
| 2026-01-29 | 13F | State Of Michigan Retirement System | 1.132.489 | 3,58 | 33.850 | -1,47 | ||||
| 2026-01-23 | 13F | LOM Asset Management Ltd | 6.925 | -17,61 | 207 | -21,97 | ||||
| 2025-11-14 | 13F | Eqis Capital Management, Inc. | 0 | -100,00 | 0 | |||||
| 2026-02-11 | 13F | MidWestOne Financial Group, Inc. | 27.935 | 15,68 | 835 | 10,03 | ||||
| 2026-01-09 | 13F | Somerset Trust Co | 63.673 | 1,25 | 1.903 | -3,65 | ||||
| 2026-02-13 | 13F | Capstone Wealth Management Group, Llc | 9.090 | 272 | ||||||
| 2026-02-10 | 13F | Norges Bank | 83.594.032 | 2.498.626 | ||||||
| 2025-10-24 | 13F | Hemington Wealth Management | 7.784 | -3,46 | 0 | |||||
| 2026-01-28 | 13F | Old National Bancorp /in/ | 30.973 | -18,46 | 926 | -22,46 | ||||
| 2026-02-06 | 13F | Redmont Wealth Advisors Llc | 104 | -52,51 | 3 | -50,00 | ||||
| 2025-10-22 | 13F | Five Oceans Advisors | 0 | -100,00 | 0 | -100,00 | ||||
| 2026-01-21 | 13F | Rocky Mountain Advisers, Llc | 46 | 1 | ||||||
| 2026-01-23 | 13F | Smith, Moore & Co. | 8.746 | -69,23 | 261 | -70,77 | ||||
| 2026-02-10 | 13F | Intech Investment Management Llc | 373.159 | -13,21 | 11.154 | -17,44 | ||||
| 2025-10-24 | 13F | Evergreen Private Wealth LLC | 0 | -100,00 | 0 | |||||
| 2026-01-14 | 13F | InvesTrust | 11.610 | -1,51 | 347 | -6,22 | ||||
| 2026-01-21 | 13F | Master's Wealth Management Inc. | 7.619 | 0,03 | 228 | -5,02 | ||||
| 2026-02-03 | 13F | Drucker Wealth 3.0, LLC | 41.539 | 92,11 | 1.242 | 82,77 | ||||
| 2026-02-17 | 13F | Stokes Family Office, LLC | 22.725 | -0,83 | 679 | -5,56 | ||||
| 2026-01-08 | 13F | Legacy Private Trust Co. | 0 | -100,00 | 0 | |||||
| 2025-09-29 | NP | PBP - Invesco S&P 500 BuyWrite ETF This fund is a listed as child fund of Invesco Ltd. and if that institution has disclosed ownership in this security, then these positions will not be double counted when calculating total shares and total value | 19.887 | 74,95 | 661 | 70,10 | ||||
| 2026-02-05 | 13F | Bright Futures Wealth Management, LLC. | 10.626 | 9,06 | 318 | 3,59 | ||||
| 2026-02-10 | 13F | Operose Advisors LLC | 2.000 | -26,87 | 60 | -30,59 | ||||
| 2026-01-26 | 13F | Kiley Juergens Wealth Management, Llc | 12.646 | -9,67 | 378 | -14,12 | ||||
| 2026-02-05 | 13F | Conning Inc. | 54.337 | -94,56 | 1.624 | -94,83 | ||||
| 2025-09-29 | NP | LGDX - Intech S&P Large Cap Diversified Alpha ETF | 7.748 | -43,78 | 257 | -45,44 | ||||
| 2026-02-17 | 13F | EFG International AG | 40.541 | 1.135 | ||||||
| 2025-09-29 | NP | PKW - Invesco BuyBack Achievers ETF This fund is a listed as child fund of Invesco Ltd. and if that institution has disclosed ownership in this security, then these positions will not be double counted when calculating total shares and total value | 2.214.282 | 36,83 | 73.581 | 32,95 | ||||
| 2026-02-13 | 13F | Twin City Private Wealth, Llc | 87.166 | 0,54 | 2.605 | -4,33 | ||||
| 2026-02-12 | 13F | StoneX Group Inc. | 49.263 | -12,61 | 1.473 | -16,88 | ||||
| 2026-02-11 | 13F | XML Financial, LLC | 37.692 | -2,65 | 1.127 | -7,40 | ||||
| 2026-02-03 | 13F | Patten & Patten Inc/tn | 18.747 | -27,29 | 560 | -30,86 | ||||
| 2025-11-14 | 13F | Capstone Investment Advisors, Llc | Put | 693.200 | 394,08 | 21.780 | 334,99 | |||
| 2026-01-27 | 13F | Berger Financial Group, Inc | 157.480 | -0,69 | 4.707 | -5,52 | ||||
| 2025-11-14 | 13F | Capstone Investment Advisors, Llc | Call | 210.100 | 77,00 | 6.601 | 55,83 | |||
| 2026-02-17 | 13F/A | Beverly Hills Private Wealth, LLC | 99.081 | -20,05 | 2.962 | -23,96 | ||||
| 2026-02-03 | 13F | Gateway Investment Advisers Llc | 26.636 | -5,77 | 796 | -10,36 | ||||
| 2026-02-06 | 13F | Bare Financial Services, Inc | 81 | -71,88 | 2 | -77,78 | ||||
| 2025-10-17 | 13F | Montgomery Investment Management Inc | 0 | -100,00 | 0 | -100,00 | ||||
| 2026-01-20 | 13F | Cornell Pochily Investment Advisors, Inc. | 10.619 | 5,81 | 317 | 0,63 | ||||
| 2025-11-04 | 13F | Cutler Investment Counsel Llc | 0 | -100,00 | 0 | |||||
| 2026-02-12 | 13F | Adviser Investments LLC | 37.171 | -2,93 | 1.111 | -7,65 | ||||
| 2026-02-09 | 13F | Mediolanum International Funds Ltd | 1.382.191 | 52,47 | 41.424 | 45,11 | ||||
| 2026-03-04 | 13F | Rehmann Capital Advisory Group | 18.595 | -30,38 | 559 | -33,17 | ||||
| 2026-01-30 | 13F | Us Bancorp \de\ | 1.661.443 | -18,78 | 49.661 | -22,73 | ||||
| 2026-02-09 | 13F | Van Cleef Asset Management,Inc | 236.319 | -46,89 | 7.064 | -49,48 | ||||
| 2026-01-26 | 13F | Riverview Trust Co | 1.040 | -59,85 | 31 | -61,73 | ||||
| 2026-01-13 | 13F | Mayflower Financial Advisors, LLC | 11.885 | -19,08 | 355 | -22,99 | ||||
| 2026-01-27 | 13F | Old Second National Bank Of Aurora | 21.628 | -13,16 | 646 | -17,39 | ||||
| 2026-02-11 | 13F | Capital World Investors | 140.343.399 | 20,80 | 4.194.929 | 14,92 | ||||
| 2026-02-04 | 13F | Community Bank, N.A. | 33.643 | 123,35 | 1.005 | 112,47 | ||||
| 2026-01-14 | 13F | Eastern Bank | 13.622 | -2,99 | 407 | -7,71 | ||||
| 2026-02-17 | 13F | Gallagher Fiduciary Advisors, LLC | 10.895 | 2,14 | 326 | -2,99 | ||||
| 2026-02-13 | 13F | GM Advisory Group, Inc. | 6.871 | -45,04 | 205 | -47,70 | ||||
| 2026-01-02 | 13F | First Financial Bank - Trust Division | 12.971 | -0,66 | 388 | -5,61 | ||||
| 2026-02-06 | 13F | Mraz, Amerine & Associates, Inc. | 7.427 | 0,00 | 222 | -5,15 | ||||
| 2026-02-17 | 13F | Modern Wealth Management, LLC | 14.713 | -1,02 | 440 | -6,00 | ||||
| 2026-02-17 | 13F | Lombard Odier Asset Management (Switzerland) SA | 95.442 | -13,43 | 2.853 | -17,64 |