Grundlæggende statistik
| Porteføljeværdi | $ 418.373 |
| Nuværende stillinger | 116 |
Seneste beholdninger, ydeevne, AUM (fra 13F, 13D)
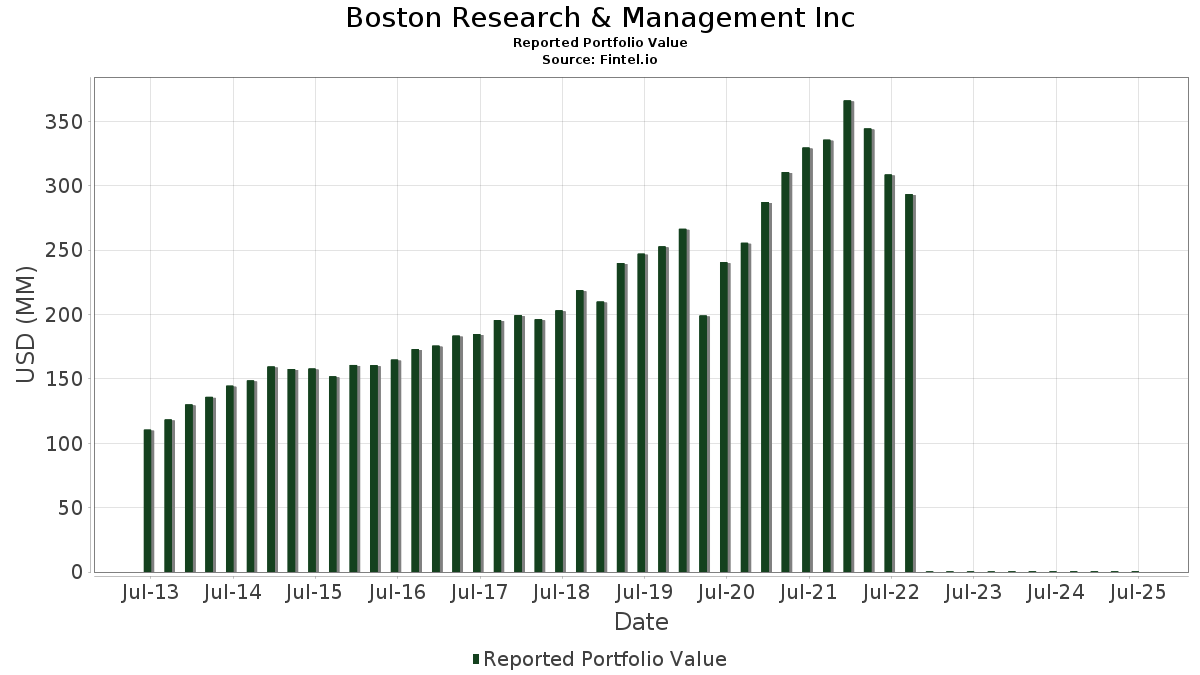
Boston Research & Management Inc har afsløret 116 samlede besiddelser i deres seneste SEC-arkivering. Den seneste porteføljeværdi er beregnet til at være $ 418.373 USD. Faktiske aktiver under forvaltning (AUM) er denne værdi plus kontanter (som ikke er oplyst). Boston Research & Management Incs største beholdninger er Microsoft Corporation (US:MSFT) , iShares Trust - iShares Core S&P 500 ETF (US:IVV) , Walmart Inc. (US:WMT) , Apple Inc. (US:AAPL) , and Mastercard Incorporated (US:MA) . Boston Research & Management Incs nye stillinger omfatter GE Vernova Inc. (US:GEV) , GS Connect S&P GSCI Enhanced Commodity Total Return ETN (US:GSCE) , .
Top øger dette kvartal
Vi bruger ændringen i porteføljeallokeringen, fordi dette er den mest meningsfulde metrik. Ændringer kan skyldes handler eller ændringer i aktiekurser.
| Sikkerhed | Aktier (MM) |
Værdi (MM$) |
Portefølje % | ΔPortefølje % |
|---|---|---|---|---|
| 0,04 | 0,02 | 4,9222 | 1,0108 | |
| 0,04 | 0,01 | 1,4819 | 0,4293 | |
| 0,04 | 0,01 | 2,4313 | 0,2609 | |
| 0,05 | 0,01 | 1,3775 | 0,2347 | |
| 0,03 | 0,01 | 1,8252 | 0,1981 | |
| 0,05 | 0,01 | 2,1839 | 0,1879 | |
| 0,01 | 0,00 | 0,5172 | 0,1649 | |
| 0,14 | 0,01 | 2,4003 | 0,1648 | |
| 0,13 | 0,01 | 3,0255 | 0,1621 | |
| 0,03 | 0,02 | 4,3963 | 0,1462 |
Top falder i dette kvartal
Vi bruger ændringen i porteføljeallokeringen, fordi dette er den mest meningsfulde metrik. Ændringer kan skyldes handler eller ændringer i aktiekurser.
| Sikkerhed | Aktier (MM) |
Værdi (MM$) |
Portefølje % | ΔPortefølje % |
|---|---|---|---|---|
| 0,05 | 0,01 | 2,2709 | -0,3750 | |
| 0,02 | 0,01 | 2,1945 | -0,3238 | |
| 0,06 | 0,01 | 2,8059 | -0,3131 | |
| 0,04 | 0,00 | 0,8913 | -0,2286 | |
| 0,11 | 0,01 | 1,4052 | -0,2251 | |
| 0,03 | 0,01 | 1,7470 | -0,1676 | |
| 0,18 | 0,01 | 2,2272 | -0,1667 | |
| 0,05 | 0,01 | 1,4112 | -0,1662 | |
| 0,05 | 0,00 | 0,8641 | -0,1638 | |
| 0,04 | 0,01 | 1,7076 | -0,1574 |
13F og Fondsarkivering
Denne formular blev indsendt den 2025-08-12 for rapporteringsperioden 2025-06-30. Klik på linkikonet for at se den fulde transaktionshistorik.
Opgrader for at låse op for premium-data og eksportere til Excel ![]() .
.
| Sikkerhed | Type | Gennemsnitlig aktiekurs | Aktier (MM) |
Δ Aktier (%) |
Δ Aktier (%) |
Værdi ($MM) |
Portefølje (%) |
ΔPortefølje (%) |
|
|---|---|---|---|---|---|---|---|---|---|
| MSFT / Microsoft Corporation | 0,04 | -1,33 | 0,02 | 33,33 | 4,9222 | 1,0108 | |||
| IVV / iShares Trust - iShares Core S&P 500 ETF | 0,03 | -2,74 | 0,02 | 5,88 | 4,3963 | 0,1462 | |||
| WMT / Walmart Inc. | 0,13 | -1,44 | 0,01 | 9,09 | 3,0255 | 0,1621 | |||
| AAPL / Apple Inc. | 0,06 | 1,19 | 0,01 | -8,33 | 2,8059 | -0,3131 | |||
| MA / Mastercard Incorporated | 0,02 | -1,90 | 0,01 | 0,00 | 2,7428 | -0,0906 | |||
| JPM / JPMorgan Chase & Co. | 0,04 | -1,52 | 0,01 | 25,00 | 2,4313 | 0,2609 | |||
| CSCO / Cisco Systems, Inc. | 0,14 | -0,78 | 0,01 | 11,11 | 2,4003 | 0,1648 | |||
| ABBV / AbbVie Inc. | 0,05 | 0,65 | 0,01 | -10,00 | 2,2709 | -0,3750 | |||
| TSCO / Tractor Supply Company | 0,18 | 0,92 | 0,01 | 0,00 | 2,2272 | -0,1667 | |||
| BRK.B / Berkshire Hathaway Inc. | 0,02 | -0,74 | 0,01 | -10,00 | 2,1945 | -0,3238 | |||
| GOOGL / Alphabet Inc. | 0,05 | -0,25 | 0,01 | 12,50 | 2,1839 | 0,1879 | |||
| FAST / Fastenal Company | 0,21 | 98,04 | 0,01 | 0,00 | 2,1208 | 0,0667 | |||
| XYL / Xylem Inc. | 0,06 | -0,20 | 0,01 | 14,29 | 2,0001 | 0,0773 | |||
| IJR / iShares Trust - iShares Core S&P Small-Cap ETF | 0,08 | 3,17 | 0,01 | 14,29 | 1,9901 | 0,0728 | |||
| ABT / Abbott Laboratories | 0,06 | -1,55 | 0,01 | 0,00 | 1,8983 | -0,0555 | |||
| BK / The Bank of New York Mellon Corporation | 0,09 | -2,30 | 0,01 | 0,00 | 1,8837 | 0,0399 | |||
| AMZN / Amazon.com, Inc. | 0,03 | 1,07 | 0,01 | 16,67 | 1,8252 | 0,1981 | |||
| LIN / Linde plc | 0,02 | 0,41 | 0,01 | 0,00 | 1,7781 | -0,0479 | |||
| MCD / McDonald's Corporation | 0,03 | 1,35 | 0,01 | 0,00 | 1,7470 | -0,1676 | |||
| GJR / Strats Trust For Procter & Gambel Security - Preferred Security | 0,04 | 1,75 | 0,01 | 0,00 | 1,7076 | -0,1574 | |||
| IEMG / iShares, Inc. - iShares Core MSCI Emerging Markets ETF | 0,11 | 1,44 | 0,01 | 20,00 | 1,5352 | 0,1215 | |||
| LH / Labcorp Holdings Inc. | 0,02 | -0,84 | 0,01 | 20,00 | 1,5159 | 0,1079 | |||
| NVDA / NVIDIA Corporation | 0,04 | 0,32 | 0,01 | 50,00 | 1,4819 | 0,4293 | |||
| XOM / Exxon Mobil Corporation | 0,05 | 2,55 | 0,01 | -16,67 | 1,4112 | -0,1662 | |||
| SNA / Snap-on Incorporated | 0,02 | 2,74 | 0,01 | -16,67 | 1,4107 | -0,1341 | |||
| IEFA / iShares Trust - iShares Core MSCI EAFE ETF | 0,07 | 2,36 | 0,01 | 0,00 | 1,4076 | 0,1131 | |||
| GIS / General Mills, Inc. | 0,11 | 3,35 | 0,01 | -16,67 | 1,4052 | -0,2251 | |||
| DIS / The Walt Disney Company | 0,05 | -0,33 | 0,01 | 25,00 | 1,3775 | 0,2347 | |||
| CL / Colgate-Palmolive Company | 0,06 | -0,07 | 0,01 | 0,00 | 1,3674 | -0,0979 | |||
| 0Y0Y / Accenture plc | 0,02 | 2,70 | 0,01 | 0,00 | 1,3612 | -0,0763 | |||
| DHI / D.R. Horton, Inc. | 0,04 | 6,05 | 0,01 | 0,00 | 1,3077 | 0,0444 | |||
| DUK / Duke Energy Corporation | 0,05 | 2,53 | 0,01 | 0,00 | 1,2876 | -0,0608 | |||
| KO / The Coca-Cola Company | 0,08 | -1,61 | 0,01 | 0,00 | 1,2807 | -0,0884 | |||
| NEE / NextEra Energy, Inc. | 0,08 | 2,87 | 0,01 | 0,00 | 1,2761 | -0,0402 | |||
| MRK / Merck & Co., Inc. | 0,07 | 7,11 | 0,01 | 0,00 | 1,2745 | -0,1271 | |||
| LMT / Lockheed Martin Corporation | 0,01 | 3,49 | 0,01 | 25,00 | 1,2735 | 0,0406 | |||
| SYY / Sysco Corporation | 0,07 | 3,77 | 0,01 | 25,00 | 1,2345 | 0,0100 | |||
| CMCSA / Comcast Corporation | 0,14 | 3,35 | 0,00 | 0,00 | 1,1688 | -0,0458 | |||
| PEP / PepsiCo, Inc. | 0,04 | 3,94 | 0,00 | -20,00 | 1,1502 | -0,1555 | |||
| VZ / Verizon Communications Inc. | 0,11 | 4,15 | 0,00 | 0,00 | 1,1165 | -0,0509 | |||
| ADBE / Adobe Inc. | 0,01 | 1,41 | 0,00 | 0,00 | 1,0981 | -0,0172 | |||
| IWM / iShares Trust - iShares Russell 2000 ETF | 0,02 | -0,16 | 0,00 | 0,00 | 1,0818 | 0,0413 | |||
| CTAS / Cintas Corporation | 0,02 | 0,00 | 0,00 | 0,00 | 1,0797 | 0,0451 | |||
| TMO / Thermo Fisher Scientific Inc. | 0,01 | 17,60 | 0,00 | 0,00 | 1,0615 | -0,0895 | |||
| USB / U.S. Bancorp | 0,10 | 5,31 | 0,00 | 33,33 | 1,0603 | 0,0844 | |||
| MDT / Medtronic plc | 0,05 | 4,12 | 0,00 | 0,00 | 1,0519 | -0,0303 | |||
| SPY / SPDR S&P 500 ETF | 0,01 | 0,01 | 0,00 | 33,33 | 1,0476 | 0,0623 | |||
| UPS / United Parcel Service, Inc. | 0,04 | 7,44 | 0,00 | 0,00 | 1,0287 | -0,0552 | |||
| VTI / Vanguard Index Funds - Vanguard Total Stock Market ETF | 0,01 | 0,00 | 0,00 | 0,00 | 0,8992 | 0,0544 | |||
| XLE / The Select Sector SPDR Trust - The Energy Select Sector SPDR Fund | 0,04 | -8,89 | 0,00 | -25,00 | 0,8913 | -0,2286 | |||
| OMC / Omnicom Group Inc. | 0,05 | 0,67 | 0,00 | -25,00 | 0,8641 | -0,1638 | |||
| COP / ConocoPhillips | 0,04 | 18,00 | 0,00 | 0,00 | 0,8483 | -0,0258 | |||
| LLY / Eli Lilly and Company | 0,00 | 0,00 | 0,00 | 0,00 | 0,7802 | -0,0785 | |||
| HD / The Home Depot, Inc. | 0,01 | 0,00 | 0,00 | 0,00 | 0,7716 | -0,0295 | |||
| IJH / iShares Trust - iShares Core S&P Mid-Cap ETF | 0,05 | 2,94 | 0,00 | 50,00 | 0,7446 | 0,0376 | |||
| IAU / iShares Gold Trust | 0,05 | -0,56 | 0,00 | 50,00 | 0,7431 | 0,0091 | |||
| HYG / iShares Trust - iShares iBoxx $ High Yield Corporate Bond ETF | 0,03 | -1,51 | 0,00 | 0,00 | 0,6126 | -0,0194 | |||
| VB / Vanguard Index Funds - Vanguard Small-Cap ETF | 0,01 | -1,94 | 0,00 | 0,00 | 0,5660 | 0,0050 | |||
| ORCL / Oracle Corporation | 0,01 | -2,51 | 0,00 | 100,00 | 0,5172 | 0,1649 | |||
| SYK / Stryker Corporation | 0,00 | 0,00 | 0,00 | 0,00 | 0,4116 | 0,0093 | |||
| GOOGL / Alphabet Inc. | 0,01 | -0,30 | 0,00 | 0,00 | 0,4078 | 0,0335 | |||
| BBH / VanEck ETF Trust - VanEck Biotech ETF | 0,01 | -4,41 | 0,00 | 0,00 | 0,3961 | -0,0457 | |||
| JNJ / Johnson & Johnson | 0,01 | 0,00 | 0,00 | 0,00 | 0,3526 | -0,0453 | |||
| IBB / iShares Trust - iShares Biotechnology ETF | 0,01 | -3,87 | 0,00 | 0,00 | 0,3466 | -0,0321 | |||
| CAT / Caterpillar Inc. | 0,00 | 0,00 | 0,00 | 0,00 | 0,3287 | 0,0386 | |||
| CVX / Chevron Corporation | 0,01 | -1,02 | 0,00 | 0,00 | 0,2914 | -0,0662 | |||
| VEU / Vanguard International Equity Index Funds - Vanguard FTSE All-World ex-US ETF | 0,02 | -5,21 | 0,00 | 0,00 | 0,2902 | 0,0031 | |||
| VEA / Vanguard Tax-Managed Funds - Vanguard FTSE Developed Markets ETF | 0,02 | -3,71 | 0,00 | 0,00 | 0,2754 | 0,0104 | |||
| PAYX / Paychex, Inc. | 0,01 | 0,00 | 0,00 | 0,00 | 0,2624 | -0,0269 | |||
| DIA / SPDR Dow Jones Industrial Average ETF Trust | 0,00 | -28,36 | 0,00 | 0,00 | 0,2538 | -0,0970 | |||
| IBM / International Business Machines Corporation | 0,00 | 0,00 | 0,00 | 0,2264 | 0,0279 | ||||
| HYD / VanEck ETF Trust - VanEck High Yield Muni ETF | 0,02 | -6,73 | 0,00 | 0,2008 | -0,0272 | ||||
| WM / Waste Management, Inc. | 0,00 | 0,00 | 0,00 | 0,1690 | -0,0086 | ||||
| VERSX / Vanguard Emerging Markets Stock Index Fund | 0,01 | -6,13 | 0,00 | 0,1668 | -0,0023 | ||||
| EMR / Emerson Electric Co. | 0,01 | 0,00 | 0,00 | 0,1623 | 0,0235 | ||||
| MMMCL / 3M Company | 0,00 | 0,00 | 0,00 | 0,1597 | -0,0005 | ||||
| YUM / Yum! Brands, Inc. | 0,00 | 0,00 | 0,00 | 0,1530 | -0,0156 | ||||
| ITW / Illinois Tool Works Inc. | 0,00 | 0,00 | 0,00 | 0,1523 | -0,0064 | ||||
| GE / General Electric Company | 0,00 | -1,66 | 0,00 | 0,1458 | 0,0261 | ||||
| MMC / Marsh & McLennan Companies, Inc. | 0,00 | 0,00 | 0,00 | 0,1367 | -0,0220 | ||||
| RSP / Invesco Exchange-Traded Fund Trust - Invesco S&P 500 Equal Weight ETF | 0,00 | 12,60 | 0,00 | 0,1341 | 0,0161 | ||||
| ADP / Automatic Data Processing, Inc. | 0,00 | -4,96 | 0,00 | 0,1200 | -0,0099 | ||||
| QCOM / QUALCOMM Incorporated | 0,00 | 0,00 | 0,00 | 0,1147 | -0,0002 | ||||
| AGG / iShares Trust - iShares Core U.S. Aggregate Bond ETF | 0,00 | 7,72 | 0,00 | 0,1114 | 0,0041 | ||||
| QQQ / Invesco QQQ Trust, Series 1 | 0,00 | 7,52 | 0,00 | 0,1111 | 0,0198 | ||||
| PFF / iShares Trust - iShares Preferred and Income Securities ETF | 0,02 | -3,86 | 0,00 | 0,1104 | -0,0090 | ||||
| SO / The Southern Company | 0,00 | 0,00 | 0,00 | 0,1033 | -0,0043 | ||||
| AOR / iShares Trust - iShares Core 60/40 Balanced Allocation ETF | 0,01 | -19,07 | 0,00 | 0,1011 | -0,0203 | ||||
| PPG / PPG Industries, Inc. | 0,00 | 0,00 | 0,00 | 0,1004 | 0,0001 | ||||
| TSLA / Tesla, Inc. | 0,00 | 0,00 | 0,00 | 0,0958 | 0,0146 | ||||
| KMB / Kimberly-Clark Corporation | 0,00 | 0,00 | 0,00 | 0,0932 | -0,0136 | ||||
| DHR / Danaher Corporation | 0,00 | 0,00 | 0,00 | 0,0903 | -0,0072 | ||||
| PFE / Pfizer Inc. | 0,02 | 0,00 | 0,00 | 0,0870 | -0,0074 | ||||
| AMGN / Amgen Inc. | 0,00 | 0,00 | 0,00 | 0,0825 | -0,0131 | ||||
| IXN / iShares Trust - iShares Global Tech ETF | 0,00 | 0,00 | 0,00 | 0,0794 | 0,0118 | ||||
| BXP / Boston Properties, Inc. | 0,00 | 0,00 | 0,00 | 0,0782 | -0,0025 | ||||
| GEV / GE Vernova Inc. | 0,00 | 0,00 | 0,0758 | 0,0758 | |||||
| BMY / Bristol-Myers Squibb Company | 0,01 | 0,00 | 0,00 | 0,0736 | -0,0272 | ||||
| GPC / Genuine Parts Company | 0,00 | 0,00 | 0,00 | 0,0691 | -0,0014 | ||||
| COST / Costco Wholesale Corporation | 0,00 | 0,00 | 0,00 | 0,0686 | 0,0006 | ||||
| IWF / iShares Trust - iShares Russell 1000 Growth ETF | 0,00 | -10,94 | 0,00 | 0,0653 | 0,0007 | ||||
| BA / The Boeing Company | 0,00 | 0,00 | 0,00 | 0,0650 | 0,0101 | ||||
| IWB / iShares Trust - iShares Russell 1000 ETF | 0,00 | 0,00 | 0,00 | 0,0621 | 0,0038 | ||||
| MAS / Masco Corporation | 0,00 | 0,00 | 0,00 | 0,0614 | -0,0076 | ||||
| AXP / American Express Company | 0,00 | 0,00 | 0,00 | 0,0610 | 0,0076 | ||||
| NUE / Nucor Corporation | 0,00 | 0,00 | 0,00 | 0,0598 | 0,0021 | ||||
| RTX / RTX Corporation | 0,00 | -2,10 | 0,00 | 0,0569 | 0,0020 | ||||
| UNH / UnitedHealth Group Incorporated | 0,00 | 0,00 | 0,00 | 0,0550 | -0,0411 | ||||
| GD / General Dynamics Corporation | 0,00 | 0,00 | 0,00 | 0,0535 | 0,0016 | ||||
| WOR / Worthington Enterprises, Inc. | 0,00 | 0,00 | 0,0531 | 0,0531 | |||||
| TXN / Texas Instruments Incorporated | 0,00 | 0,00 | 0,0526 | 0,0526 | |||||
| LOW / Lowe's Companies, Inc. | 0,00 | 0,00 | 0,00 | 0,0519 | -0,0048 | ||||
| GSCE / GS Connect S&P GSCI Enhanced Commodity Total Return ETN | 0,00 | 0,00 | 0,0507 | 0,0507 | |||||
| HPQ / HP Inc. | 0,01 | 0,00 | 0,00 | 0,0507 | -0,0089 | ||||
| A / Agilent Technologies, Inc. | 0,00 | -5,65 | 0,00 | 0,0488 | -0,0046 | ||||
| ESBA / Empire State Realty OP, L.P. - Limited Partnership | 0,01 | 0,00 | 0,00 | 0,0201 | -0,0005 | ||||
| WEC / WEC Energy Group, Inc. | 0,00 | -100,00 | 0,00 | 0,0000 | |||||
| CLX / The Clorox Company | 0,00 | -100,00 | 0,00 | 0,0000 | |||||
| YUMC / Yum China Holdings, Inc. | 0,00 | -100,00 | 0,00 | 0,0000 | |||||
| AFL / Aflac Incorporated | 0,00 | -100,00 | 0,00 | 0,0000 |