Grundlæggende statistik
| Institutionelle aktier (lange) | 1.142.432.161 - 106,97% (ex 13D/G) - change of 35,02MM shares 3,69% MRQ |
| Institutionel værdi (lang) | $ 100.856.606 USD ($1000) |
Institutionelt ejerskab og aktionærer
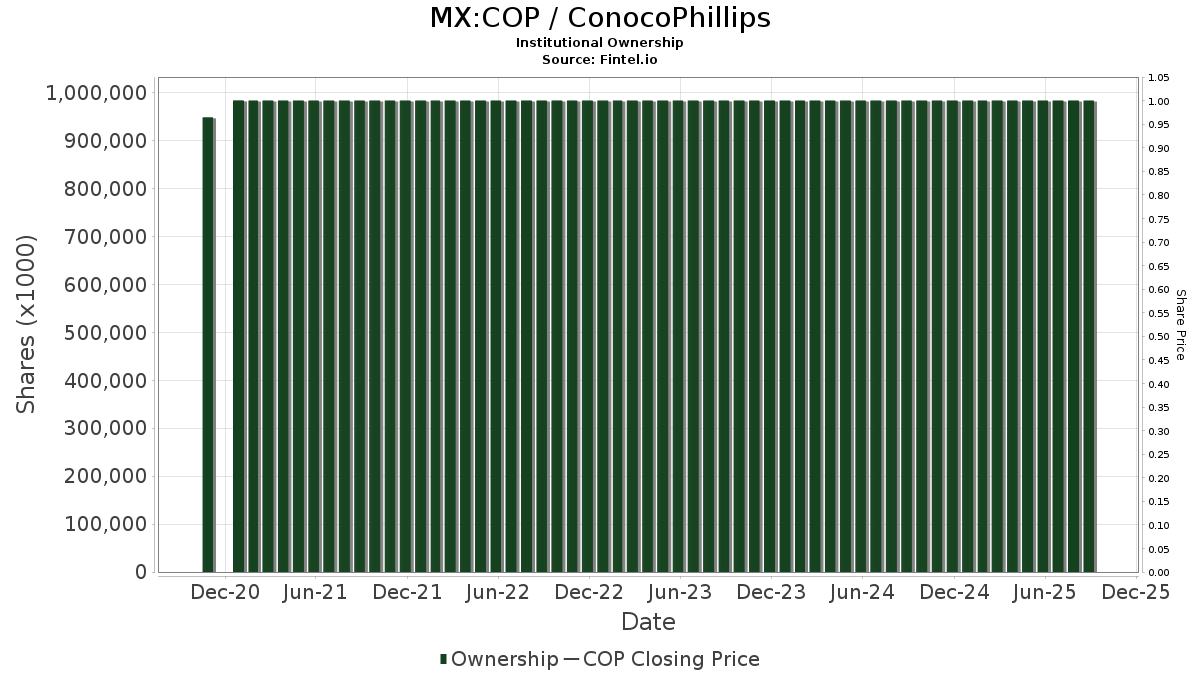
ConocoPhillips (MX:COP) har 2799 institutionelle ejere og aktionærer, der har indsendt 13D/G- eller 13F-formularer til Securities Exchange Commission (SEC). Disse institutioner har i alt 1,142,436,161 aktier. Største aktionærer omfatter Vanguard Group Inc, BlackRock, Inc., State Street Corp, Capital International Investors, Price T Rowe Associates Inc /md/, Charles Schwab Investment Management Inc, Geode Capital Management, Llc, Jpmorgan Chase & Co, Wellington Management Group Llp, and Harris Associates L P .
ConocoPhillips (BMV:COP) institutionel ejerskabsstruktur viser aktuelle positioner i virksomheden efter institutioner og fonde, samt seneste ændringer i positionsstørrelse. Større aktionærer kan omfatte individuelle investorer, investeringsforeninger, hedgefonde eller institutioner. Skema 13D angiver, at investoren besidder (eller besidder) mere end 5 % af virksomheden og har til hensigt (eller har til hensigt at) aktivt at forfølge en ændring i forretningsstrategi. Skema 13G indikerer en passiv investering på over 5%.
Fondens stemningsscore
Fund Sentiment Score (fka Ownership Accumulation Score) finder de aktier, der bliver mest købt af fonde. Det er resultatet af en sofistikeret, multi-faktor kvantitativ model, der identificerer virksomheder med de højeste niveauer af institutionel akkumulering. Scoringsmodellen bruger en kombination af den samlede stigning i oplyste ejere, ændringerne i porteføljeallokeringer i disse ejere og andre målinger. Tallet går fra 0 til 100, hvor højere tal indikerer et højere niveau af akkumulering for sine jævnaldrende, og 50 er gennemsnittet.
Opdateringsfrekvens: Dagligt
Se Ownership Explorer, som giver en liste over højest rangerende virksomheder.
AI+ Ask Fintel’s AI assistant about ConocoPhillips.
Select a question to share a public post with an AI-crafted answer.
Thinking of good questions…
13F og NPORT arkivering
Detaljer om 13F-arkivering er gratis. Detaljer om NP-ansøgninger kræver et premium-medlemskab. Grønne rækker angiver nye positioner. Røde rækker angiver lukkede positioner. Klik på linket ikon for at se den fulde transaktionshistorik.
Opgrader
for at låse premium-data op og eksportere til Excel ![]() .
.
Important Note
In an effort to reduce load times for our mobile users, we are testing some ways to deliver lighter pages.
In this first test, we will deliver only the most recent 750 transactions (out of 3231 for this stock). If you are interested in loading *all* the transactions for this company, click the "load all" button below. This is just a test and if you don't like it, please let us know by submitting some gentle feedback via the link at the bottom of this page.
Load All| Fil dato | Kilde | Investor | Type | Gennemsnitlig pris (Øst) |
Aktier | Δ Aktier (%) |
Rapporteret Værdi ($1000) |
Δ Værdi (%) |
Port Alloc (%) |
|
|---|---|---|---|---|---|---|---|---|---|---|
| 2025-09-26 | NP | BLUC - Bluemonte Large Cap Core ETF | 23 | 2 | ||||||
| 2025-09-26 | NP | LCEAX - Invesco Diversified Dividend Fund Class A | 1.627.157 | -16,97 | 155.133 | -11,17 | ||||
| 2026-02-12 | 13F | SWAN Capital LLC | 169 | 0,00 | 16 | 0,00 | ||||
| 2026-02-24 | 13F | MidFirst Bank | 6.528 | 387 | ||||||
| 2026-02-02 | 13F | Danske Bank A/s | 24.243 | 30,74 | 2.269 | 29,44 | ||||
| 2026-01-09 | 13F | Silvia Mccoll Wealth Management, Llc | 2.330 | 0,00 | 218 | -0,91 | ||||
| 2026-02-09 | 13F | Shufro Rose & Co Llc | 11.900 | -17,99 | 1.114 | -26,92 | ||||
| 2026-02-10 | 13F | Lido Advisors, LLC | 315.087 | 0,85 | 29.758 | 0,70 | ||||
| 2026-02-11 | 13F | Cookson Peirce & Co Inc | 9.787 | 13,22 | 916 | 12,12 | ||||
| 2026-01-21 | 13F | Raleigh Capital Management Inc. | 5.733 | -0,98 | 537 | -2,01 | ||||
| 2026-02-12 | 13F | Hamilton Point Investment Advisors, LLC | 2.536 | 237 | ||||||
| 2026-02-13 | 13F | William B. Walkup & Associates, Inc. | 22.753 | -1,41 | 2.130 | -2,47 | ||||
| 2025-09-26 | NP | Eaton Vance Tax-managed Diversified Equity Income Fund | 357.167 | -18,14 | 34.052 | -12,43 | ||||
| 2026-01-15 | 13F | Royal Fund Management, LLC | 2.706 | 23,67 | 253 | 22,82 | ||||
| 2025-09-17 | NP | NATIONWIDE MUTUAL FUNDS - Nationwide Fundamental All Cap Equity Portfolio Class R6 | 94.940 | -8,71 | 9.052 | -2,34 | ||||
| 2025-09-26 | NP | OWTEX - Old Westbury Total Equity Fund | 32.566 | 14,15 | 3.105 | 22,11 | ||||
| 2025-08-29 | NP | STXV - Strive 1000 Value ETF | 5.115 | -7,90 | 459 | -21,27 | ||||
| 2026-02-09 | 13F | Legal & General Group Plc | 6.939.728 | -4,99 | 649.628 | -5,97 | ||||
| 2026-01-20 | 13F | Savvy Advisors, Inc. | 24.271 | 28,64 | 2.272 | 27,30 | ||||
| 2026-02-09 | 13F | Knights of Columbus Asset Advisors LLC | 83.603 | 2,43 | 7.826 | 1,37 | ||||
| 2025-09-26 | NP | Ultimus Managers Trust - Westwood Salient Enhanced Energy Income ETF | 12.531 | 12,83 | 1.195 | 20,73 | ||||
| 2026-01-22 | 13F | Investment Advisory Services Inc /tx /adv | 5.244 | -7,77 | 491 | -8,75 | ||||
| 2025-09-24 | NP | REVS - Columbia Research Enhanced Value ETF | 5.186 | -3,08 | 494 | 3,78 | ||||
| 2026-02-05 | 13F | AlphaCore Capital LLC | 12.203 | 85,51 | 1.142 | 83,60 | ||||
| 2026-02-13 | 13F | Cladis Investment Advisory, LLC | 5.517 | 0,00 | 516 | -0,96 | ||||
| 2026-01-28 | 13F | Proathlete Wealth Management Llc | 2.370 | 0,21 | 222 | -0,90 | ||||
| 2026-01-22 | 13F | WealthBridge Investment Counsel Inc. | 36.590 | 1,95 | 3 | 0,00 | ||||
| 2026-02-17 | 13F | Integrated Advisors Network LLC | 14.516 | -18,41 | 1.359 | -19,26 | ||||
| 2026-01-30 | 13F | Folger Nolan Fleming Douglas Capital Management, Inc | 5.214 | -0,99 | 488 | -2,01 | ||||
| 2025-08-28 | NP | STFGX - State Farm Growth Fund | 26.673 | 0,00 | 2.394 | -14,57 | ||||
| 2026-01-23 | 13F | Reuter James Wealth Management, Llc | 5.806 | 0,02 | 543 | -1,09 | ||||
| 2025-09-24 | NP | TNXAX - 1290 DoubleLine Dynamic Allocation Fund Class A | 2.289 | -1,42 | 218 | 5,83 | ||||
| 2026-02-18 | 13F | EP Wealth Advisors, Inc. | 55.845 | 8,44 | 5.228 | 13,11 | ||||
| 2026-01-21 | 13F | SJS Investment Consulting Inc. | 1.080 | 23,15 | 101 | 23,17 | ||||
| 2026-01-15 | 13F | Brady Martz Wealth Solutions, LLC | 9.470 | -0,51 | 886 | -1,56 | ||||
| 2025-08-28 | NP | SLGAX - SIMT Large Cap Fund Class F | 73.687 | 0,00 | 6.613 | -14,55 | ||||
| 2026-01-26 | 13F | Chicago Capital, LLC | 4.447 | 2,89 | 416 | 1,96 | ||||
| 2025-08-28 | NP | DODBX - Dodge & Cox Balanced Fund | 525.224 | 0,00 | 47.134 | -14,55 | ||||
| 2026-01-21 | 13F | Clayton Financial Group LLC | 67 | 6 | ||||||
| 2026-01-22 | 13F | City Holding Co | 25.811 | -4,08 | 2.416 | -5,07 | ||||
| 2026-01-29 | 13F | Dunhill Financial, LLC | 39 | 44,44 | 4 | 50,00 | ||||
| 2025-09-26 | NP | FHEQ - Fidelity Hedged Equity ETF | 8 | -99,97 | 1 | -100,00 | ||||
| 2026-02-13 | 13F | Southeast Asset Advisors Inc. | 0 | -100,00 | 0 | |||||
| 2025-08-29 | NP | FTWO - Strive FAANG 2.0 ETF | 6.638 | 30,49 | 596 | 11,42 | ||||
| 2025-08-28 | NP | DIVP - Cullen Enhanced Equity Income ETF | 9.368 | 841 | ||||||
| 2026-02-14 | 13F | Rockefeller Capital Management L.P. | 443.191 | -23,42 | 41.490 | -24,21 | ||||
| 2026-02-13 | 13F | NLB Skladi, upravljanje premozenja, d.o.o. | 13.104 | 1.227 | ||||||
| 2026-02-13 | 13F | Pinnacle Wealth Planning Services, Inc. | 11.001 | -5,21 | 1.030 | -6,20 | ||||
| 2026-02-17 | 13F | Signature Equity Partners, LLC | 639 | 60 | ||||||
| 2026-02-10 | 13F | Core Wealth Advisors, Llc | 62 | 6 | ||||||
| 2026-01-22 | 13F | Iron Financial, LLC | 8.529 | -1,07 | 798 | -2,09 | ||||
| 2026-02-17 | 13F | Snowden Capital Advisors LLC | 20.294 | 7,34 | 1.900 | 6,21 | ||||
| 2026-02-13 | 13F | Neuberger Berman Group LLC | 2.123.306 | 31,96 | 198.764 | 30,59 | ||||
| 2026-01-26 | 13F | JNBA Financial Advisors | 1.384 | 0,00 | 130 | -0,77 | ||||
| 2026-02-13 | 13F | Level Four Advisory Services, Llc | 108.523 | -4,20 | 10.159 | -5,19 | ||||
| 2026-02-04 | 13F | Virginia Retirement Systems Et Al | 60.100 | -3,06 | 5.626 | -4,08 | ||||
| 2026-02-17 | 13F | CHICAGO TRUST Co NA | 0 | -100,00 | 0 | |||||
| 2025-09-24 | NP | RECS - Columbia Research Enhanced Core ETF | 104.312 | 899,73 | 9.945 | 702,66 | ||||
| 2026-01-20 | 13F | Toth Financial Advisory Corp | 5 | 0 | ||||||
| 2025-09-26 | NP | ENPIX - Oil & Gas Ultrasector Profund Investor Class | 11.403 | -65,09 | 1.087 | -62,66 | ||||
| 2026-02-10 | 13F | Crestmont Private Wealth LLC | 5.563 | -0,02 | 521 | -1,14 | ||||
| 2026-01-29 | 13F | State Of Michigan Retirement System | 323.528 | -4,23 | 30.285 | -5,23 | ||||
| 2026-01-21 | 13F | Future Financial Wealth Managment LLC | 0 | -100,00 | 0 | |||||
| 2026-01-13 | 13F | Mayflower Financial Advisors, LLC | 5.029 | 3,52 | 471 | 2,40 | ||||
| 2026-01-28 | 13F | Mowery & Schoenfeld Wealth Management, LLC | 158 | 0,00 | 15 | 0,00 | ||||
| 2026-02-12 | 13F | Conservest Capital Advisors, Inc. | 3.820 | -4,81 | 358 | -5,80 | ||||
| 2025-09-26 | NP | DSPIX - BNY Mellon Institutional S&P 500 Stock Index Fund Class I | 35.861 | -6,27 | 3.419 | 0,26 | ||||
| 2026-02-04 | 13F | Pandora Wealth, Inc. | 978 | 0,00 | 92 | -1,09 | ||||
| 2025-11-14 | 13F | Caption Management, LLC | Call | 0 | -100,00 | 0 | ||||
| 2026-02-12 | 13F | Advisors Asset Management, Inc. | 28.014 | -22,48 | 2.622 | -23,29 | ||||
| 2025-10-15 | 13F | Marshall & Sullivan Inc /wa/ | 0 | -100,00 | 0 | |||||
| 2026-01-14 | 13F | Southland Equity Partners LLC | 3.402 | -0,58 | 318 | -1,55 | ||||
| 2026-02-06 | 13F | Redmont Wealth Advisors Llc | 65 | 0,00 | 6 | 0,00 | ||||
| 2026-02-04 | 13F | Mascoma Wealth Management LLC | 235 | -29,22 | 22 | -32,26 | ||||
| 2026-02-09 | 13F | Parkside Investments, LLC | 26.116 | -66,80 | 2.445 | -67,15 | ||||
| 2025-09-04 | 13F | Abn Amro Investment Solutions | 0 | -100,00 | 0 | -100,00 | ||||
| 2026-02-13 | 13F | Resources Management Corp /ct/ /adv | 6.113 | -3,70 | 1 | |||||
| 2026-02-12 | 13F | Raiffeisen Bank International AG | 28.000 | 921,90 | 2.635 | 905,34 | ||||
| 2026-01-08 | 13F | Sanders Morris Harris Llc | 0 | -100,00 | 0 | |||||
| 2026-02-05 | 13F | RiverFront Investment Group, LLC | 7.688 | 1,00 | 720 | -0,14 | ||||
| 2025-10-07 | 13F | Carolina Wealth Advisors, LLC | 0 | -100,00 | 0 | -100,00 | ||||
| 2025-09-26 | NP | SUNAMERICA SERIES TRUST - SA Schroders VCP Global Allocation Portfolio Class 3 | 5.301 | -7,07 | 505 | -0,59 | ||||
| 2026-02-02 | 13F | Mutual Advisors, LLC | 20.682 | 9,26 | 1.936 | 13,55 | ||||
| 2026-02-17 | 13F | Berkshire Bank | 3.413 | -12,53 | 319 | -13,55 | ||||
| 2026-02-11 | 13F | Pettyjohn, Wood & White, Inc | 2.842 | 28,36 | 266 | 27,27 | ||||
| 2026-02-17 | 13F | Alliancebernstein L.p. | 1.817.420 | -8,56 | 170.129 | -9,51 | ||||
| 2026-01-16 | 13F | Crewe Advisors LLC | 1.060 | 2,81 | 99 | 2,06 | ||||
| 2026-02-10 | 13F | Godfrey Financial Associates, Inc. | 632 | 59 | ||||||
| 2026-02-13 | 13F | Pathstone Holdings, LLC | 183.964 | -0,62 | 17.221 | -1,66 | ||||
| 2026-02-12 | 13F | Principal Securities, Inc. | 29.736 | 2,08 | 2.784 | 1,02 | ||||
| 2026-02-17 | 13F | Limestone Investment Advisors LP | 910 | 85 | ||||||
| 2026-01-28 | 13F | Accretive Wealth Partners, LLC | 16.041 | 0,11 | 1.502 | -0,92 | ||||
| 2026-02-17 | 13F | Limestone Investment Advisors LP | Call | 8.400 | 90,91 | 786 | 88,94 | |||
| 2026-02-13 | 13F | Whalerock Point Partners, Llc | 3.836 | 0,00 | 359 | -0,83 | ||||
| 2026-02-12 | 13F | Rowland & Co Investment Counsel/adv | 39.402 | -1,17 | 3.688 | -2,20 | ||||
| 2025-10-30 | 13F | Traub Capital Management LLC | 0 | -100,00 | 0 | |||||
| 2026-01-23 | 13F | Monarch Capital Management Inc/ | 2.436 | -16,66 | 228 | -17,39 | ||||
| 2026-02-10 | 13F | Fiduciary Family Office, Llc | 2.846 | -3,95 | 266 | -5,00 | ||||
| 2026-02-13 | 13F | Chevy Chase Trust Holdings, Inc. | 705.312 | -1,80 | 66.024 | -2,81 | ||||
| 2026-01-22 | 13F | Fiduciary Planning LLC | 2.305 | -23,45 | 216 | -24,30 | ||||
| 2026-02-06 | 13F | Auxano Advisors, LLC | 0 | -100,00 | 0 | |||||
| 2025-08-28 | NP | MMTM - SPDR S&P 1500 Momentum Tilt ETF This fund is a listed as child fund of State Street Corp and if that institution has disclosed ownership in this security, then these positions will not be double counted when calculating total shares and total value | 520 | -4,94 | 47 | -19,30 | ||||
| 2026-02-17 | 13F | Bank Of America Corp /de/ | Call | 0 | -100,00 | 0 | ||||
| 2026-02-20 | 13F | Sunbelt Securities, Inc. | 11.656 | -22,83 | 1.091 | -23,60 | ||||
| 2026-02-11 | 13F | Inceptionr Llc | 13.095 | -30,56 | 1.226 | -31,30 | ||||
| 2026-02-17 | 13F | Css Llc/il | 6.651 | -0,55 | 623 | -1,58 | ||||
| 2026-02-09 | 13F | Wellington Shields Capital Management, LLC | 3.056 | 0,00 | 286 | -1,04 | ||||
| 2026-02-17 | 13F | Bank Of America Corp /de/ | Put | 0 | -100,00 | 0 | ||||
| 2026-02-02 | 13F | Strs Ohio | 378.167 | -8,47 | 35.400 | -9,42 | ||||
| 2026-02-13 | 13F | Northwest Bancshares, Inc. | 4.268 | -8,57 | 400 | -9,52 | ||||
| 2026-01-15 | 13F | Fulcrum Capital LLC | 3.097 | 0,00 | 290 | -1,03 | ||||
| 2026-01-14 | 13F | Centurion Wealth Management LLC | Call | 700 | -12,50 | 66 | -13,33 | |||
| 2026-01-14 | 13F | Centurion Wealth Management LLC | 4.516 | -1,31 | 423 | -2,31 | ||||
| 2026-02-12 | 13F | Dimensional Fund Advisors Lp | 10.970.228 | -1,91 | 1.026.960 | -2,93 | ||||
| 2026-02-05 | 13F | Lynx Investment Advisory | 10.733 | -0,23 | 1.005 | -1,28 | ||||
| 2026-02-06 | 13F | Great Diamond Partners, LLC | 15.186 | -3,67 | 1.422 | -4,69 | ||||
| 2026-02-10 | 13F | Commonwealth Of Pennsylvania Public School Empls Retrmt Sys | 287.435 | -4,16 | 26.907 | -5,16 | ||||
| 2026-02-23 | 13F | Mv Capital Management, Inc. | 1.919 | -8,66 | 180 | -4,79 | ||||
| 2026-02-13 | 13F | Healthcare Of Ontario Pension Plan Trust Fund | 48.850 | -1,20 | 4.573 | -2,22 | ||||
| 2025-08-28 | NP | MUXAX - Victory S&P 500 Index Fund Class A | 6.367 | -3,21 | 571 | -17,25 | ||||
| 2026-01-23 | 13F | FSM Wealth Advisors, LLC | 2.549 | -7,58 | 239 | -8,46 | ||||
| 2025-09-22 | NP | GSBIX - Goldman Sachs Income Builder Fund Institutional | 110.694 | -0,27 | 10.554 | 6,69 | ||||
| 2026-02-17 | 13F | Capital Planning Advisors, LLC | 3.608 | -5,80 | 338 | -6,91 | ||||
| 2026-02-02 | 13F | Avidian Wealth Solutions, LLC | 20.459 | -1,79 | 1.915 | -2,79 | ||||
| 2026-01-15 | 13F | Jamison Private Wealth Management, Inc. | 17.324 | 1,30 | 1.622 | 0,25 | ||||
| 2026-02-11 | 13F | Boston Research & Management Inc | 41.178 | 2,50 | 4 | 0,00 | ||||
| 2026-02-05 | 13F | Avantax Planning Partners, Inc. | 30.991 | -0,72 | 2.901 | -1,73 | ||||
| 2026-02-17 | 13F | Advanced Portfolio Management, LLC | 0 | -100,00 | 0 | |||||
| 2025-11-14 | 13F/A | Clear Harbor Asset Management, LLC | 0 | -100,00 | 0 | -100,00 | ||||
| 2026-02-12 | 13F | Triumph Capital Management | 1.266 | -54,77 | 119 | -55,30 | ||||
| 2026-01-28 | 13F | Cadinha & Co Llc | 5.933 | 0,00 | 555 | -1,07 | ||||
| 2026-02-17 | 13F | Credit Agricole S A | 491.504 | 14,28 | 46.010 | 13,10 | ||||
| 2026-02-09 | 13F | Smith Chas P & Associates Pa Cpas | 3.176 | -0,09 | 297 | -1,00 | ||||
| 2026-02-17 | 13F | Credit Agricole S A | Put | 125.000 | 11.701 | |||||
| 2026-02-17 | 13F | Campion Asset Management LLC | 5.699 | -1,37 | 533 | -2,38 | ||||
| 2026-01-16 | 13F | Tema Etfs Llc | 19.020 | -0,29 | 1.780 | -1,33 | ||||
| 2026-01-26 | 13F | Quadrant Private Wealth Management, LLC | 2.338 | -11,31 | 219 | -12,45 | ||||
| 2026-02-17 | 13F | Sterling Wealth Management, Inc. | 3.049 | 285 | ||||||
| 2026-01-15 | 13F | Bourgeon Capital Management Llc | 89.930 | 0,02 | 8.418 | -1,01 | ||||
| 2026-02-06 | 13F | Vestmark Advisory Solutions, Inc. | 32.287 | 20,00 | 3.022 | 18,74 | ||||
| 2026-01-14 | 13F | Goelzer Investment Management, Inc. | 2.970 | -32,22 | 278 | -32,85 | ||||
| 2026-02-11 | 13F | West Family Investments, Inc. | 4.830 | 0,00 | 452 | -0,88 | ||||
| 2026-02-12 | 13F | Keel Point, LLC | 7.690 | -0,25 | 720 | -1,37 | ||||
| 2026-01-16 | 13F | Hopwood Financial Services, Inc. | 0 | -100,00 | 0 | -100,00 | ||||
| 2026-01-27 | 13F | GHP Investment Advisors, Inc. | 972 | -4,33 | 91 | -6,25 | ||||
| 2026-02-13 | 13F | Banco Santander, S.A. | 23.926 | -21,55 | 2.240 | -22,36 | ||||
| 2026-02-13 | 13F | Voya Financial Advisors, Inc. | 16.913 | -0,65 | 1.567 | -3,99 | ||||
| 2026-02-17 | 13F | Optiver Holding B.V. | Call | 742.400 | 150,64 | 69.496 | 148,05 | |||
| 2026-01-26 | 13F | KBC Group NV | 314.317 | 3,16 | 29 | 3,57 | ||||
| 2026-02-17 | 13F | Optiver Holding B.V. | Put | 559.400 | 368,51 | 52.365 | 363,65 | |||
| 2026-02-06 | 13F | Resona Asset Management Co.,Ltd. | 377.759 | -4,71 | 35.297 | -6,08 | ||||
| 2026-02-17 | 13F | Optiver Holding B.V. | 73.645 | 78,21 | 6.894 | 76,38 | ||||
| 2026-02-17 | 13F | Quantinno Capital Management LP | 461.161 | 11,60 | 43.169 | 10,45 | ||||
| 2026-02-17 | 13F | Private Advisor Group, LLC | 79.718 | -7,96 | 7.462 | -8,91 | ||||
| 2026-02-02 | 13F | Syntax Research, Inc. | 15.539 | 0,06 | 1.455 | -0,95 | ||||
| 2026-01-22 | 13F | Personal Cfo Solutions, Llc | 11.226 | -2,81 | 1.051 | -3,85 | ||||
| 2026-02-11 | 13F | Aufman Associates Inc | 2.400 | 0,00 | 225 | -1,32 | ||||
| 2026-01-23 | 13F | Cantor Fitzgerald Investment Adviser L.p. | 133.462 | -13,76 | 12.493 | -14,65 | ||||
| 2026-02-05 | 13F | Requisite Capital Management, LLC | 8.626 | -1,93 | 807 | -3,00 | ||||
| 2026-02-13 | 13F | Cordoba Advisory Partners LLC | 2.720 | 255 | ||||||
| 2026-02-04 | 13F | Tsfg, Llc | 1.519 | 0,07 | 0 | |||||
| 2026-01-13 | 13F | Value Holdings Management Co. Llc | 0 | -100,00 | 0 | -100,00 | ||||
| 2025-08-28 | NP | IVV - iShares Core S&P 500 ETF | 14.944.348 | -3,71 | 1.341.106 | -17,72 | ||||
| 2026-02-13 | 13F | Ausdal Financial Partners, Inc. | 16.247 | -0,44 | 1.521 | -1,49 | ||||
| 2025-09-26 | NP | JHML - John Hancock Multifactor Large Cap ETF | 25.846 | 0,75 | 2.464 | 7,79 | ||||
| 2026-02-17 | 13F | Royal Capital Wealth Management, LLC | 2.470 | 0,16 | 231 | -0,86 | ||||
| 2026-01-30 | 13F | Jennison Associates Llc | 153.240 | 7,57 | 14.345 | 6,45 | ||||
| 2025-08-29 | NP | ECML - Euclidean Fundamental Value ETF | 24.197 | -7,29 | 2.171 | -20,80 | ||||
| 2026-02-04 | 13F | Paradigm Asset Management Co Llc | 11.500 | -5,74 | 1.077 | -6,68 | ||||
| 2026-02-02 | 13F | Cypress Point Wealth Management, LLC | 29.389 | 2.751 | ||||||
| 2025-11-12 | 13F | Berry Wealth Group, LP | 0 | -100,00 | 0 | -100,00 | ||||
| 2026-01-13 | 13F | Synergy Financial Management, LLC | 0 | -100,00 | 0 | |||||
| 2026-02-12 | 13F | M&G Plc | 46.932 | 22,48 | 4.412 | 21,18 | ||||
| 2026-02-10 | 13F | Peapack Gladstone Financial Corp | 30.162 | -6,13 | 3 | -33,33 | ||||
| 2026-02-11 | 13F | Allianz Asset Management GmbH | Call | 47.300 | 7,26 | 4.428 | 6,14 | |||
| 2026-02-11 | 13F | Allianz Asset Management GmbH | 446.766 | 45,62 | 41.822 | 44,11 | ||||
| 2026-02-11 | 13F | Allianz Asset Management GmbH | Put | 64.800 | 5,71 | 6.066 | 4,61 | |||
| 2025-09-25 | NP | HAIAX - HARTFORD CORE EQUITY FUND Class A | 929.322 | -13,50 | 88.602 | -7,47 | ||||
| 2026-02-10 | 13F | Lido Advisors, LLC | Put | 4.200 | 0,00 | 393 | -1,01 | |||
| 2025-11-14 | 13F | Point72 (DIFC) Ltd | 38.985 | 3.688 | ||||||
| 2025-11-14 | 13F | Point72 (DIFC) Ltd | Put | 200 | -99,00 | 19 | -99,00 | |||
| 2026-02-09 | 13F | Frazier Financial Advisors, LLC | 96 | -12,73 | 9 | -20,00 | ||||
| 2026-01-23 | 13F | Legacy Financial Strategies, LLC | 2.451 | -6,27 | 229 | -7,29 | ||||
| 2026-02-10 | 13F | Westpac Banking Corp | 12.154 | 12,63 | 1.138 | 11,47 | ||||
| 2026-01-21 | 13F | Integris Wealth Management, LLC | 2.334 | -8,33 | 218 | -9,17 | ||||
| 2026-01-27 | 13F | Novem Group | 57.881 | 13,43 | 5.418 | 12,27 | ||||
| 2026-02-12 | 13F | Barings Llc | 114.783 | 1,75 | 10.745 | 0,69 | ||||
| 2026-02-17 | 13F | Hotchkis & Wiley Capital Management Llc | 2.287.674 | 10,14 | 214.149 | 9,00 | ||||
| 2025-08-28 | NP | QWLD - SPDR MSCI World StrategicFactors ETF | 2.121 | 16,09 | 190 | -0,52 | ||||
| 2026-02-18 | 13F | Hanlon Investment Management, Inc. | 3.557 | 7,11 | 333 | 5,73 | ||||
| 2026-01-20 | 13F | Trust Co Of Toledo Na /oh/ | 7.216 | -3,99 | 675 | -4,93 | ||||
| 2026-01-13 | 13F | Sendero Wealth Management, LLC | 84.956 | -25,37 | 7.953 | -26,15 | ||||
| 2026-02-05 | 13F | Bessemer Group Inc | 2.330.244 | -4,18 | 218 | -5,22 | ||||
| 2026-01-15 | 13F | Moody Lynn & Lieberson, Llc | 4.444 | -0,18 | 416 | -1,19 | ||||
| 2026-02-09 | 13F | Cary Street Partners Financial Llc | 9.626 | -6,42 | 901 | -7,30 | ||||
| 2026-02-17 | 13F | Prosperity Consulting Group, LLC | 7.959 | 12,02 | 745 | 10,86 | ||||
| 2026-01-21 | 13F | Crux Wealth Advisors | 13.565 | 1,27 | 1.270 | 0,24 | ||||
| 2025-11-14 | 13F | Point72 Europe (London) LLP | 74.440 | -80,18 | 7.041 | -79,11 | ||||
| 2026-02-19 | 13F | WealthPoint Financial, LLC | 5.975 | 559 | ||||||
| 2025-09-26 | NP | RTDAX - Multifactor U.S. Equity Fund Class A | 11.900 | -7,67 | 1.135 | -1,22 | ||||
| 2026-01-30 | 13F | Simplicity Wealth,LLC | 9.965 | 8,41 | 933 | 7,25 | ||||
| 2026-01-23 | 13F | Parthenon Llc | 2.796 | 0,00 | 262 | -1,14 | ||||
| 2025-09-25 | NP | Dfa Investment Trust Co - The U.s. Large Cap Value Series This fund is a listed as child fund of Dimensional Fund Advisors Lp and if that institution has disclosed ownership in this security, then these positions will not be double counted when calculating total shares and total value | 2.835.383 | 0,00 | 270.325 | 6,98 | ||||
| 2026-02-17 | 13F | Jones Financial Companies Lllp | 314.091 | 7,63 | 29.402 | 3,03 | ||||
| 2025-09-12 | NP | AFVLX - Applied Finance Select Fund Investor Class | 97.668 | 53,40 | 9.312 | 64,10 | ||||
| 2026-02-17 | 13F | Public Employees Retirement System Of Ohio | 503.261 | -0,48 | 47.110 | -1,51 | ||||
| 2026-02-11 | 13F | Investors Towarzystwo Funduszy Inwestycyjnych Spolka Akcyjna | 492 | 46 | ||||||
| 2026-01-09 | 13F | S.E.E.D. Planning Group LLC | 4.637 | 434 | ||||||
| 2026-02-09 | 13F | Hantz Financial Services, Inc. | 65.827 | -5,78 | 6 | 0,00 | ||||
| 2025-10-15 | 13F | Alhambra Investment Partners LLC | 0 | -100,00 | 0 | |||||
| 2026-01-08 | 13F | Versant Capital Management, Inc | 2.447 | -54,70 | 229 | -55,10 | ||||
| 2026-01-29 | 13F | Teachers Retirement System Of The State Of Kentucky | 100.969 | 0,00 | 9 | 0,00 | ||||
| 2026-02-06 | 13F | Bare Financial Services, Inc | 119 | -29,17 | 11 | -26,67 | ||||
| 2026-02-10 | 13F | Axq Capital, Lp | 0 | -100,00 | 0 | |||||
| 2026-02-11 | 13F | Vise Technologies, Inc. | 48.062 | 37,10 | 4.499 | 35,72 | ||||
| 2026-01-12 | 13F | Moody National Bank Trust Division | 11.372 | -23,15 | 1.065 | -23,95 | ||||
| 2026-01-21 | 13F | Rydar Equities, Inc. | 5.463 | 7,05 | 511 | 4,93 | ||||
| 2026-01-29 | 13F | Calamos Advisors LLC | 237.224 | -3,90 | 22.207 | -4,90 | ||||
| 2025-11-14 | 13F | Quarry LP | 0 | -100,00 | 0 | -100,00 | ||||
| 2026-02-11 | 13F | Lyell Wealth Management, Lp | 18.944 | -16,28 | 1.773 | -17,15 | ||||
| 2025-10-31 | 13F | ARGA Investment Management, LP | 0 | -100,00 | 0 | |||||
| 2026-02-17 | 13F | Boreal Capital Management LLC | 1.664 | -24,88 | 156 | -25,84 | ||||
| 2026-01-12 | 13F | Schaper Benz & Wise Investment Counsel Inc/wi | 0 | -100,00 | 0 | |||||
| 2026-02-25 | 13F | Mariner Investment Group Llc | Put | 50.000 | 175 | |||||
| 2025-08-29 | NP | DRLL - Strive U.S. Energy ETF | 130.184 | -2,99 | 11.683 | -17,11 | ||||
| 2026-02-09 | 13F | Fidelis Capital Partners, LLC | 13.410 | -14,63 | 1.255 | -15,49 | ||||
| 2025-09-23 | NP | PGEOX - GEORGE PUTNAM FUND OF BOSTON Class A Shares | 83.206 | 78,23 | 7.933 | 90,67 | ||||
| 2026-02-02 | 13F | Sachetta, LLC | 316 | -1,25 | 30 | -3,33 | ||||
| 2026-02-10 | 13F | Natixis Advisors, L.p. | 2.068.467 | 3,61 | 194 | 2,66 | ||||
| 2025-09-24 | NP | BlackRock ETF Trust - BlackRock U.S. Industry Rotation ETF This fund is a listed as child fund of BlackRock, Inc. and if that institution has disclosed ownership in this security, then these positions will not be double counted when calculating total shares and total value | 750 | 38,63 | 72 | 47,92 | ||||
| 2025-10-16 | 13F | Portman Square Capital LLP | Put | 0 | -100,00 | 0 | -100,00 | |||
| 2025-10-16 | 13F | Portman Square Capital LLP | 0 | -100,00 | 0 | -100,00 | ||||
| 2025-09-25 | NP | DFAC - Dimensional U.S. Core Equity 2 ETF | 932.537 | -0,81 | 88.908 | 6,12 | ||||
| 2026-01-09 | 13F | Montecito Bank & Trust | 13.571 | -11,22 | 1.270 | -12,11 | ||||
| 2026-02-27 | 13F | Strategic Investment Solutions, Inc. /IL | 840 | -11,67 | 79 | -12,36 | ||||
| 2025-08-28 | NP | TOPC - iShares S&P 500 3% Capped ETF | 280 | 25 | ||||||
| 2026-01-07 | 13F | Retirement Wealth Solutions LLC | 245 | 0,00 | 23 | -4,35 | ||||
| 2025-09-26 | NP | SPGP - Invesco S&P 500 GARP ETF This fund is a listed as child fund of Invesco Ltd. and if that institution has disclosed ownership in this security, then these positions will not be double counted when calculating total shares and total value | 0 | -100,00 | 0 | -100,00 | ||||
| 2026-02-13 | 13F | Estabrook Capital Management | 0 | -100,00 | 0 | |||||
| 2026-02-11 | 13F | Vestor Capital, Llc | 84.882 | 2.050,54 | 0 | |||||
| 2026-01-14 | 13F | First County Bank /CT/ | 5.118 | -9,19 | 479 | -10,13 | ||||
| 2026-02-04 | 13F | Advisor OS, LLC | 6.004 | 24,93 | 562 | 23,79 | ||||
| 2026-02-05 | 13F | Clarendon Private LLC | 0 | -100,00 | 0 | |||||
| 2026-02-13 | 13F | Financial Sense Advisors, Inc. | 15.834 | -13,24 | 1.482 | -14,14 | ||||
| 2026-02-10 | 13F | Greenwich Wealth Management LLC | 2.890 | 23,03 | 0 | |||||
| 2026-02-10 | 13F | Founders Financial Securities Llc | 16.214 | 4,94 | 1.518 | 3,83 | ||||
| 2025-11-14 | 13F | Royal Bank Of Canada | Call | 0 | -100,00 | 0 | -100,00 | |||
| 2026-02-17 | 13F | Sherman Porfolios, Llc | 48.700 | 4.559 | ||||||
| 2026-01-15 | 13F | Saxony Capital Management, LLC | 4.819 | 0,12 | 451 | -0,88 | ||||
| 2026-01-26 | 13F | Keystone Wealth Services, LLC | 55.003 | 0,00 | 5.149 | -1,04 | ||||
| 2026-01-14 | 13F | Klein Pavlis & Peasley Financial, Inc. | 30.327 | 0,00 | 2.839 | -1,05 | ||||
| 2026-02-13 | 13F | Adams Natural Resources Fund, Inc. | 377.203 | -15,67 | 35.310 | -16,55 | ||||
| 2026-01-27 | 13F | Forum Financial Management, LP | 23.376 | -4,92 | 2.188 | -5,89 | ||||
| 2026-02-19 | 13F | Van Diest Capital, LLC | 2.400 | 225 | ||||||
| 2026-02-13 | 13F | Kcm Investment Advisors Llc | 8.263 | -1,85 | 774 | -2,89 | ||||
| 2026-02-13 | 13F | Umb Bank N A/mo | 67.821 | -8,86 | 6.349 | -9,82 | ||||
| 2025-09-24 | NP | ACWI - iShares MSCI ACWI ETF | 328.611 | -4,59 | 31.330 | 2,07 | ||||
| 2026-01-07 | 13F | Capital Advantage, Inc. | 2.673 | 3,28 | 250 | 2,46 | ||||
| 2026-01-23 | 13F | Patton Fund Management, Inc. | 2.401 | 0,00 | 225 | -1,32 | ||||
| 2026-02-13 | 13F | Missouri Trust & Investment Co | 763 | -11,59 | 71 | -12,35 | ||||
| 2026-02-13 | 13F | Wbi Investments, Inc. | 0 | -100,00 | 0 | |||||
| 2026-02-06 | 13F | Associated Banc-corp | 18.773 | 0,13 | 1.757 | -0,90 | ||||
| 2025-09-25 | NP | RPGAX - T. Rowe Price Global Allocation Fund, Inc. This fund is a listed as child fund of Price T Rowe Associates Inc /md/ and if that institution has disclosed ownership in this security, then these positions will not be double counted when calculating total shares and total value | 25.377 | 4,66 | 2.419 | 11,99 | ||||
| 2026-01-15 | 13F | Westend Capital Management LLC | 660 | 0,00 | 62 | -1,61 | ||||
| 2026-02-09 | 13F | Hartland & Co., LLC | 24.827 | 13,72 | 2.324 | 12,54 | ||||
| 2026-02-17 | 13F | Ibex Wealth Advisors | 0 | -100,00 | 0 | |||||
| 2026-02-03 | 13F | Farmers & Merchants Investments Inc | 99.698 | -1,48 | 9.333 | -2,51 | ||||
| 2026-01-12 | 13F | VisionPoint Advisory Group, LLC | 27.720 | 3,49 | 2.595 | 2,41 | ||||
| 2026-02-17 | 13F | Ancora Advisors, LLC | 41.508 | 65,79 | 3.886 | 64,06 | ||||
| 2026-01-23 | 13F | Gibbs Wealth Management | 8.748 | -21,42 | 853 | -18,99 | ||||
| 2026-02-12 | 13F | Marex Group plc | 6.804 | -19,53 | 637 | -20,40 | ||||
| 2026-01-21 | 13F | Canton Hathaway, LLC | 366 | 0,00 | 34 | -2,86 | ||||
| 2026-01-28 | 13F | Leelyn Smith, LLC | 2.248 | 0,27 | 210 | -0,94 | ||||
| 2026-02-12 | 13F | Jane Street Group, Llc | Call | 1.284.000 | 8,92 | 120.195 | 7,79 | |||
| 2026-02-05 | 13F | Center for Financial Planning, Inc. | 616 | 0,00 | 58 | -1,72 | ||||
| 2025-09-29 | NP | KCVIX - Knights of Columbus Large Cap Value Fund I Shares | 39.639 | 4,90 | 3.779 | 12,24 | ||||
| 2026-02-12 | 13F | Jane Street Group, Llc | Put | 825.575 | -30,98 | 77.282 | -31,69 | |||
| 2026-02-12 | 13F | Jane Street Group, Llc | 48.760 | -96,42 | 4.564 | -96,45 | ||||
| 2026-02-17 | 13F | Kemnay Advisory Services Inc. | 492 | 46 | ||||||
| 2026-01-14 | 13F | Wolff Wiese Magana Llc | 807 | -2,42 | 76 | -3,85 | ||||
| 2026-02-17 | 13F | Laird Norton Trust Company, Llc | 35.265 | 3.301 | ||||||
| 2026-02-13 | 13F | Ames National Corp | 3.787 | 0,00 | 355 | -1,12 | ||||
| 2026-02-03 | 13F | Cheviot Value Management, LLC | 119.389 | 6,66 | 12.105 | 24,59 | ||||
| 2026-02-13 | 13F | Bollard Group LLC | 141.435 | -4,63 | 13 | -7,14 | ||||
| 2026-02-10 | 13F | CFS Investment Advisory Services, LLC | 6.994 | -1,67 | 655 | 4,47 | ||||
| 2025-09-24 | NP | BlackRock ETF Trust - Blackrock Future U.S. Themes ETF This fund is a listed as child fund of BlackRock, Inc. and if that institution has disclosed ownership in this security, then these positions will not be double counted when calculating total shares and total value | 112.860 | 689,23 | 10.760 | 744,58 | ||||
| 2026-01-21 | 13F | Y.D. More Investments Ltd | 65 | -42,48 | 6 | -40,00 | ||||
| 2025-09-26 | NP | BKLC - BNY Mellon US Large Cap Core Equity ETF | 87.424 | 23,66 | 8.335 | 32,30 | ||||
| 2026-01-22 | 13F | Charter Trust Co | 4.109 | -1,04 | 385 | -2,04 | ||||
| 2026-02-12 | 13F | Logan Capital Management Inc | 89.264 | 0,06 | 8.356 | -0,98 | ||||
| 2026-02-17 | 13F | Lighthouse Investment Partners, LLC | 0 | -100,00 | 0 | |||||
| 2026-01-15 | 13F | Capital Advisors Inc/ok | 31.255 | 0,27 | 2.926 | -0,78 | ||||
| 2025-08-28 | NP | SSPIX - SIMT S&P 500 Index Fund Class F | 24.184 | -1,43 | 2.170 | -15,76 | ||||
| 2026-02-17 | 13F | Limestone Investment Advisors LP | Put | 8.200 | 95,24 | 768 | 93,20 | |||
| 2026-02-04 | 13F | Oxbow Advisors, LLC | 74.754 | -55,15 | 6.998 | -55,62 | ||||
| 2025-11-13 | 13F | Hsbc Holdings Plc | 2.934.540 | -0,12 | 277.456 | 5,22 | ||||
| 2025-11-13 | 13F | Hsbc Holdings Plc | Call | 108.700 | 6,26 | 10.258 | 11,61 | |||
| 2025-11-13 | 13F | Hsbc Holdings Plc | Put | 257.700 | 5,31 | 24.317 | 10,60 | |||
| 2026-01-28 | 13F | Kanawha Capital Management Llc | 38.858 | 2,59 | 3.637 | 1,54 | ||||
| 2025-09-25 | NP | DGRO - iShares Core Dividend Growth ETF | 3.371.938 | 15,22 | 321.481 | 23,27 | ||||
| 2026-02-10 | 13F | SCP Investment, LP | 2.800 | -82,13 | 262 | -82,32 | ||||
| 2026-02-11 | 13F | J.w. Cole Advisors, Inc. | 127.747 | -0,36 | 11.478 | -5,35 | ||||
| 2025-08-28 | NP | SPEU - SPDR(R) Portfolio Europe ETF | 0 | -100,00 | 0 | -100,00 | ||||
| 2026-01-28 | 13F | Bedel Financial Consulting, Inc. | 4.063 | 12,96 | 380 | 11,76 | ||||
| 2026-02-10 | 13F | Marshall & Sterling Wealth Advisors Inc. | 3.356 | -2,64 | 314 | -3,38 | ||||
| 2026-02-11 | 13F | SlateStone Wealth, LLC | 22.801 | 0,77 | 2 | 0,00 | ||||
| 2025-11-14 | 13F | Brass Tax Wealth Management, Inc | 3.066 | 4,53 | 290 | 10,27 | ||||
| 2026-02-17 | 13F | Hyposwiss Advisors SA | 510 | 48 | ||||||
| 2026-01-26 | 13F | Reyes Financial Architecture, Inc. | 93 | 106,67 | 9 | 100,00 | ||||
| 2026-01-23 | 13F | Gilliland Jeter Wealth Management LLC | 22.909 | -4,26 | 2.144 | -5,26 | ||||
| 2026-01-15 | 13F | SILVER OAK SECURITIES, Inc | 2.905 | 15,42 | 273 | 14,71 | ||||
| 2026-02-06 | 13F | Texas Bank & Trust Co | 8.312 | 56,86 | 778 | 55,29 | ||||
| 2026-01-29 | 13F | Kestra Private Wealth Services, Llc | 43.437 | -11,93 | 4.066 | -12,84 | ||||
| 2026-01-29 | 13F | LCM Capital Management Inc | 2.417 | -0,33 | 226 | -1,31 | ||||
| 2026-02-05 | 13F | Amalgamated Bank | 243.390 | 2,21 | 23 | 0,00 | ||||
| 2026-01-30 | 13F | Delta Investment Management, LLC | 2.786 | 1,24 | 261 | 0,00 | ||||
| 2026-02-04 | 13F | Biltmore Family Office, LLC | 4.148 | 6,50 | 388 | 5,43 | ||||
| 2025-09-23 | NP | FMUAX - Federated Muni and Stock Advantage Fund Class A Shares | 57.246 | 0,00 | 5.458 | 6,98 | ||||
| 2026-01-22 | 13F | Apollon Wealth Management, LLC | 25.176 | -13,95 | 2.357 | -14,85 | ||||
| 2026-02-13 | 13F | Tradewinds, LLC. | 3.188 | -2,63 | 298 | -3,56 | ||||
| 2026-02-17 | 13F | Bayesian Capital Management, LP | 2.745 | -83,36 | 257 | -83,59 | ||||
| 2026-01-09 | 13F | Clear Trail Advisors, LLC | 4.313 | 404 | ||||||
| 2025-09-25 | NP | WELLS FARGO MASTER TRUST - Wells Fargo C&B Large Cap Value Portfolio C&B Large Cap Value Portfolio | 31.382 | 1,47 | 2.992 | 8,53 | ||||
| 2026-02-06 | 13F | Copia Wealth Management | 70 | 0,00 | 7 | 0,00 | ||||
| 2026-02-11 | 13F | LPL Financial LLC | 1.377.671 | 0,18 | 128.964 | -0,86 | ||||
| 2025-10-14 | 13F | Livelsberger Financial Advisory | 0 | -100,00 | 0 | |||||
| 2025-12-15 | 13F/A | Hudson Bay Capital Management LP | Put | 0 | -100,00 | 0 | -100,00 | |||
| 2025-12-15 | 13F/A | Hudson Bay Capital Management LP | Call | 0 | -100,00 | 0 | -100,00 | |||
| 2026-02-10 | 13F | FUKOKU MUTUAL LIFE INSURANCE Co | 4.026 | -8,75 | 377 | -9,83 | ||||
| 2026-01-30 | 13F | BancorpSouth Bank | 22.086 | 3,35 | 2.067 | 2,28 | ||||
| 2026-01-28 | 13F | Turtle Creek Wealth Advisors, LLC | 18.449 | 8,15 | 1.727 | 7,07 | ||||
| 2026-01-26 | 13F | PDS Planning, Inc | 12.086 | -0,46 | 1.131 | -1,48 | ||||
| 2026-02-11 | 13F | Mirae Asset Securities (usa) Inc. | 25.054 | 2.345 | ||||||
| 2026-01-26 | 13F | Patriot Financial Group Insurance Agency, LLC | 30.153 | 12,09 | 2.823 | 10,93 | ||||
| 2025-09-26 | NP | TISPX - TIAA-CREF S&P 500 Index Fund Institutional Class | 266.095 | -2,62 | 25.369 | 4,18 | ||||
| 2026-02-13 | 13F | Cohen & Steers, Inc. | 182.474 | 245,82 | 17 | 325,00 | ||||
| 2026-01-27 | 13F | Evergreen Capital Management Llc | 21.592 | -0,54 | 2.021 | -1,56 | ||||
| 2026-01-27 | 13F | Gf Fund Management Co. Ltd. | 294.434 | -2,44 | 27.562 | -3,45 | ||||
| 2026-02-13 | 13F | Financial Network Wealth Advisors LLC | 291 | -8,49 | 27 | -10,00 | ||||
| 2026-01-29 | 13F | Klingman & Associates, LLC | 3.049 | -3,48 | 285 | -4,36 | ||||
| 2026-01-16 | 13F | Compagnie Lombard Odier SCmA | 1.912 | 0,00 | 179 | -1,11 | ||||
| 2025-09-24 | NP | TOK - iShares MSCI Kokusai ETF | 3.877 | -2,34 | 370 | 4,53 | ||||
| 2026-02-17 | 13F | Amundi | 4.889.004 | 0,86 | 457.660 | -0,52 | ||||
| 2026-01-22 | 13F | Lee Financial Co | 0 | -100,00 | 0 | |||||
| 2025-11-17 | 13F | LGT Financial Advisors LLC | 0 | -100,00 | 0 | -100,00 | ||||
| 2026-01-22 | 13F | Foundation Resource Management Inc | 285.636 | 0,42 | 26.738 | -0,62 | ||||
| 2026-01-28 | 13F | Davis Capital Management | 428 | 0,94 | 40 | 0,00 | ||||
| 2026-01-09 | 13F | Aull & Monroe Investment Management Corp | 16.880 | 1,20 | 1.580 | 0,19 | ||||
| 2026-02-05 | 13F | Navalign, LLC | 10.606 | 7,25 | 993 | 6,10 | ||||
| 2026-02-02 | 13F | Cerro Pacific Wealth Advisors LLC | 12.183 | -3,40 | 1.140 | -4,44 | ||||
| 2026-01-21 | 13F | Newbridge Financial Services Group, Inc. | 858 | 1,54 | 80 | 1,27 | ||||
| 2026-02-12 | 13F | Bradley Foster & Sargent Inc/ct | 627.507 | -0,75 | 58.741 | -1,78 | ||||
| 2026-01-15 | 13F | Bernard Wealth Management Corp. | 95 | 0,00 | 9 | 0,00 | ||||
| 2026-01-23 | 13F | Portman Square Capital LLP | Call | 27.500 | 0,00 | 2.574 | -1,04 | |||
| 2026-02-03 | 13F | Cassaday & Co Wealth Management LLC | 5.130 | -2,02 | 480 | -3,03 | ||||
| 2026-02-13 | 13F | Jacobs Levy Equity Management, Inc | 41.581 | 0,29 | 3.892 | -0,74 | ||||
| 2026-02-12 | 13F | Brinker Capital Investments, LLC | 115.329 | -8,57 | 10.796 | -9,51 | ||||
| 2026-01-09 | 13F | Cambridge Financial Group, LLC | 5.144 | -3,87 | 510 | 0,79 | ||||
| 2025-08-29 | NP | CVRD - Madison Covered Call ETF | 8.000 | 0,00 | 718 | -14,64 | ||||
| 2026-02-13 | 13F | Luminist Capital LLC | 21 | 250,00 | 2 | |||||
| 2026-02-05 | 13F | High Note Wealth, LLC | 128 | 5,79 | 12 | 0,00 | ||||
| 2025-08-28 | NP | INDEX - S&P 500(R) Equal Weight No Load Shares | 3.440 | 2,23 | 309 | -12,75 | ||||
| 2026-01-14 | 13F | BCO Wealth Management LLC | 3.933 | 13,18 | 368 | 12,20 | ||||
| 2026-02-12 | 13F | Penserra Capital Management LLC | 105 | 2,94 | 0 | |||||
| 2026-01-05 | 13F | Jacobs & Co/ca | 3.421 | 0,00 | 0 | |||||
| 2026-01-28 | 13F | Nicholson Meyer Capital Management, Inc. | 2.148 | -4,24 | 201 | -5,19 | ||||
| 2026-02-11 | 13F | Winnow Wealth Llc | 565 | -4,56 | 53 | -5,36 | ||||
| 2026-02-17 | 13F/A | Vance Wealth, Inc. | 2.744 | -7,01 | 257 | -8,24 | ||||
| 2026-02-03 | 13F | Ballentine Partners, LLC | 9.518 | -5,58 | 891 | -6,61 | ||||
| 2025-11-06 | 13F | LexAurum Advisors, LLC | 3.725 | -13,23 | 352 | -8,57 | ||||
| 2026-01-07 | 13F | TCP Asset Management, LLC | 2.446 | 0,20 | 229 | -0,87 | ||||
| 2026-02-06 | 13F | Radnor Capital Management, LLC | 10.008 | -1,63 | 937 | -2,70 | ||||
| 2026-01-22 | 13F | Maseco Llp | 77 | 7 | ||||||
| 2026-02-13 | 13F | Palisade Asset Management, LLC | 12.649 | 1,08 | 1.184 | 0,08 | ||||
| 2026-01-22 | 13F | Carlton Hofferkamp & Jenks Wealth Management, LLC | 2.964 | -1,66 | 277 | 3,75 | ||||
| 2025-09-26 | NP | BINT - Bluemonte Global Equity ETF | 22 | 2 | ||||||
| 2026-02-09 | 13F | Kingsview Wealth Management, LLC | 32.528 | -48,01 | 3.045 | -48,56 | ||||
| 2026-01-16 | 13F | Trust Co Of Vermont | 15.937 | -4,56 | 1.492 | -5,57 | ||||
| 2026-02-02 | 13F | JDM Financial Group LLC | 126 | 0,00 | 12 | 0,00 | ||||
| 2026-02-17 | 13F | Engineers Gate Manager LP | 26.663 | 11,56 | 2.496 | 10,40 | ||||
| 2026-01-26 | 13F | Whittier Trust Co Of Nevada Inc | 136.888 | -1,66 | 13.293 | 1,43 | ||||
| 2026-01-12 | 13F | Byrne Asset Management LLC | 10.488 | -5,59 | 982 | -6,57 | ||||
| 2026-01-23 | 13F | Deprince Race & Zollo Inc | 290.351 | -0,29 | 27.180 | -1,33 | ||||
| 2026-01-22 | 13F | Massachusetts Financial Services Co /ma/ | 22.336.728 | -3,82 | 2.090.941 | -4,82 | ||||
| 2025-09-26 | NP | ESUM - Eventide US Market ETF | 7.642 | 729 | ||||||
| 2026-02-06 | 13F/A | Rathbone Brothers plc | 27.020 | 47,41 | 2.529 | 45,93 | ||||
| 2026-01-06 | 13F | Canal Capital Management, LLC | 4.147 | -7,47 | 388 | -8,27 | ||||
| 2026-01-22 | 13F | Franklin, Parlapiano, Turner & Welch, LLC | 31.871 | -2,81 | 3.129 | 0,90 | ||||
| 2026-02-17 | 13F | SageView Advisory Group, LLC | 6.080 | 0,46 | 569 | -0,52 | ||||
| 2026-02-13 | 13F | Pin Oak Investment Advisors Inc | 5.021 | -1,24 | 1 | -100,00 | ||||
| 2026-01-27 | 13F | CenterStar Asset Management, LLC | Put | 12.600 | 1.179 | |||||
| 2026-02-17 | 13F | Hbk Investments L P | Put | 0 | -100,00 | 0 | ||||
| 2026-01-27 | 13F | CenterStar Asset Management, LLC | 2.979 | 279 | ||||||
| 2025-09-25 | NP | CBSE - Clough Select Equity ETF | 7.254 | 692 | ||||||
| 2026-02-17 | 13F | Adage Capital Partners Gp, L.l.c. | 7.037.277 | 18,62 | 658.760 | 17,40 | ||||
| 2026-02-11 | 13F | SAM Advisors, LLC | 8.273 | 0,00 | 774 | -1,02 | ||||
| 2026-01-28 | 13F | B. Metzler seel. Sohn & Co. AG | 78.842 | -7,94 | 7.387 | -8,80 | ||||
| 2026-02-17 | 13F | Cim Investment Mangement Inc | 4.935 | 0,00 | 462 | -1,07 | ||||
| 2026-02-17 | 13F | VestGen Advisors, LLC | 9.387 | 39,65 | 879 | 38,27 | ||||
| 2025-09-26 | NP | INFO - Harbor PanAgora Dynamic Large Cap Core ETF | 0 | -100,00 | 0 | -100,00 | ||||
| 2025-09-24 | NP | IYE - iShares U.S. Energy ETF | 884.571 | -3,74 | 84.335 | 2,98 | ||||
| 2025-09-29 | NP | AIM INVESTMENT FUNDS (INVESCO INVESTMENT FUNDS) - Invesco Oppenheimer Fundamental Alternatives Fund Class R6 | 1.897 | -46,06 | 181 | -42,49 | ||||
| 2026-01-13 | 13F | Regatta Capital Group, Llc | 3.613 | -10,53 | 338 | -11,29 | ||||
| 2026-02-17 | 13F | Raymond James Financial Inc | 2.550.468 | -1,44 | 238.750 | -2,47 | ||||
| 2026-02-09 | 13F | Unified Investment Management | 6.742 | -1,96 | 631 | -2,92 | ||||
| 2026-01-29 | 13F | UBS Group AG | Put | 752.882 | 17,22 | 70.477 | 16,01 | |||
| 2026-02-11 | 13F | Manchester Capital Management LLC | 4.649 | 435 | ||||||
| 2026-01-29 | 13F | UBS Group AG | Call | 407.500 | -1,81 | 38.146 | -2,83 | |||
| 2026-01-29 | 13F | UBS Group AG | 4.280.449 | -7,07 | 400.693 | -8,03 | ||||
| 2026-02-13 | 13F | McAdam, LLC | 4.271 | 2,15 | 400 | 1,01 | ||||
| 2026-02-06 | 13F | Summit Wealth Group, LLC | 2.210 | 207 | ||||||
| 2026-01-30 | 13F | Torren Management, LLC | 1.503 | 141 | ||||||
| 2026-01-12 | 13F | National Wealth Management Group, LLC | 6.356 | 31,95 | 595 | 30,55 | ||||
| 2026-02-17 | 13F | Angeles Wealth Management, Llc | 9.496 | 10,79 | 889 | 9,63 | ||||
| 2026-01-07 | 13F | Corsicana & Co. | 214 | 0,00 | 20 | 0,00 | ||||
| 2026-02-02 | 13F | Horizon Investments, LLC | 121.616 | -1,93 | 11.384 | -2,94 | ||||
| 2026-02-11 | 13F | Capital International Sarl | 122.353 | 4,29 | 11.453 | 3,21 | ||||
| 2026-01-12 | 13F | DAVENPORT & Co LLC | 96.795 | 6,34 | 9.078 | 4,91 | ||||
| 2026-02-02 | 13F | Alliance Wealth Advisors, LLC /UT | 5.137 | -18,06 | 481 | -18,92 | ||||
| 2026-01-15 | 13F | Highline Wealth Partners Llc | 243 | 64,19 | 23 | 69,23 | ||||
| 2026-01-29 | 13F | IMC-Chicago, LLC | 0 | -100,00 | 0 | -100,00 | ||||
| 2026-02-09 | 13F | Huntington National Bank | 92.977 | -7,11 | 8.704 | -8,08 | ||||
| 2025-08-28 | NP | DTLVX - Large Company Value Portfolio Investment Class | 10.622 | -6,00 | 953 | -19,65 | ||||
| 2026-02-04 | 13F | Beverly Hills Private Wealth, LLC | 2.833 | 0,00 | 268 | 0,00 | ||||
| 2026-02-09 | 13F | Quest Partners LLC | 1.354 | -25,32 | 127 | -26,32 | ||||
| 2026-02-12 | 13F | Sprott Inc. | 2.712 | 254 | ||||||
| 2026-02-06 | 13F | Cullen/frost Bankers, Inc. | 225.704 | -1,48 | 21.128 | -2,50 | ||||
| 2025-11-13 | 13F | Rehmann Capital Advisory Group | 7.216 | -4,03 | 683 | 1,19 | ||||
| 2025-08-29 | NP | WTV - WisdomTree U.S. Quality Shareholder Yield Fund N/A | 0 | -100,00 | 0 | -100,00 | ||||
| 2026-01-22 | 13F | Bnc Wealth Management, Llc | 2.646 | 0,04 | 248 | -1,20 | ||||
| 2025-09-25 | NP | CBLS - Clough Hedged Equity ETF | 11.792 | 6,05 | 1.124 | 13,54 | ||||
| 2026-02-03 | 13F | Encompass More Asset Management | 5.120 | -0,41 | 479 | -1,44 | ||||
| 2025-08-29 | NP | JABLX - Janus Henderson Balanced Portfolio Service Shares | 452.923 | -2,57 | 40.645 | -16,75 | ||||
| 2026-02-13 | 13F | SPX Equities Gestao de Recursos Ltda | 0 | -100,00 | 0 | |||||
| 2025-09-26 | NP | YOKE - Yoke Core ETF | 0 | -100,00 | 0 | -100,00 | ||||
| 2025-08-29 | NP | Gamco Global Gold, Natural Resources & Income Trust | 111.530 | 0,00 | 10.009 | -14,55 | ||||
| 2026-02-13 | 13F | Walleye Capital LLC | Call | 180.100 | 114,15 | 16.859 | 111,93 | |||
| 2025-09-25 | NP | ILCV - iShares Morningstar Large-Cap Value ETF | 51.904 | -2,66 | 4.949 | 4,15 | ||||
| 2026-02-13 | 13F | Walleye Capital LLC | Put | 110.200 | 16,99 | 10.316 | 15,77 | |||
| 2026-02-13 | 13F | Walleye Capital LLC | 235.141 | 7.766,88 | 22.012 | 7.705,32 | ||||
| 2026-01-13 | 13F | Capital Investment Advisors, LLC | 17.614 | 1,49 | 1.649 | 0,43 | ||||
| 2026-02-12 | 13F | Sit Investment Associates Inc | 0 | -100,00 | 0 | |||||
| 2026-02-09 | 13F | CBIZ Investment Advisory Services, LLC | 145 | -15,20 | 14 | -18,75 | ||||
| 2026-01-30 | 13F | Valued Wealth Advisors LLC | 301 | 33,19 | 28 | 33,33 | ||||
| 2026-02-05 | 13F | LGT Fund Management Co Ltd. | 58.557 | -16,33 | 5.510 | -17,51 | ||||
| 2026-02-05 | 13F | Gabelli Funds Llc | 493.630 | -1,40 | 46.209 | -2,42 | ||||
| 2026-02-09 | 13F | Kuhn & Co Investment Counsel | 3.943 | 369 | ||||||
| 2026-02-12 | 13F | Fortress Private Ledger, Llc | 3.579 | -1,78 | 335 | -2,62 | ||||
| 2026-01-21 | 13F | Crews Bank & Trust | 7.383 | -0,97 | 691 | -1,99 | ||||
| 2025-08-28 | NP | CBHAX - Victory Market Neutral Income Fund Class A | 40.100 | 6,78 | 3.599 | -8,75 | ||||
| 2026-02-04 | 13F | Northeast Investment Management | 4.460 | 0,00 | 418 | -0,95 | ||||
| 2026-02-03 | 13F | Capital City Trust Co/fl | 3.947 | -3,19 | 369 | -4,16 | ||||
| 2025-09-26 | NP | ETLGX - E*TRADE No Fee Large Cap Index Fund | 806 | 321,99 | 77 | 347,06 | ||||
| 2026-02-12 | 13F | Johnson Financial Group, Inc. | 7.619 | -0,37 | 713 | -1,38 | ||||
| 2026-02-03 | 13F | International Assets Investment Management, Llc | 11.926 | -23,52 | 1.116 | -22,18 | ||||
| 2026-02-13 | 13F | Cozad Asset Management Inc | 5.679 | 0,91 | 532 | -0,19 | ||||
| 2025-10-27 | 13F | Kiker Wealth Management, LLC | 0 | -100,00 | 0 | -100,00 | ||||
| 2025-08-29 | NP | FUNL - CornerCap Fundametrics Large-Cap ETF | 26.139 | -2,29 | 2.346 | -16,52 | ||||
| 2026-02-17 | 13F | Adams Wealth Management | 29.829 | 11,42 | 2.792 | 10,27 | ||||
| 2025-08-29 | NP | JAJGX - Global Trust NAV | 61.154 | 0,00 | 5.488 | -14,56 | ||||
| 2026-02-04 | 13F | Naples Global Advisors, Llc | 17.635 | -2,89 | 1.651 | -3,90 | ||||
| 2026-02-17 | 13F | Evercore Wealth Management, LLC | 11.828 | -0,40 | 1.107 | -1,42 | ||||
| 2025-08-28 | NP | CFO - VictoryShares US 500 Enhanced Volatility Wtd ETF | 9.064 | -2,49 | 813 | -16,70 | ||||
| 2026-02-10 | 13F | Camden National Bank | 2.863 | -2,45 | 268 | -3,25 | ||||
| 2025-11-13 | 13F | Aware Super Pty Ltd as trustee of Aware Super | 0 | -100,00 | 0 | -100,00 | ||||
| 2026-01-29 | 13F | Scissortail Wealth Management, LLC | 69.252 | 0,00 | 6.483 | -1,04 | ||||
| 2025-09-25 | NP | AALGX - Thrivent Global Stock Fund Class A | 103.980 | 32,86 | 9.913 | 42,14 | ||||
| 2026-01-16 | 13F | FNY Investment Advisers, LLC | 200 | 0 | ||||||
| 2026-02-02 | 13F | Stuart Chaussee & Associates, Inc. | 0 | -100,00 | 0 | |||||
| 2026-02-12 | 13F | Alpha Family Trust | 5.150 | 0,00 | 482 | -1,03 | ||||
| 2026-01-30 | 13F | Activest Wealth Management | 741 | 114,16 | 69 | 115,63 | ||||
| 2026-02-10 | 13F | Lcnb Corp | 2.149 | 0,00 | 201 | -0,99 | ||||
| 2026-02-13 | 13F | University Of Texas/texas Am Investment Managment Co | 107 | 10 | ||||||
| 2026-02-06 | 13F | BOK Financial Private Wealth, Inc. | 3.533 | 11,73 | 331 | 10,37 | ||||
| 2026-02-13 | 13F | Sargent Investment Group, LLC | 30.043 | -1,76 | 2.812 | -2,77 | ||||
| 2026-01-05 | 13F | Coastline Trust Co | 4.805 | -12,73 | 450 | -13,65 | ||||
| 2026-02-09 | 13F | Mizuho Securities Usa Llc | 89.977 | -1,09 | 7.980 | -11,35 | ||||
| 2026-01-21 | 13F | Stock Yards Bank & Trust Co | 39.577 | 3,60 | 3.705 | 2,52 | ||||
| 2026-02-11 | 13F | Nemes Rush Group LLC | 398 | 25,95 | 37 | 27,59 | ||||
| 2026-01-29 | 13F | Comerica Bank | 486.224 | -2,73 | 45.515 | -3,74 | ||||
| 2026-01-15 | 13F | Hengehold Capital Management Llc | 2.486 | 4,19 | 233 | 3,11 | ||||
| 2025-09-26 | NP | FVAL - Fidelity Value Factor ETF This fund is a listed as child fund of Fmr Llc and if that institution has disclosed ownership in this security, then these positions will not be double counted when calculating total shares and total value | 39.761 | -0,22 | 3.791 | 6,73 | ||||
| 2026-02-11 | 13F | Cedar Mountain Advisors, LLC | 273 | -13,61 | 26 | -13,79 | ||||
| 2026-01-15 | 13F | McGlone Suttner Wealth Management, Inc. | 7.996 | -36,80 | 749 | -37,46 | ||||
| 2026-01-29 | 13F/A | Stockman Wealth Management, Inc. | 3.600 | -0,11 | 337 | -1,18 | ||||
| 2026-01-29 | 13F | Pictet Asset Management Holding SA | 430.383 | -0,50 | 40.288 | -1,53 | ||||
| 2026-01-26 | 13F | Asset Dedication, LLC | 4.022 | -4,74 | 377 | -5,76 | ||||
| 2026-02-10 | 13F/A | Guinness Atkinson Asset Management Inc | 4.741 | 0,00 | 439 | -3,30 | ||||
| 2026-01-29 | 13F | Golden State Equity Partners | 15.198 | -3,46 | 1.423 | -4,50 | ||||
| 2025-09-22 | NP | TBLRX - Transamerica Balanced II R | 1.995 | -39,53 | 190 | -35,37 | ||||
| 2025-08-28 | NP | Nuveen Multi-Asset Income Fund This fund is a listed as child fund of Nuveen Asset Management, LLC and if that institution has disclosed ownership in this security, then these positions will not be double counted when calculating total shares and total value | 6.420 | 26,93 | 576 | 8,47 | ||||
| 2026-02-02 | 13F | Your Advocates Ltd., LLP | 17.435 | 0,00 | 1.632 | -1,03 | ||||
| 2025-08-29 | NP | MFUS - PIMCO RAFI Dynamic Multi-Factor U.S. Equity ETF | 1.346 | 8,72 | 121 | -7,69 | ||||
| 2026-01-20 | 13F/A | Miller Wealth Advisors, Llc | 557 | 0,91 | 52 | 0,00 | ||||
| 2026-01-30 | 13F | Citizens National Bank Trust Department | 2.176 | 0,00 | 204 | -0,98 | ||||
| 2026-02-02 | 13F | Fogel Capital Management, Inc. | 49.133 | -15,99 | 4.599 | -16,85 | ||||
| 2025-08-29 | NP | JAMVX - Janus Henderson Mid Cap Value Portfolio Service Shares | 20.417 | 0,00 | 1.832 | -14,55 | ||||
| 2025-09-29 | NP | EGLE - Global X S&P 500 U.S. Revenue Leaders ETF | 76 | -32,14 | 7 | -22,22 | ||||
| 2026-02-18 | 13F | Garton & Associates Financial Advisors LLC | 167 | 16 | ||||||
| 2026-02-03 | 13F | Ponta Wealth Partners, LLC | 4.047 | 379 | ||||||
| 2025-10-15 | 13F | Chesapeake Asset Management Llc | 0 | -100,00 | 0 | -100,00 | ||||
| 2026-01-22 | 13F | Harwood Advisory Group, LLC | 0 | -100,00 | 0 | |||||
| 2026-02-04 | 13F | Wsfs Capital Management, Llc | 123.758 | 0,84 | 11.585 | -0,20 | ||||
| 2026-02-17 | 13F | Mosaic Advisors LLC | 52.976 | 0,00 | 4.959 | -1,04 | ||||
| 2026-02-13 | 13F | Trillium Asset Management, Llc | 4.124 | 0,00 | 386 | -1,03 | ||||
| 2026-02-05 | 13F | Lawood & Co | 5.730 | 536 | ||||||
| 2025-09-25 | NP | DFVX - Dimensional US Large Cap Vector ETF | 21.355 | -17,35 | 2.036 | -11,60 | ||||
| 2026-02-09 | 13F | Todd Asset Management Llc | 10.244 | -12,52 | 959 | -13,46 | ||||
| 2026-01-21 | 13F | Register Financial Advisors LLC | 13.521 | -14,51 | 1.266 | -15,38 | ||||
| 2026-02-06 | 13F | EverSource Wealth Advisors, LLC | 20.590 | -4,59 | 1.927 | -5,59 | ||||
| 2025-11-12 | 13F | NewSquare Capital LLC | 0 | -100,00 | 0 | |||||
| 2026-01-20 | 13F | Ethos Financial Group, LLC | 0 | -100,00 | 0 | -100,00 | ||||
| 2026-02-10 | 13F | Re Advisers Corp | 580.744 | -12,21 | 54.363 | -13,12 | ||||
| 2026-02-17 | 13F | SPWM Advisors LLC | 6.442 | 603 | ||||||
| 2026-02-10 | 13F | SBI Okasan Asset Management Co.Ltd. | 1.100 | 102 | ||||||
| 2026-02-13 | 13F | Hurley Capital, LLC | 101 | 1,00 | 9 | 0,00 | ||||
| 2025-08-28 | NP | Amplify ETF Trust - Amplify AI Powered Equity ETF | 3.013 | 107,36 | 270 | 77,63 | ||||
| 2026-02-10 | 13F | Pring Turner Capital Group Inc | 22.425 | 2.611,61 | 2.099 | 3.518,97 | ||||
| 2026-02-12 | 13F | Lbmc Investment Advisors, Llc | 6.471 | -1,34 | 606 | -2,42 | ||||
| 2026-02-13 | 13F | Broderick Brian C | 5.540 | 0,00 | 519 | -1,15 | ||||
| 2026-02-17 | 13F | GeoWealth Management, LLC | 13.644 | 2,68 | 1.277 | 1,67 | ||||
| 2026-02-04 | 13F | Boyd Watterson Asset Management Llc/oh | 3.399 | -3,16 | 318 | -3,93 | ||||
| 2026-02-13 | 13F | Tower Bridge Advisors | 6.277 | 0,00 | 588 | -1,01 | ||||
| 2026-01-20 | 13F | Maryland Capital Advisors Inc. | 85 | 0,00 | 8 | -12,50 | ||||
| 2026-02-10 | 13F | MUFG Securities EMEA plc | 249.659 | 944,34 | 23.371 | 933,61 | ||||
| 2026-01-20 | 13F | Pflug Koory, LLC | 7.470 | -8,51 | 699 | -9,46 | ||||
| 2026-01-07 | 13F | Northside Capital Management, LLC | 34.118 | 0,00 | 3.194 | -1,05 | ||||
| 2026-02-13 | 13F | Truvestments Capital Llc | 344 | -17,31 | 32 | -17,95 | ||||
| 2026-02-10 | 13F | Vantus Wealth LLC | 4.930 | 461 | ||||||
| 2026-01-02 | 13F | Global Wealth Strategies & Associates | 82 | -5,75 | 8 | -12,50 | ||||
| 2025-09-25 | NP | MFWTX - MFS Global Total Return Fund A | 67.149 | -0,96 | 6.402 | 5,94 | ||||
| 2026-01-15 | 13F | Victory Financial Group, Llc | 3.699 | 346 | ||||||
| 2026-01-23 | 13F | U.S. Capital Wealth Advisors, LLC | 199.160 | -2,76 | 18.643 | -3,77 | ||||
| 2025-11-14 | 13F | Point72 (DIFC) Ltd | Call | 0 | -100,00 | 0 | -100,00 | |||
| 2025-09-23 | NP | PEYAX - PUTNAM EQUITY INCOME FUND Class A Shares | 4.127.586 | 0,00 | 393.524 | 6,98 | ||||
| 2026-02-13 | 13F | 1832 Asset Management L.P. | 0 | -100,00 | 0 | |||||
| 2026-02-10 | 13F | Linscomb & Williams, Inc. | 11.001 | -0,31 | 1.030 | -1,34 | ||||
| 2026-02-02 | 13F | Tevis Investment Management | 2.795 | 0,00 | 264 | 0,00 | ||||
| 2026-02-13 | 13F | Lavaca Capital Llc | 600 | 0,00 | 56 | 0,00 | ||||
| 2026-02-13 | 13F | Walleye Trading LLC | Put | 319.600 | -23,89 | 29.918 | -24,68 | |||
| 2026-02-11 | 13F | Paces Ferry Wealth Advisors, Llc | 3.747 | -5,71 | 351 | -6,67 | ||||
| 2026-02-13 | 13F | Walleye Trading LLC | Call | 572.900 | -9,75 | 53.629 | -10,69 | |||
| 2026-02-17 | 13F/A | American Alpha Advisors, LLC | 0 | -100,00 | 0 | |||||
| 2026-01-20 | 13F | Cromwell Holdings LLC | 3.896 | -4,11 | 365 | -5,21 | ||||
| 2025-09-26 | NP | FBUF - Fidelity Dynamic Buffered Equity ETF | 191 | -65,52 | 18 | -63,27 | ||||
| 2026-02-18 | 13F | Beacon Pointe Advisors, LLC | 49.692 | 11,35 | 4.652 | 10,19 | ||||
| 2026-01-27 | 13F | Oak Harvest Investment Services | 3.050 | 285 | ||||||
| 2026-01-26 | 13F | Moss Adams Wealth Advisors LLC | 2.770 | 5,56 | 259 | 4,44 | ||||
| 2026-02-13 | 13F | Cornercap Investment Counsel Inc | 25.356 | -1,35 | 2.374 | -2,39 | ||||
| 2026-01-28 | 13F | Quaker Wealth Management, LLC | 796 | 3,24 | 74 | 2,78 | ||||
| 2026-02-13 | 13F | Smartleaf Asset Management LLC | 40.434 | 2,77 | 3.805 | 0,88 | ||||
| 2025-11-13 | 13F | Glenmede Investment Management, LP | 281.969 | -2,09 | 26.671 | 3,20 | ||||
| 2026-02-05 | 13F | GSB Wealth Management, LLC | 2.188 | -1,13 | 205 | -2,39 | ||||
| 2026-02-17 | 13F | Covington Investment Advisors Inc. | 100.493 | -11,65 | 9 | -10,00 | ||||
| 2026-01-26 | 13F | Whittier Trust Co | 302.645 | 1,34 | 29.390 | 4,52 | ||||
| 2026-02-03 | 13F | Mma Asset Management Llc | 0 | -100,00 | 0 | |||||
| 2026-01-22 | 13F | Quotient Wealth Partners, LLC | 39.106 | -5,23 | 3.661 | -6,20 | ||||
| 2026-01-30 | 13F | North Star Investment Management Corp. | 12.949 | 2,40 | 1.212 | 1,34 | ||||
| 2026-02-17 | 13F | Fairscale Capital, LLC | 0 | -100,00 | 0 | |||||
| 2026-01-29 | 13F | Vanguard Group Inc | 120.251.183 | 0,34 | 11.256.713 | -0,70 | ||||
| 2026-01-20 | 13F | Home Federal Bank Of Tennessee | 13.358 | 0,00 | 1.250 | -1,03 | ||||
| 2026-02-13 | 13F | Findlay Park Partners LLP | 1.445.871 | -16,86 | 135.348 | -17,72 | ||||
| 2026-02-13 | 13F | Seven Mile Advisory | 3.661 | 0,58 | 343 | -0,58 | ||||
| 2026-02-10 | 13F | SCS Capital Management LLC | 16.965 | 1,01 | 1.588 | 0,00 | ||||
| 2026-02-13 | 13F | Gen-Wealth Partners Inc | 1.279 | 1,91 | 120 | 0,85 | ||||
| 2026-02-11 | 13F | Primecap Management Co/ca/ | 11.577.465 | 11,85 | 1.083.766 | 10,69 | ||||
| 2026-02-27 | 13F | Groupama Asset Managment | 5.403 | 0,00 | 506 | -1,17 | ||||
| 2026-02-02 | 13F | Pittenger & Anderson Inc | 626 | -2,34 | 59 | -3,33 | ||||
| 2026-02-13 | 13F | Lighthouse Financial LLC | 2.710 | 0,00 | 254 | -1,17 | ||||
| 2026-02-12 | 13F | VUB Generali dochodkova spravcovska spolocnost, a.s. | 10.188 | 954 | ||||||
| 2026-02-05 | 13F | Blume Capital Management, Inc. | 1.498 | 0,00 | 140 | -0,71 | ||||
| 2025-10-22 | 13F | Kearns & Associates LLC | 0 | -100,00 | 0 | -100,00 | ||||
| 2026-02-11 | 13F | Mattson Financial Services, LLC | 25.659 | 4,39 | 2.402 | 3,27 | ||||
| 2026-01-20 | 13F | Meridian Investment Counsel Inc. | 4.593 | 0,00 | 430 | -1,15 | ||||
| 2026-01-12 | 13F | Bill Few Associates, Inc. | 4.564 | 0,00 | 427 | -0,93 | ||||
| 2026-02-13 | 13F | Clarity Asset Management, Inc. | 120 | 0,84 | 11 | 0,00 | ||||
| 2025-11-13 | 13F | Bridgewater Associates, LP | 0 | -100,00 | 0 | |||||
| 2026-01-27 | 13F | Checchi Capital Advisers, LLC | 11.515 | -12,74 | 1.078 | -13,70 | ||||
| 2026-02-04 | 13F | Dogwood Wealth Management LLC | 145 | 64,77 | 14 | 62,50 | ||||
| 2026-02-09 | 13F | Leavell Investment Management, Inc. | 17.097 | -1,01 | 1.600 | -2,02 | ||||
| 2026-02-17 | 13F | Beacon Investment Advisors Llc | 2.931 | 0,14 | 274 | -0,72 | ||||
| 2026-02-06 | 13F | Aviance Capital Partners, LLC | 26.625 | 2,51 | 2.492 | 1,47 | ||||
| 2026-02-13 | 13F | Glen Eagle Advisors, LLC | 1.755 | -7,68 | 164 | -8,38 | ||||
| 2026-01-28 | 13F | CAPROCK Group, Inc. | 46.470 | 2,66 | 4.350 | -3,65 | ||||
| 2026-01-15 | 13F | J. Safra Sarasin Holding AG | 13.088 | 124,73 | 1.225 | 122,73 | ||||
| 2026-01-07 | 13F | Everpar Advisors Llc | 6.862 | -29,99 | 642 | -30,74 | ||||
| 2026-02-03 | 13F | Heartland Bank & Trust Co | 0 | -100,00 | 0 | |||||
| 2026-02-10 | 13F | Heritage Trust Co | 22.313 | 5,74 | 2.089 | 4,61 | ||||
| 2026-02-13 | 13F | OMERS ADMINISTRATION Corp | 55.217 | -11,25 | 5.169 | -12,18 | ||||
| 2026-01-29 | 13F | IMC-Chicago, LLC | Put | 920.600 | 41,13 | 86.177 | 39,67 | |||
| 2026-01-29 | 13F | IMC-Chicago, LLC | Call | 1.010.600 | 31,18 | 94.602 | 29,82 | |||
| 2026-02-17 | 13F | IHT Wealth Management, LLC | 19.978 | 4,04 | 1.870 | 2,97 | ||||
| 2026-01-16 | 13F | Empirical Financial Services, LLC d.b.a. Empirical Wealth Management | 18.298 | -11,94 | 1.713 | -12,88 | ||||
| 2026-02-11 | 13F | Gaddis Premier Wealth Advisors LLC | 3.784 | 354 | ||||||
| 2026-02-03 | 13F | Costello Asset Management, INC | 800 | -11,11 | 75 | -12,94 | ||||
| 2026-02-17 | 13F | Clark Capital Management Group, Inc. | 9.334 | -2,62 | 874 | -3,64 | ||||
| 2026-02-05 | 13F | DnB Asset Management AS | 392.417 | 5,82 | 36.734 | 4,73 | ||||
| 2026-01-28 | 13F | Loring Wolcott & Coolidge Fiduciary Advisors Llp/ma | 50.414 | -8,00 | 5.035 | 1,99 | ||||
| 2026-02-17 | 13F | Citadel Advisors Llc | Call | 1.871.100 | 55,20 | 175.154 | 53,60 | |||
| 2026-02-06 | 13F | Mach-1 Financial Group, Inc. | 12.486 | 1.169 | ||||||
| 2026-02-17 | 13F | Citadel Advisors Llc | Put | 1.025.750 | 11,01 | 96.020 | 9,86 | |||
| 2026-02-17 | 13F | Citadel Advisors Llc | 654.698 | -67,79 | 61.286 | -68,13 | ||||
| 2026-01-20 | 13F | Nvwm, Llc | 35 | 9,38 | 3 | 0,00 | ||||
| 2026-02-09 | 13F | AIA Group Ltd | 28.860 | 0,00 | 2.702 | -1,03 | ||||
| 2026-02-03 | 13F | SBI Securities Co., Ltd. | 1.456 | -0,61 | 136 | -1,45 | ||||
| 2026-02-13 | 13F | Manufacturers Life Insurance Company, The | 0 | -100,00 | 0 | |||||
| 2026-01-15 | 13F | Gleason Group, Inc. | 970 | 0,94 | 91 | 0,00 | ||||
| 2025-09-26 | NP | PCEQX - Victory Pioneer Equity Income Fund Class C | 194.886 | -4,72 | 18.580 | 1,93 | ||||
| 2026-02-04 | 13F | Oregon Public Employees Retirement Fund | 141.580 | -0,84 | 13.253 | -1,87 | ||||
| 2026-01-06 | 13F | Board of the Pension Protection Fund | 300 | 28 | ||||||
| 2026-02-06 | 13F | Envestnet Portfolio Solutions, Inc. | 162.579 | 0,48 | 15.219 | -0,56 | ||||
| 2025-09-26 | NP | PDAVX - PineBridge Dynamic Asset Allocation Fund Investor Servicing Shares | 596 | -40,46 | 57 | -37,08 | ||||
| 2025-09-25 | NP | CCNR - ALPS | CoreCommodity Natural Resources ETF | 37.446 | 76,06 | 3.570 | 88,39 | ||||
| 2026-02-17 | 13F | Parallax Volatility Advisers, L.P. | Call | 32.600 | -65,79 | 3.052 | -66,15 | |||
| 2026-02-17 | 13F | Parallax Volatility Advisers, L.P. | 38.097 | 3.566 | ||||||
| 2026-02-17 | 13F | Parallax Volatility Advisers, L.P. | Put | 169.800 | 15.895 | |||||
| 2026-01-21 | 13F | NovaPoint Capital, LLC | 0 | -100,00 | 0 | |||||
| 2026-02-11 | 13F | Clearbridge Investments, LLC | 2.209.685 | -9,14 | 206.849 | -10,08 | ||||
| 2026-02-13 | 13F | Colony Group, LLC | 243.788 | 102,56 | 22.823 | 100,62 | ||||
| 2026-02-02 | 13F | Qrg Capital Management, Inc. | 171.384 | 2,07 | 16.043 | 1,01 | ||||
| 2026-02-02 | 13F | Bay Harbor Wealth Management, LLC | 99 | 57,14 | 9 | 80,00 | ||||
| 2025-08-29 | NP | Gabelli Global Utility & Income Trust | 1.000 | 0,00 | 90 | -15,24 | ||||
| 2026-01-12 | 13F | Thrive Wealth Management, LLC | 2.714 | -10,87 | 254 | -11,81 | ||||
| 2026-02-02 | 13F | Blake Schutter Theil Wealth Advisors, LLC | 3.982 | 0,73 | 373 | -0,27 | ||||
| 2026-02-10 | 13F | Thoroughbred Financial Services, Llc | 0 | -100,00 | 0 | |||||
| 2026-02-17 | 13F | Opal Capital Llc | 2.137 | 232 | ||||||
| 2026-02-12 | 13F | Harbour Investment Management Llc | 12.625 | -18,21 | 1.182 | -19,05 | ||||
| 2025-09-25 | NP | TCAAX - Thrivent Moderately Conservative Allocation Fund Class A | 2.835 | 808,65 | 270 | 900,00 | ||||
| 2025-08-28 | NP | BlackRock Variable Series Funds, Inc. - BlackRock Advantage Large Cap Value V.I. Fund Class I This fund is a listed as child fund of BlackRock, Inc. and if that institution has disclosed ownership in this security, then these positions will not be double counted when calculating total shares and total value | 4.214 | -33,35 | 378 | -43,07 | ||||
| 2026-02-11 | 13F | Patron Partners Advisors, Llc | 3.241 | -5,32 | 303 | -6,19 | ||||
| 2026-02-10 | 13F | Blueline Advisors Llc | 127 | 12 | ||||||
| 2026-02-13 | 13F | Ingalls & Snyder Llc | 13.974 | -3,24 | 1 | 0,00 | ||||
| 2026-02-12 | 13F | Raiffeisen Bank International AG | Call | 599 | 0,00 | 47 | -16,07 | |||
| 2025-09-26 | NP | CHTRX - Invesco Charter Fund Class A | 386.928 | 0,00 | 36.890 | 6,98 | ||||
| 2026-02-10 | 13F | Welch & Forbes Llc | 27.252 | -0,31 | 2.551 | -1,32 | ||||
| 2026-02-12 | 13F | Summit Financial, LLC | 28.647 | 1,90 | 2.682 | 0,83 | ||||
| 2025-09-25 | NP | PTMAX - PGIM QMA LARGE-CAP CORE EQUITY FUND Class A | 38.300 | 9,12 | 3.652 | 16,72 | ||||
| 2026-02-11 | 13F | OneAscent Financial Services LLC | 4.723 | 20,42 | 442 | 19,14 | ||||
| 2026-01-30 | 13F | Turning Point Benefit Group, Inc. | 2.215 | 31,30 | 207 | 28,57 | ||||
| 2026-02-10 | 13F | Beaton Management Co. Inc. | 7.205 | -12,28 | 1 | |||||
| 2026-01-20 | 13F | Town & Country Bank & Trust CO dba First Bankers Trust CO | 5.973 | 0,00 | 559 | -0,89 | ||||
| 2026-02-13 | 13F | Destination Wealth Management | 4.148 | -19,09 | 388 | -19,83 | ||||
| 2026-02-13 | 13F | Boston Partners | 6.604.268 | -2,91 | 619.034 | -3,77 | ||||
| 2026-02-12 | 13F | Federation des caisses Desjardins du Quebec | 154.448 | 4,93 | 14.458 | 3,84 | ||||
| 2026-02-06 | 13F | Kennedy Investment Group | 8.863 | -5,29 | 830 | -6,33 | ||||
| 2026-02-03 | 13F | Stack Financial Management, Inc | 181.193 | -2,30 | 16.961 | -3,32 | ||||
| 2026-02-05 | 13F | bLong Financial, LLC | 4.040 | 0,00 | 378 | -1,05 | ||||
| 2026-01-27 | 13F | TD Waterhouse Canada Inc. | 16.559 | 2,36 | 1.550 | 4,38 | ||||
| 2026-01-27 | 13F | Wealth Enhancement Trust Services, Inc. | 2.789 | 261 | ||||||
| 2026-02-13 | 13F | LM Advisors LLC | 249 | -90,59 | 3 | |||||
| 2026-02-17 | 13F | Warren Averett Asset Management, LLC | 55.322 | 27,13 | 5.179 | 25,80 | ||||
| 2026-02-11 | 13F | Janney Montgomery Scott LLC | 278.070 | -0,32 | 26 | 0,00 | ||||
| 2026-02-03 | 13F | Patton Albertson Miller Group, Llc | 5.849 | -2,01 | 548 | -3,01 | ||||
| 2025-08-28 | NP | RSGGX - Victory RS Global Fund Class A | 71.627 | 3,75 | 6.428 | -11,35 | ||||
| 2025-08-29 | NP | JAGIX - Janus Henderson Growth and Income Fund Class T | 516.624 | -0,94 | 46.362 | -15,36 | ||||
| 2026-02-17 | 13F | Lombard Odier Asset Management (USA) Corp | 0 | -100,00 | 0 | |||||
| 2026-01-30 | 13F | First National Bank Sioux Falls | 2.572 | 0,00 | 241 | -1,23 | ||||
| 2026-02-05 | 13F | Sapient Capital Llc | 5.103 | -4,28 | 480 | -5,88 | ||||
| 2026-02-10 | 13F | Cherry Tree Wealth Management, LLC | 0 | -100,00 | 0 | |||||
| 2026-01-07 | 13F | Sagespring Wealth Partners, Llc | 11.735 | -17,05 | 1.099 | -17,94 | ||||
| 2026-02-13 | 13F | Graney & King, LLC | 515 | 0,78 | 48 | 0,00 | ||||
| 2026-02-12 | 13F | Federated Hermes, Inc. | 354.850 | 56,84 | 33.218 | 55,22 | ||||
| 2026-01-21 | 13F | Stone House Investment Management, LLC | 298 | -12,09 | 28 | -15,62 | ||||
| 2026-02-17 | 13F | Imprint Wealth LLC | 96 | -56,76 | 9 | -60,00 | ||||
| 2026-01-14 | 13F | Wedge Capital Management L L P/nc | 2.570 | 4,09 | 241 | 3,00 | ||||
| 2026-01-12 | 13F | Horizon Financial Services, Llc | 129 | 126,32 | 12 | 140,00 | ||||
| 2025-09-26 | NP | FIOOX - Fidelity Series Large Cap Value Index Fund This fund is a listed as child fund of Fmr Llc and if that institution has disclosed ownership in this security, then these positions will not be double counted when calculating total shares and total value | 424.650 | -3,61 | 40.486 | 3,12 | ||||
| 2026-02-13 | 13F | Fayez Sarofim & Co | 765.628 | -47,06 | 71.670 | -47,61 | ||||
| 2025-10-03 | 13F | West Oak Capital, LLC | 150 | -75,96 | 0 | |||||
| 2026-01-23 | 13F | Clear Creek Financial Management, LLC | 0 | -100,00 | 0 | |||||
| 2025-09-29 | NP | HGRO - Hedgeye Quality Growth ETF | 3.250 | 310 | ||||||
| 2025-08-28 | NP | Principal Diversified Select Real Asset Fund | 908 | 11,41 | 81 | -4,71 | ||||
| 2025-11-13 | 13F | VGI Partners Ltd | 0 | -100,00 | 0 | |||||
| 2026-02-19 | 13F | Atomi Financial Group, Inc. | 17.098 | -9,37 | 1.601 | -10,31 | ||||
| 2026-02-11 | 13F | SmartHarvest Portfolios, LLC | 6.863 | 642 | ||||||
| 2025-11-07 | 13F | Sierra Ocean, Llc | 0 | -100,00 | 0 | |||||
| 2026-02-13 | 13F | Treasurer of the State of North Carolina | 645.349 | -6,57 | 60 | -7,69 | ||||
| 2026-01-21 | 13F | 4wealth Advisors, Inc. | 4.276 | 11,38 | 400 | 10,19 | ||||
| 2026-02-11 | 13F | Prudent Man Advisors, LLC | 7.219 | 676 | ||||||
| 2026-01-16 | 13F | Crowley Wealth Management, Inc. | 0 | -100,00 | 0 | |||||
| 2025-09-19 | NP | MENAX - Madison Covered Call & Equity Income Fund Covered Call & Equity Income Fund Class A | 69.200 | 0,00 | 6.598 | 6,97 | ||||
| 2026-02-09 | 13F | King Luther Capital Management Corp | 2.147.411 | -3,66 | 201.019 | -4,66 | ||||
| 2026-01-27 | 13F | Latitude Advisors, LLC | 2.468 | -0,08 | 231 | -0,86 | ||||
| 2026-01-27 | 13F | Brighton Jones Llc | 0 | -100,00 | 0 | |||||
| 2026-01-27 | 13F | Arcataur Capital Management LLC | 3.279 | 1,55 | 307 | 0,33 | ||||
| 2026-02-12 | 13F | Richwood Investment Advisors, LLC | 3.849 | -8,68 | 414 | 4,02 | ||||
| 2025-09-26 | NP | IAUTX - INVESCO Dividend Income Fund Class A | 658.795 | 0,00 | 62.810 | 6,98 | ||||
| 2026-01-06 | 13F | RDA Financial Network | 2.794 | 2,99 | 262 | 1,95 | ||||
| 2025-10-28 | 13F | MeadowBrook Investment Advisors LLC | 0 | -100,00 | 0 | -100,00 | ||||
| 2026-02-10 | 13F | EagleClaw Capital Managment, LLC | 24.540 | -0,61 | 2.297 | -1,63 | ||||
| 2026-02-10 | 13F | Principia Wealth Advisory, LLC | 145 | -3,33 | 14 | -7,14 | ||||
| 2025-08-28 | NP | Aim Variable Insurance Funds (invesco Variable Insurance Funds) - Invesco V.i. Comstock Fund Series I | 187.351 | -1,26 | 16.813 | -15,63 | ||||
| 2026-02-13 | 13F | River Wealth Advisors LLC | 15.900 | -14,60 | 1.488 | -15,50 | ||||
| 2026-01-26 | 13F | Thomasville National Bank | 9.801 | -3,05 | 917 | -4,08 | ||||
| 2026-01-26 | 13F | Old Point Trust & Financial Services N A | 92.605 | -2,43 | 8.669 | -3,45 | ||||
| 2025-09-25 | NP | DFUSX - U.s. Large Company Portfolio This fund is a listed as child fund of Dimensional Fund Advisors Lp and if that institution has disclosed ownership in this security, then these positions will not be double counted when calculating total shares and total value | 302.708 | -3,16 | 28.860 | 3,60 | ||||
| 2026-02-12 | 13F | StoneX Group Inc. | 30.788 | 4,65 | 2.883 | 3,59 | ||||
| 2025-09-29 | NP | PTLC - Pacer Trendpilot US Large Cap ETF | 79.006 | -11,22 | 7.532 | -14,36 | ||||
| 2026-02-13 | 13F | Searle & Co. | 0 | -100,00 | 0 | |||||
| 2025-09-24 | NP | FXN - First Trust Energy AlphaDEX Fund This fund is a listed as child fund of First Trust Advisors Lp and if that institution has disclosed ownership in this security, then these positions will not be double counted when calculating total shares and total value | 97.233 | -3,36 | 9.270 | 3,39 | ||||
| 2026-02-13 | 13F | SYM FINANCIAL Corp | 3.031 | 9,11 | 284 | 8,02 | ||||
| 2026-02-05 | 13F | Allworth Financial LP | 39.341 | 2,58 | 3.683 | 1,52 | ||||
| 2025-09-26 | NP | Voya Prime Rate Trust | 0 | -100,00 | 0 | -100,00 | ||||
| 2025-09-26 | NP | INVESCO ACTIVELY MANAGED EXCHANGE-TRADED FUND TRUST - Invesco S&P 500 Equal Weight Income Advantage ETF | 6.529 | 39,90 | 622 | 49,88 | ||||
| 2026-01-14 | 13F | EdgeRock Capital LLC | 2.225 | 208 | ||||||
| 2026-02-13 | 13F | 71 West Capital Partners | 6.031 | 565 | ||||||
| 2026-02-11 | 13F | Group One Trading, L.p. | Call | 304.200 | -2,90 | 28.476 | -3,91 | |||
| 2026-02-17 | 13F | Man Group plc | 230.413 | -52,33 | 21.569 | -52,82 | ||||
| 2026-01-30 | 13F | Oakworth Capital, Inc. | 4.234 | 11,36 | 396 | 10,31 | ||||
| 2026-02-11 | 13F | Group One Trading, L.p. | Put | 129.500 | 51,46 | 12.122 | 49,89 | |||
| 2026-02-17 | 13F | Coppell Advisory Solutions LLC | 17.815 | 11,75 | 1.676 | 9,69 | ||||
| 2026-02-11 | 13F | Group One Trading, L.p. | 1.154 | 108 | ||||||
| 2026-01-23 | 13F | LOM Asset Management Ltd | 5.313 | 4,22 | 497 | 3,11 | ||||
| 2026-02-11 | 13F | MidWestOne Financial Group, Inc. | 16.565 | 27,52 | 1.551 | 26,22 | ||||
| 2025-10-31 | 13F | NWF Advisory Services Inc. | 2.701 | 255 | ||||||
| 2026-01-21 | 13F | Rocky Mountain Advisers, Llc | 698 | 0,00 | 65 | -1,52 | ||||
| 2025-08-29 | NP | WOMN - Impact Shares YWCA Women's Empowerment ETF | 3.570 | 1,48 | 320 | -13,28 | ||||
| 2026-01-14 | 13F | Chatham Capital Group, Inc. | 12.654 | -5,62 | 1.185 | -6,62 | ||||
| 2026-02-05 | 13F | Bright Futures Wealth Management, LLC. | 3.645 | 0,75 | 341 | -0,29 | ||||
| 2025-11-14 | 13F | Teza Capital Management LLC | 0 | -100,00 | 0 | -100,00 | ||||
| 2026-01-23 | 13F | Smith, Moore & Co. | 10.007 | -11,04 | 937 | -12,03 | ||||
| 2026-01-14 | 13F | InvesTrust | 3.055 | 0,00 | 286 | -1,04 | ||||
| 2026-01-21 | 13F | Master's Wealth Management Inc. | 3.630 | 5,31 | 340 | 3,99 | ||||
| 2026-02-17 | 13F | Stokes Family Office, LLC | 2.356 | 221 | ||||||
| 2025-09-19 | NP | BHBFX - Madison Dividend Income Fund Dividend Income Fund Class Y | 19.200 | -9,86 | 1.831 | -3,58 | ||||
| 2025-09-26 | NP | AADBX - American Beacon Balanced Fund Institutional Class | 2.536 | 0,00 | 242 | 6,64 | ||||
| 2026-02-03 | 13F | Drucker Wealth 3.0, LLC | 4.636 | -31,06 | 434 | -31,92 | ||||
| 2026-01-28 | 13F | Old National Bancorp /in/ | 98.560 | -7,49 | 9.226 | -8,44 | ||||
| 2026-02-10 | 13F | Operose Advisors LLC | 946 | 0,00 | 89 | -1,12 | ||||
| 2026-02-12 | 13F | Steward Partners Investment Advisory, Llc | 146.151 | 2,16 | 13.681 | 1,10 | ||||
| 2026-02-03 | 13F | Gateway Investment Advisers Llc | 408.190 | -0,57 | 38.211 | -1,60 | ||||
| 2026-02-05 | 13F | Conning Inc. | 353.072 | -2,77 | 33.051 | -3,78 | ||||
| 2026-02-17 | 13F | EFG International AG | 36.425 | 3.409 | ||||||
| 2026-02-13 | 13F | Twin City Private Wealth, Llc | 10.183 | 8,60 | 953 | 7,56 | ||||
| 2026-01-07 | 13F | Hamlin Capital Management, LLC | 1.439.343 | -5,28 | 134.737 | -6,27 | ||||
| 2026-02-13 | 13F | Cornerstone Financial Management LLC | 105 | 10 | ||||||
| 2025-10-31 | 13F | Sawgrass Asset Management Llc | 0 | -100,00 | 0 | |||||
| 2025-10-24 | 13F | Hemington Wealth Management | 1.268 | 57,71 | 0 | |||||
| 2026-02-09 | 13F | Wellington Shields & Co., LLC | 6.293 | 0,33 | 589 | -0,67 | ||||
| 2025-08-28 | NP | TMLCX - Simt Tax-managed Large Cap Fund Class F | 179.580 | 0,00 | 16.116 | -14,55 | ||||
| 2026-02-10 | 13F | Intech Investment Management Llc | 40.734 | -13,31 | 3.813 | -14,20 | ||||
| 2026-02-11 | 13F | XML Financial, LLC | 10.636 | -13,18 | 996 | -14,08 | ||||
| 2026-02-03 | 13F | Patten & Patten Inc/tn | 176.348 | -5,17 | 16.508 | -6,16 | ||||
| 2025-10-31 | 13F | Y-Intercept (Hong Kong) Ltd | 0 | -100,00 | 0 | |||||
| 2026-01-20 | 13F | Cornell Pochily Investment Advisors, Inc. | 2.292 | -11,57 | 215 | -12,65 | ||||
| 2026-02-11 | 13F | Capital World Investors | 5.198.516 | -23,01 | 486.634 | -23,81 | ||||
| 2026-02-13 | 13F | Charles Schwab Investment Management Inc | 41.450.162 | 6,01 | 3.880.151 | 4,91 | ||||
| 2026-02-12 | 13F | Adviser Investments LLC | 6.718 | -38,27 | 629 | -38,97 | ||||
| 2026-01-26 | 13F | Riverview Trust Co | 2.405 | 0,00 | 225 | -0,88 | ||||
| 2026-02-17 | 13F | Lazard Asset Management Llc | 1.579.501 | -53,44 | 147.857 | -53,93 |