Grundlæggende statistik
| Porteføljeværdi | $ 566.903.297 |
| Nuværende stillinger | 120 |
Seneste beholdninger, ydeevne, AUM (fra 13F, 13D)
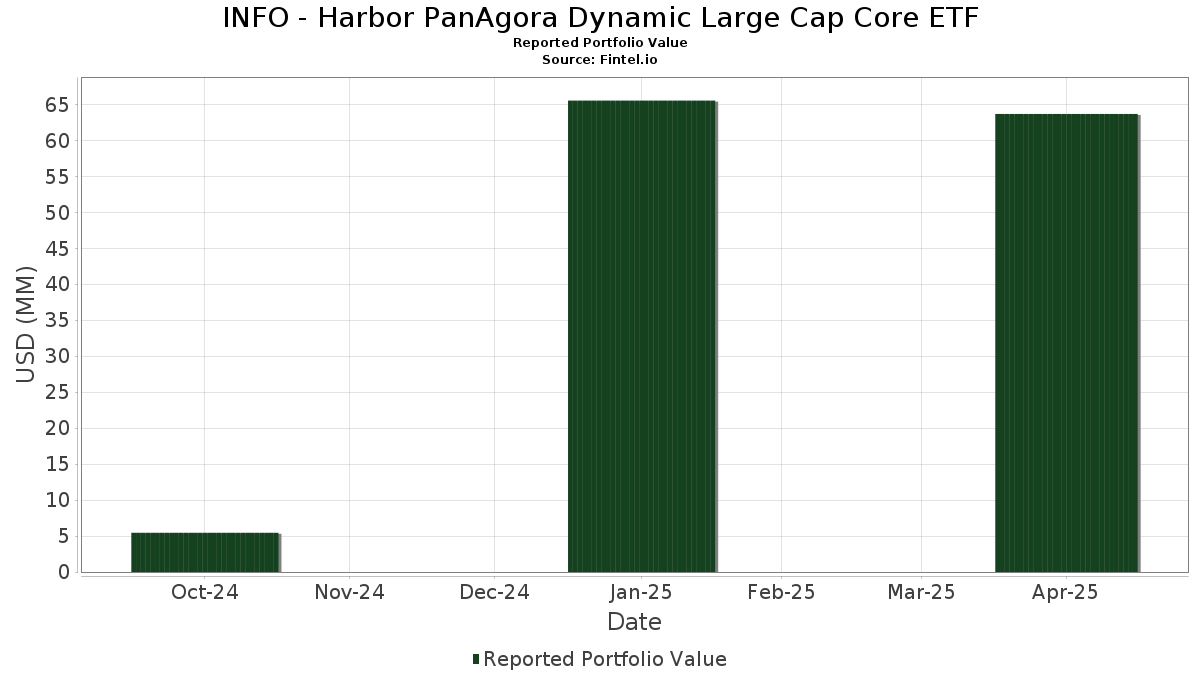
INFO - Harbor PanAgora Dynamic Large Cap Core ETF har afsløret 120 samlede besiddelser i deres seneste SEC-arkivering. Den seneste porteføljeværdi er beregnet til at være $ 566.903.297 USD. Faktiske aktiver under forvaltning (AUM) er denne værdi plus kontanter (som ikke er oplyst). INFO - Harbor PanAgora Dynamic Large Cap Core ETFs største beholdninger er Direxion Shares ETF Trust - Direxion Daily NVDA Bear 1X Shares (US:NVDD) , Microsoft Corporation (US:MSFT) , Apple Inc. (US:AAPL) , Amazon.com, Inc. (US:AMZN) , and Meta Platforms, Inc. (US:META) . INFO - Harbor PanAgora Dynamic Large Cap Core ETFs nye stillinger omfatter General Dynamics Corporation (US:GD) , Capital One Financial Corporation (US:COF) , Carrier Global Corporation (US:CARR) , Pentair plc (US:PNR) , and Newmont Corporation (US:NEM) .
Top øger dette kvartal
Vi bruger ændringen i porteføljeallokeringen, fordi dette er den mest meningsfulde metrik. Ændringer kan skyldes handler eller ændringer i aktiekurser.
| Sikkerhed | Aktier (MM) |
Værdi (MM$) |
Portefølje % | ΔPortefølje % |
|---|---|---|---|---|
| NVDD / Direxion Shares ETF Trust - Direxion Daily NVDA Bear 1X Shares | 0,26 | 46,53 | 8,1784 | 2,1336 |
| MSFT / Microsoft Corporation | 0,08 | 40,57 | 7,1307 | 1,2636 |
| EBAY / eBay Inc. | 0,06 | 5,59 | 0,9819 | 0,9819 |
| BK / The Bank of New York Mellon Corporation | 0,05 | 5,45 | 0,9584 | 0,9584 |
| GD / General Dynamics Corporation | 0,02 | 5,04 | 0,8866 | 0,8866 |
| COF / Capital One Financial Corporation | 0,02 | 5,01 | 0,8814 | 0,8814 |
| INTU / Intuit Inc. | 0,01 | 7,14 | 1,2541 | 0,8602 |
| CARR / Carrier Global Corporation | 0,06 | 4,46 | 0,7834 | 0,7834 |
| PNR / Pentair plc | 0,04 | 4,25 | 0,7476 | 0,7476 |
| NEM / Newmont Corporation | 0,06 | 4,03 | 0,7086 | 0,7086 |
Top falder i dette kvartal
Vi bruger ændringen i porteføljeallokeringen, fordi dette er den mest meningsfulde metrik. Ændringer kan skyldes handler eller ændringer i aktiekurser.
| Sikkerhed | Aktier (MM) |
Værdi (MM$) |
Portefølje % | ΔPortefølje % |
|---|---|---|---|---|
| KR / The Kroger Co. | 0,01 | 0,50 | 0,0879 | -1,0124 |
| AAPL / Apple Inc. | 0,16 | 32,83 | 5,7703 | -0,9058 |
| FITB / Fifth Third Bancorp | 0,00 | 0,00 | -0,7371 | |
| WMT / Walmart Inc. | 0,06 | 6,06 | 1,0648 | -0,6865 |
| MMC / Marsh & McLennan Companies, Inc. | 0,00 | 0,00 | -0,6448 | |
| MRK / Merck & Co., Inc. | 0,03 | 2,61 | 0,4593 | -0,6168 |
| FTV / Fortive Corporation | 0,00 | 0,00 | -0,5993 | |
| TSN / Tyson Foods, Inc. | 0,04 | 2,12 | 0,3730 | -0,5188 |
| NOC / Northrop Grumman Corporation | 0,00 | 0,00 | -0,4597 | |
| GE / General Electric Company | 0,02 | 4,12 | 0,7249 | -0,3671 |
13F og Fondsarkivering
Denne formular blev indsendt den 2025-09-26 for rapporteringsperioden 2025-07-31. Klik på linkikonet for at se den fulde transaktionshistorik.
Opgrader for at låse op for premium-data og eksportere til Excel ![]() .
.
| Sikkerhed | Type | Gennemsnitlig aktiekurs | Aktier (MM) |
Δ Aktier (%) |
Værdi ($MM) |
Δ Aktier (%) |
Portefølje (%) |
ΔPortefølje (%) |
|
|---|---|---|---|---|---|---|---|---|---|
| NVDD / Direxion Shares ETF Trust - Direxion Daily NVDA Bear 1X Shares | 0,26 | 639,86 | 46,53 | 1.108,26 | 8,1784 | 2,1336 | |||
| MSFT / Microsoft Corporation | 0,08 | 704,10 | 40,57 | 985,60 | 7,1307 | 1,2636 | |||
| AAPL / Apple Inc. | 0,16 | 690,18 | 32,83 | 671,90 | 5,7703 | -0,9058 | |||
| AMZN / Amazon.com, Inc. | 0,10 | 625,91 | 22,31 | 821,52 | 3,9213 | 0,1213 | |||
| META / Meta Platforms, Inc. | 0,03 | 667,85 | 21,96 | 981,82 | 3,8601 | 0,6735 | |||
| GOOGL / Alphabet Inc. | 0,11 | 668,18 | 21,79 | 828,38 | 3,8298 | 0,1456 | |||
| AVGO / Broadcom Inc. | 0,04 | 720,01 | 12,81 | 1.151,71 | 2,2507 | 0,6445 | |||
| V / Visa Inc. | 0,03 | 663,69 | 10,50 | 663,64 | 1,8456 | -0,3127 | |||
| JPM / JPMorgan Chase & Co. | 0,03 | 575,12 | 9,92 | 717,56 | 1,7432 | -0,1608 | |||
| MA / Mastercard Incorporated | 0,02 | 667,44 | 9,20 | 693,62 | 1,6168 | -0,2034 | |||
| TSLA / Tesla, Inc. | 0,03 | 768,49 | 9,06 | 849,37 | 1,5919 | 0,0937 | |||
| COST / Costco Wholesale Corporation | 0,01 | 1.261,04 | 8,57 | 1.186,49 | 1,5060 | 0,4602 | |||
| NFLX / Netflix, Inc. | 0,01 | 649,52 | 8,23 | 668,35 | 1,4464 | -0,2357 | |||
| INTU / Intuit Inc. | 0,01 | 2.172,00 | 7,14 | 2.754,00 | 1,2541 | 0,8602 | |||
| PM / Philip Morris International Inc. | 0,04 | 681,93 | 6,98 | 649,25 | 1,2274 | -0,2368 | |||
| WFC / Wells Fargo & Company | 0,08 | 910,46 | 6,13 | 1.048,13 | 1,0777 | 0,2389 | |||
| WMT / Walmart Inc. | 0,06 | 438,91 | 6,06 | 443,32 | 1,0648 | -0,6865 | |||
| 0Q1G / Eli Lilly and Company | 0,01 | 967,24 | 5,98 | 779,26 | 1,0509 | -0,0172 | |||
| ANET / Arista Networks, Inc. | 0,05 | 1.077,75 | 5,88 | 1.664,86 | 1,0330 | 0,5101 | |||
| NOW / ServiceNow, Inc. | 0,01 | 671,88 | 5,72 | 662,80 | 1,0057 | -0,1725 | |||
| EBAY / eBay Inc. | 0,06 | 5,59 | 0,9819 | 0,9819 | |||||
| BK / The Bank of New York Mellon Corporation | 0,05 | 5,45 | 0,9584 | 0,9584 | |||||
| XOM / Exxon Mobil Corporation | 0,05 | 690,90 | 5,43 | 736,83 | 0,9547 | -0,0652 | |||
| BSX / Boston Scientific Corporation | 0,05 | 1.673,79 | 5,32 | 1.710,88 | 0,9359 | 0,4739 | |||
| BRK.B / Berkshire Hathaway Inc. | 0,01 | 716,06 | 5,28 | 622,60 | 0,9273 | -0,2194 | |||
| CRM / Salesforce, Inc. | 0,02 | 582,59 | 5,22 | 556,28 | 0,9183 | -0,3314 | |||
| QCOM / QUALCOMM Incorporated | 0,04 | 666,40 | 5,21 | 658,08 | 0,9155 | -0,1636 | |||
| SYF / Synchrony Financial | 0,07 | 738,37 | 5,16 | 1.025,55 | 0,9062 | 0,1865 | |||
| GD / General Dynamics Corporation | 0,02 | 5,04 | 0,8866 | 0,8866 | |||||
| COF / Capital One Financial Corporation | 0,02 | 5,01 | 0,8814 | 0,8814 | |||||
| LRCX / Lam Research Corporation | 0,05 | 584,74 | 5,00 | 806,16 | 0,8793 | 0,0127 | |||
| GM / General Motors Company | 0,09 | 1.456,08 | 4,97 | 1.735,42 | 0,8743 | 0,4487 | |||
| RTX / RTX Corporation | 0,03 | 549,54 | 4,96 | 711,46 | 0,8716 | -0,0876 | |||
| MCK / McKesson Corporation | 0,01 | 610,57 | 4,94 | 592,16 | 0,8688 | -0,2534 | |||
| DTE / DTE Energy Company | 0,03 | 705,14 | 4,77 | 713,99 | 0,8385 | -0,0820 | |||
| FFIV / F5, Inc. | 0,02 | 796,04 | 4,75 | 961,16 | 0,8357 | 0,1322 | |||
| EOG / EOG Resources, Inc. | 0,04 | 780,89 | 4,75 | 858,27 | 0,8355 | 0,0569 | |||
| EXC / Exelon Corporation | 0,10 | 608,62 | 4,65 | 579,53 | 0,8171 | -0,2575 | |||
| HIG / The Hartford Insurance Group, Inc. | 0,04 | 699,89 | 4,54 | 711,99 | 0,7978 | -0,0806 | |||
| CARR / Carrier Global Corporation | 0,06 | 4,46 | 0,7834 | 0,7834 | |||||
| 0RR8 / Baker Hughes Company | 0,10 | 708,96 | 4,30 | 929,98 | 0,7551 | 0,1001 | |||
| WAB / Westinghouse Air Brake Technologies Corporation | 0,02 | 684,05 | 4,28 | 716,03 | 0,7516 | -0,0719 | |||
| PNR / Pentair plc | 0,04 | 4,25 | 0,7476 | 0,7476 | |||||
| JNJ / Johnson & Johnson | 0,03 | 685,66 | 4,18 | 728,77 | 0,7343 | -0,0576 | |||
| GE / General Electric Company | 0,02 | 340,73 | 4,12 | 493,38 | 0,7249 | -0,3671 | |||
| NEM / Newmont Corporation | 0,06 | 4,03 | 0,7086 | 0,7086 | |||||
| DAL / Delta Air Lines, Inc. | 0,07 | 706,41 | 3,94 | 931,68 | 0,6927 | 0,0926 | |||
| NRG / NRG Energy, Inc. | 0,02 | 406,21 | 3,73 | 672,67 | 0,6561 | -0,1024 | |||
| A / Agilent Technologies, Inc. | 0,03 | 676,09 | 3,60 | 728,51 | 0,6335 | -0,0497 | |||
| BMY / Bristol-Myers Squibb Company | 0,08 | 669,29 | 3,60 | 564,76 | 0,6333 | -0,2188 | |||
| MSI / Motorola Solutions, Inc. | 0,01 | 671,20 | 3,56 | 669,11 | 0,6260 | -0,1012 | |||
| CI / The Cigna Group | 0,01 | 1.173,77 | 3,53 | 903,13 | 0,6208 | 0,0673 | |||
| 1HOLX / Hologic, Inc. | 0,05 | 716,57 | 3,45 | 838,32 | 0,6070 | 0,0288 | |||
| CMCSA / Comcast Corporation | 0,10 | 672,54 | 3,40 | 651,21 | 0,5982 | -0,1135 | |||
| AME / AMETEK, Inc. | 0,02 | 3,37 | 0,5916 | 0,5916 | |||||
| DD / DuPont de Nemours, Inc. | 0,05 | 511,62 | 3,28 | 567,62 | 0,5762 | -0,1959 | |||
| INCY / Incyte Corporation | 0,04 | 612,95 | 3,27 | 753,26 | 0,5745 | -0,0276 | |||
| STT / State Street Corporation | 0,03 | 695,48 | 3,17 | 909,24 | 0,5570 | 0,0640 | |||
| DASH / DoorDash, Inc. | 0,01 | 635,55 | 3,05 | 856,11 | 0,5361 | 0,0344 | |||
| CL / Colgate-Palmolive Company | 0,03 | 701,23 | 2,89 | 628,79 | 0,5074 | -0,1144 | |||
| OSK / Oshkosh Corporation | 0,02 | 905,99 | 2,83 | 1.427,03 | 0,4967 | 0,2048 | |||
| PEP / PepsiCo, Inc. | 0,02 | 786,06 | 2,80 | 802,26 | 0,4917 | 0,0046 | |||
| ALL / The Allstate Corporation | 0,01 | 727,47 | 2,68 | 749,21 | 0,4703 | -0,0251 | |||
| SPG / Simon Property Group, Inc. | 0,02 | 395,19 | 2,65 | 415,98 | 0,4653 | -0,3410 | |||
| MRK / Merck & Co., Inc. | 0,03 | 315,71 | 2,61 | 281,46 | 0,4593 | -0,6168 | |||
| AMAT / Applied Materials, Inc. | 0,01 | 662,41 | 2,56 | 811,03 | 0,4500 | 0,0088 | |||
| ED / Consolidated Edison, Inc. | 0,02 | 2,41 | 0,4235 | 0,4235 | |||||
| TMUS / T-Mobile US, Inc. | 0,01 | 2,41 | 0,4229 | 0,4229 | |||||
| AMT / American Tower Corporation | 0,01 | 926,63 | 2,33 | 850,61 | 0,4095 | 0,0242 | |||
| ACM / AECOM | 0,02 | 735,45 | 2,28 | 857,56 | 0,4006 | 0,0259 | |||
| GS / The Goldman Sachs Group, Inc. | 0,00 | 800,91 | 2,16 | 1.091,71 | 0,3793 | 0,0948 | |||
| TSN / Tyson Foods, Inc. | 0,04 | 337,32 | 2,12 | 273,59 | 0,3730 | -0,5188 | |||
| TRV / The Travelers Companies, Inc. | 0,01 | 2,12 | 0,3729 | 0,3729 | |||||
| USFD / US Foods Holding Corp. | 0,03 | 7.054,24 | 2,11 | 9.073,91 | 0,3709 | 0,3345 | |||
| AMGN / Amgen Inc. | 0,01 | 656,72 | 2,09 | 669,85 | 0,3682 | -0,0602 | |||
| SNOW / Snowflake Inc. | 0,01 | 711,15 | 2,03 | 1.041,57 | 0,3572 | 0,0766 | |||
| JCI / Johnson Controls International plc | 0,02 | 296,10 | 2,03 | 395,84 | 0,3566 | -0,2858 | |||
| MU / Micron Technology, Inc. | 0,02 | 1.134,66 | 1,99 | 1.664,60 | 0,3505 | 0,1718 | |||
| BPOP / Popular, Inc. | 0,02 | 1,98 | 0,3479 | 0,3479 | |||||
| UBER / Uber Technologies, Inc. | 0,02 | 607,07 | 1,96 | 667,06 | 0,3438 | -0,0571 | |||
| US21871X1090 / Corebridge Financial, Inc. | 0,05 | 1,95 | 0,3426 | 0,3426 | |||||
| EXEL / Exelixis, Inc. | 0,05 | 680,77 | 1,95 | 624,16 | 0,3425 | -0,0809 | |||
| ATR / AptarGroup, Inc. | 0,01 | 699,15 | 1,92 | 737,55 | 0,3373 | -0,0224 | |||
| AXS / AXIS Capital Holdings Limited | 0,02 | 746,56 | 1,91 | 725,54 | 0,3353 | -0,0277 | |||
| ZION / Zions Bancorporation, National Association | 0,04 | 697,88 | 1,90 | 854,77 | 0,3340 | 0,0205 | |||
| UNM / Unum Group | 0,03 | 714,21 | 1,90 | 652,78 | 0,3335 | -0,0621 | |||
| PYPL / PayPal Holdings, Inc. | 0,03 | 707,44 | 1,81 | 743,26 | 0,3187 | -0,0188 | |||
| AMD / Advanced Micro Devices, Inc. | 0,01 | 841,96 | 1,80 | 1.610,48 | 0,3158 | 0,1505 | |||
| ZM / Zoom Communications, Inc. | 0,02 | 1,66 | 0,2909 | 0,2909 | |||||
| RCL / Royal Caribbean Cruises Ltd. | 0,01 | 651,04 | 1,61 | 1.012,41 | 0,2837 | 0,0556 | |||
| APP / AppLovin Corporation | 0,00 | 1.594,49 | 1,56 | 2.379,37 | 0,2746 | 0,1749 | |||
| JAZZ / Jazz Pharmaceuticals plc | 0,01 | 638,24 | 1,52 | 626,32 | 0,2668 | -0,0625 | |||
| AXP / American Express Company | 0,01 | 4.475,45 | 1,51 | 5.093,10 | 0,2648 | -0,2801 | |||
| THC / Tenet Healthcare Corporation | 0,01 | 1.000,48 | 1,47 | 1.143,22 | 0,2580 | 0,0724 | |||
| PLTR / Palantir Technologies Inc. | 0,01 | 734,90 | 1,44 | 1.021,09 | 0,2524 | 0,0505 | |||
| PCG / PG&E Corporation | 0,10 | 702,61 | 1,37 | 582,50 | 0,2400 | -0,0747 | |||
| CBSH / Commerce Bancshares, Inc. | 0,02 | 714,12 | 1,30 | 724,05 | 0,2289 | -0,0203 | |||
| VTR / Ventas, Inc. | 0,02 | 1,22 | 0,2151 | 0,2151 | |||||
| THG / The Hanover Insurance Group, Inc. | 0,01 | 1,21 | 0,2127 | 0,2127 | |||||
| TWLO / Twilio Inc. | 0,01 | 1,18 | 0,2069 | 0,2069 | |||||
| UAL / United Airlines Holdings, Inc. | 0,01 | 762,67 | 1,16 | 1.007,62 | 0,2045 | 0,0395 | |||
| VEEV / Veeva Systems Inc. | 0,00 | 286,19 | 1,15 | 370,20 | 0,2026 | -0,1826 | |||
| DDOG / Datadog, Inc. | 0,01 | 1,14 | 0,2006 | 0,2006 | |||||
| GWRE / Guidewire Software, Inc. | 0,01 | 1,14 | 0,1998 | 0,1998 | |||||
| CSCO / Cisco Systems, Inc. | 0,02 | 1,10 | 0,1939 | 0,1939 | |||||
| HRB / H&R Block, Inc. | 0,02 | 1,10 | 0,1938 | 0,1938 | |||||
| DLR / Digital Realty Trust, Inc. | 0,01 | 1,08 | 0,1905 | 0,1905 | |||||
| NTAP / NetApp, Inc. | 0,01 | 165,94 | 1,06 | 208,43 | 0,1866 | -0,3535 | |||
| MDLZ / Mondelez International, Inc. | 0,02 | 763,83 | 1,05 | 725,20 | 0,1844 | -0,0164 | |||
| G / Genpact Limited | 0,02 | 1,03 | 0,1802 | 0,1802 | |||||
| MRVL / Marvell Technology, Inc. | 0,01 | 0,82 | 0,1437 | 0,1437 | |||||
| KO / The Coca-Cola Company | 0,01 | 0,69 | 0,1213 | 0,1213 | |||||
| SPY / State Street SPDR S&P 500 ETF Trust | 0,00 | 180,98 | 0,65 | 220,10 | 0,1149 | -0,2054 | |||
| GDDY / GoDaddy Inc. | 0,00 | 151,91 | 0,65 | 116,28 | 0,1145 | -0,3587 | |||
| Aptiv PLC / EC (JE00BTDN8H13) | 0,01 | 0,63 | 0,1108 | 0,1108 | |||||
| NFG / National Fuel Gas Company | 0,01 | 0,61 | 0,1081 | 0,1081 | |||||
| UNH / UnitedHealth Group Incorporated | 0,00 | 692,66 | 0,51 | 383,02 | 0,0901 | -0,0772 | |||
| MPC / Marathon Petroleum Corporation | 0,00 | 699,73 | 0,51 | 900,00 | 0,0897 | 0,0088 | |||
| KR / The Kroger Co. | 0,01 | -26,51 | 0,50 | -28,67 | 0,0879 | -1,0124 | |||
| BKNG / Booking Holdings Inc. | 0,00 | 0,30 | 0,0532 | 0,0532 | |||||
| ROST / Ross Stores, Inc. | 0,00 | -100,00 | 0,00 | -100,00 | -0,1272 | ||||
| FTV / Fortive Corporation | 0,00 | -100,00 | 0,00 | -100,00 | -0,5993 | ||||
| COP / ConocoPhillips | 0,00 | -100,00 | 0,00 | -100,00 | -0,2269 | ||||
| MMC / Marsh & McLennan Companies, Inc. | 0,00 | -100,00 | 0,00 | -100,00 | -0,6448 | ||||
| NOC / Northrop Grumman Corporation | 0,00 | -100,00 | 0,00 | -100,00 | -0,4597 | ||||
| FITB / Fifth Third Bancorp | 0,00 | -100,00 | 0,00 | -100,00 | -0,7371 | ||||
| MS / Morgan Stanley | 0,00 | -100,00 | 0,00 | -100,00 | -0,1890 | ||||
| STLD / Steel Dynamics, Inc. | 0,00 | -100,00 | 0,00 | -100,00 | -0,2113 | ||||
| ABNB / Airbnb, Inc. | 0,00 | -100,00 | 0,00 | -100,00 | -0,1728 | ||||
| FCX / Freeport-McMoRan Inc. | 0,00 | -100,00 | 0,00 | -100,00 | -0,2033 |