Grundlæggende statistik
| Porteføljeværdi | $ 901.504.148 |
| Nuværende stillinger | 162 |
Seneste beholdninger, ydeevne, AUM (fra 13F, 13D)
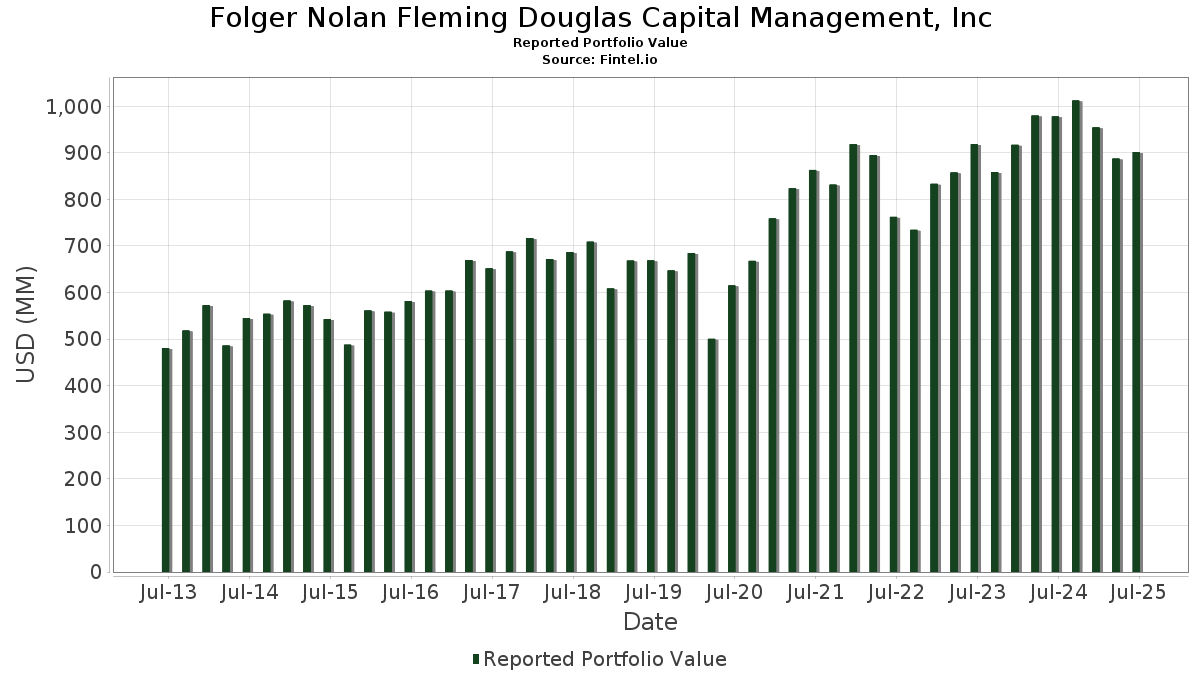
Folger Nolan Fleming Douglas Capital Management, Inc har afsløret 162 samlede besiddelser i deres seneste SEC-arkivering. Den seneste porteføljeværdi er beregnet til at være $ 901.504.148 USD. Faktiske aktiver under forvaltning (AUM) er denne værdi plus kontanter (som ikke er oplyst). Folger Nolan Fleming Douglas Capital Management, Incs største beholdninger er Vanguard World Fund - Vanguard Information Technology ETF (US:VGT) , Corteva, Inc. (US:CTVA) , DuPont de Nemours, Inc. (US:DD) , Microsoft Corporation (US:MSFT) , and Apple Inc. (US:AAPL) . Folger Nolan Fleming Douglas Capital Management, Incs nye stillinger omfatter iShares Trust - iShares Russell 1000 Growth ETF (US:IWF) , .
Top øger dette kvartal
Vi bruger ændringen i porteføljeallokeringen, fordi dette er den mest meningsfulde metrik. Ændringer kan skyldes handler eller ændringer i aktiekurser.
| Sikkerhed | Aktier (MM) |
Værdi (MM$) |
Portefølje % | ΔPortefølje % |
|---|---|---|---|---|
| 0,18 | 119,23 | 13,2257 | 2,1951 | |
| 0,09 | 45,67 | 5,0658 | 1,0592 | |
| 1,01 | 75,42 | 8,3658 | 0,3255 | |
| 0,08 | 23,44 | 2,6006 | 0,3154 | |
| 0,06 | 9,35 | 1,0367 | 0,3059 | |
| 0,09 | 20,44 | 2,2677 | 0,2702 | |
| 0,01 | 9,45 | 1,0485 | 0,2419 | |
| 0,12 | 20,64 | 2,2894 | 0,2133 | |
| 0,08 | 9,92 | 1,1004 | 0,2061 | |
| 0,06 | 15,64 | 1,7349 | 0,1831 |
Top falder i dette kvartal
Vi bruger ændringen i porteføljeallokeringen, fordi dette er den mest meningsfulde metrik. Ændringer kan skyldes handler eller ændringer i aktiekurser.
| Sikkerhed | Aktier (MM) |
Værdi (MM$) |
Portefølje % | ΔPortefølje % |
|---|---|---|---|---|
| 0,97 | 25,62 | 2,8414 | -1,2863 | |
| 0,81 | 55,73 | 6,1822 | -1,0868 | |
| 0,03 | 8,98 | 0,9966 | -0,4869 | |
| 0,15 | 30,39 | 3,3708 | -0,3969 | |
| 0,03 | 5,51 | 0,6113 | -0,3615 | |
| 0,13 | 12,41 | 1,3769 | -0,3235 | |
| 0,12 | 18,60 | 2,0627 | -0,2212 | |
| 0,09 | 12,22 | 1,3551 | -0,2140 | |
| 0,10 | 15,46 | 1,7148 | -0,1975 | |
| 0,05 | 15,13 | 1,6779 | -0,1736 |
13F og Fondsarkivering
Denne formular blev indsendt den 2025-07-24 for rapporteringsperioden 2025-06-30. Klik på linkikonet for at se den fulde transaktionshistorik.
Opgrader for at låse op for premium-data og eksportere til Excel ![]() .
.
| Sikkerhed | Type | Gennemsnitlig aktiekurs | Aktier (MM) |
Δ Aktier (%) |
Δ Aktier (%) |
Værdi ($MM) |
Portefølje (%) |
ΔPortefølje (%) |
|
|---|---|---|---|---|---|---|---|---|---|
| VGT / Vanguard World Fund - Vanguard Information Technology ETF | 0,18 | -0,41 | 119,23 | 21,79 | 13,2257 | 2,1951 | |||
| CTVA / Corteva, Inc. | 1,01 | -10,76 | 75,42 | 5,69 | 8,3658 | 0,3255 | |||
| DD / DuPont de Nemours, Inc. | 0,81 | -5,94 | 55,73 | -13,61 | 6,1822 | -1,0868 | |||
| MSFT / Microsoft Corporation | 0,09 | -3,08 | 45,67 | 28,43 | 5,0658 | 1,0592 | |||
| AAPL / Apple Inc. | 0,15 | -1,61 | 30,39 | -9,12 | 3,3708 | -0,3969 | |||
| DOW / Dow Inc. | 0,97 | -7,79 | 25,62 | -30,08 | 2,8414 | -1,2863 | |||
| JPM / JPMorgan Chase & Co. | 0,08 | -2,19 | 23,44 | 15,60 | 2,6006 | 0,3154 | |||
| GOOG / Alphabet Inc. | 0,12 | -1,35 | 20,64 | 12,01 | 2,2894 | 0,2133 | |||
| AMZN / Amazon.com, Inc. | 0,09 | 0,00 | 20,44 | 15,31 | 2,2677 | 0,2702 | |||
| V / Visa Inc. | 0,06 | -1,23 | 19,70 | 0,06 | 2,1848 | -0,0331 | |||
| PG / The Procter & Gamble Company | 0,12 | -1,87 | 18,60 | -8,26 | 2,0627 | -0,2212 | |||
| LOW / Lowe's Companies, Inc. | 0,08 | -1,52 | 16,97 | -6,31 | 1,8823 | -0,1585 | |||
| MAR / Marriott International, Inc. | 0,06 | -0,99 | 15,64 | 13,56 | 1,7349 | 0,1831 | |||
| JNJ / Johnson & Johnson | 0,10 | -1,11 | 15,46 | -8,92 | 1,7148 | -0,1975 | |||
| MCD / McDonald's Corporation | 0,05 | -1,59 | 15,13 | -7,95 | 1,6779 | -0,1736 | |||
| ITW / Illinois Tool Works Inc. | 0,06 | -1,52 | 14,56 | -1,82 | 1,6152 | -0,0558 | |||
| RTX / RTX Corporation | 0,09 | -1,39 | 13,24 | 8,70 | 1,4687 | 0,0964 | |||
| ABT / Abbott Laboratories | 0,10 | -0,68 | 13,03 | 1,84 | 1,4453 | 0,0037 | |||
| CHD / Church & Dwight Co., Inc. | 0,13 | -5,79 | 12,41 | -17,75 | 1,3769 | -0,3235 | |||
| PEP / PepsiCo, Inc. | 0,09 | -0,38 | 12,22 | -12,27 | 1,3551 | -0,2140 | |||
| CAT / Caterpillar Inc. | 0,03 | -3,18 | 11,33 | 13,97 | 1,2567 | 0,1366 | |||
| VTI / Vanguard Index Funds - Vanguard Total Stock Market ETF | 0,04 | -2,49 | 10,90 | 7,83 | 1,2095 | 0,0701 | |||
| DIS / The Walt Disney Company | 0,08 | -0,52 | 9,92 | 24,98 | 1,1004 | 0,2061 | |||
| META / Meta Platforms, Inc. | 0,01 | 3,10 | 9,45 | 32,03 | 1,0485 | 0,2419 | |||
| NVDA / NVIDIA Corporation | 0,06 | -1,16 | 9,35 | 44,09 | 1,0367 | 0,3059 | |||
| IWR / iShares Trust - iShares Russell Mid-Cap ETF | 0,10 | -3,31 | 9,11 | 4,54 | 1,0110 | 0,0286 | |||
| UNH / UnitedHealth Group Incorporated | 0,03 | 14,56 | 8,98 | -31,76 | 0,9966 | -0,4869 | |||
| VO / Vanguard Index Funds - Vanguard Mid-Cap ETF | 0,03 | -2,07 | 8,86 | 5,97 | 0,9833 | 0,0408 | |||
| XOM / Exxon Mobil Corporation | 0,08 | -3,11 | 8,77 | -12,18 | 0,9726 | -0,1522 | |||
| TROW / T. Rowe Price Group, Inc. | 0,09 | -0,79 | 8,62 | 4,20 | 0,9557 | 0,0241 | |||
| NEE / NextEra Energy, Inc. | 0,12 | -1,50 | 8,14 | -3,54 | 0,9026 | -0,0479 | |||
| IFF / International Flavors & Fragrances Inc. | 0,11 | 0,00 | 8,05 | -5,23 | 0,8925 | -0,0641 | |||
| CSCO / Cisco Systems, Inc. | 0,12 | -2,86 | 8,01 | 9,22 | 0,8884 | 0,0622 | |||
| IBB / iShares Trust - iShares Biotechnology ETF | 0,06 | -2,33 | 7,92 | -3,39 | 0,8787 | -0,0452 | |||
| WTRG / Essential Utilities, Inc. | 0,20 | 1,62 | 7,56 | -4,53 | 0,8388 | -0,0536 | |||
| CC / The Chemours Company | 0,66 | 0,00 | 7,50 | -15,37 | 0,8324 | -0,1667 | |||
| UNP / Union Pacific Corporation | 0,03 | -0,65 | 7,02 | -3,24 | 0,7782 | -0,0387 | |||
| AXP / American Express Company | 0,02 | -4,15 | 6,79 | 13,64 | 0,7532 | 0,0799 | |||
| CVX / Chevron Corporation | 0,05 | -2,54 | 6,69 | -16,58 | 0,7418 | -0,1614 | |||
| HON / Honeywell International Inc. | 0,03 | -2,05 | 6,32 | 7,72 | 0,7009 | 0,0400 | |||
| VB / Vanguard Index Funds - Vanguard Small-Cap ETF | 0,03 | -1,41 | 6,08 | 5,37 | 0,6748 | 0,0242 | |||
| IWM / iShares Trust - iShares Russell 2000 ETF | 0,03 | -2,28 | 5,72 | 5,71 | 0,6350 | 0,0248 | |||
| WFC / Wells Fargo & Company | 0,07 | -4,35 | 5,66 | 6,77 | 0,6283 | 0,0305 | |||
| BDX / Becton, Dickinson and Company | 0,03 | -15,11 | 5,51 | -36,16 | 0,6113 | -0,3615 | |||
| MRK / Merck & Co., Inc. | 0,07 | -0,69 | 5,45 | -12,41 | 0,6050 | -0,0966 | |||
| ADBE / Adobe Inc. | 0,01 | -2,58 | 5,19 | -1,72 | 0,5753 | -0,0193 | |||
| FDX / FedEx Corporation | 0,02 | -0,85 | 4,22 | -7,55 | 0,4685 | -0,0463 | |||
| BRK.B / Berkshire Hathaway Inc. | 0,01 | -5,69 | 3,99 | -13,97 | 0,4422 | -0,0799 | |||
| LLY / Eli Lilly and Company | 0,00 | 0,00 | 3,78 | -5,61 | 0,4196 | -0,0320 | |||
| ATO / Atmos Energy Corporation | 0,02 | -0,02 | 3,71 | -0,32 | 0,4110 | -0,0078 | |||
| SO / The Southern Company | 0,04 | -2,23 | 3,67 | -2,34 | 0,4070 | -0,0164 | |||
| IBM / International Business Machines Corporation | 0,01 | -2,60 | 3,50 | 15,48 | 0,3881 | 0,0467 | |||
| POWERSHARES QQQ TR ETF SERIES / (73935A104) | 0,01 | 3,41 | 0,0000 | ||||||
| WMT / Walmart Inc. | 0,03 | -0,54 | 3,11 | 10,81 | 0,3444 | 0,0286 | |||
| BRK.A / Berkshire Hathaway Inc. | 0,00 | 0,00 | 2,92 | -8,71 | 0,3234 | -0,0365 | |||
| KO / The Coca-Cola Company | 0,04 | -0,15 | 2,59 | -1,34 | 0,2869 | -0,0085 | |||
| ABBV / AbbVie Inc. | 0,01 | -1,52 | 2,58 | -12,75 | 0,2862 | -0,0470 | |||
| GE / General Electric Company | 0,01 | -2,75 | 2,57 | 25,06 | 0,2852 | 0,0536 | |||
| MTB / M&T Bank Corporation | 0,01 | 0,81 | 2,42 | 9,39 | 0,2690 | 0,0192 | |||
| CRM / Salesforce, Inc. | 0,01 | 9,76 | 2,34 | 11,52 | 0,2600 | 0,0232 | |||
| INTU / Intuit Inc. | 0,00 | 0,00 | 2,16 | 28,30 | 0,2394 | 0,0498 | |||
| D / Dominion Energy, Inc. | 0,04 | -6,33 | 2,13 | -5,58 | 0,2366 | -0,0179 | |||
| K / Kellanova | 0,03 | -3,84 | 2,10 | -7,33 | 0,2330 | -0,0223 | |||
| HD / The Home Depot, Inc. | 0,01 | -1,21 | 2,00 | -1,19 | 0,2218 | -0,0062 | |||
| KMB / Kimberly-Clark Corporation | 0,01 | -1,03 | 1,92 | -10,30 | 0,2125 | -0,0281 | |||
| EMR / Emerson Electric Co. | 0,01 | -4,73 | 1,77 | 15,85 | 0,1963 | 0,0242 | |||
| GOOGL / Alphabet Inc. | 0,01 | -2,77 | 1,75 | 10,82 | 0,1944 | 0,0162 | |||
| MMM / 3M Company | 0,01 | -2,91 | 1,65 | 0,61 | 0,1832 | -0,0017 | |||
| TXN / Texas Instruments Incorporated | 0,01 | 0,00 | 1,62 | 15,54 | 0,1799 | 0,0217 | |||
| BAC / Bank of America Corporation | 0,03 | -1,38 | 1,58 | 11,79 | 0,1758 | 0,0161 | |||
| HSY / The Hershey Company | 0,01 | -0,76 | 1,57 | -3,68 | 0,1741 | -0,0095 | |||
| VNQ / Vanguard Specialized Funds - Vanguard Real Estate ETF | 0,02 | -10,76 | 1,41 | -12,20 | 0,1565 | -0,0246 | |||
| AMGN / Amgen Inc. | 0,00 | -1,38 | 1,40 | -11,65 | 0,1548 | -0,0231 | |||
| VZ / Verizon Communications Inc. | 0,03 | -2,54 | 1,34 | -7,00 | 0,1488 | -0,0138 | |||
| NTRS / Northern Trust Corporation | 0,01 | 0,00 | 1,32 | 28,59 | 0,1463 | 0,0307 | |||
| ORCL / Oracle Corporation | 0,01 | -0,25 | 1,31 | 55,95 | 0,1454 | 0,0507 | |||
| GEV / GE Vernova Inc. | 0,00 | -3,72 | 1,30 | 67,01 | 0,1443 | 0,0565 | |||
| DUK / Duke Energy Corporation | 0,01 | -4,62 | 1,26 | -7,71 | 0,1394 | -0,0140 | |||
| KIM / Kimco Realty Corporation | 0,06 | -2,69 | 1,21 | -3,74 | 0,1342 | -0,0073 | |||
| VEA / Vanguard Tax-Managed Funds - Vanguard FTSE Developed Markets ETF | 0,02 | 1,86 | 1,12 | 14,27 | 0,1244 | 0,0138 | |||
| MS / Morgan Stanley | 0,01 | 0,00 | 1,04 | 20,72 | 0,1151 | 0,0183 | |||
| VOO / Vanguard Index Funds - Vanguard S&P 500 ETF | 0,00 | 12,93 | 1,02 | 24,79 | 0,1128 | 0,0210 | |||
| LMT / Lockheed Martin Corporation | 0,00 | 0,00 | 1,01 | 3,70 | 0,1119 | 0,0023 | |||
| PNC / The PNC Financial Services Group, Inc. | 0,01 | -1,89 | 1,00 | 4,08 | 0,1104 | 0,0026 | |||
| ALL / The Allstate Corporation | 0,00 | 0,00 | 0,86 | -2,70 | 0,0958 | -0,0043 | |||
| SYY / Sysco Corporation | 0,01 | 0,02 | 0,86 | 1,06 | 0,0953 | -0,0006 | |||
| BK / The Bank of New York Mellon Corporation | 0,01 | -4,10 | 0,85 | 4,28 | 0,0946 | 0,0024 | |||
| EBGEF / Enbridge Inc. - Preferred Stock | 0,02 | -1,70 | 0,84 | 0,60 | 0,0930 | -0,0010 | |||
| GLW / Corning Incorporated | 0,02 | -10,68 | 0,83 | 2,61 | 0,0917 | 0,0009 | |||
| CSX / CSX Corporation | 0,02 | -1,23 | 0,79 | 9,60 | 0,0874 | 0,0063 | |||
| INTC / Intel Corporation | 0,03 | -1,83 | 0,78 | -3,10 | 0,0867 | -0,0042 | |||
| TJX / The TJX Companies, Inc. | 0,01 | 0,00 | 0,78 | 1,30 | 0,0866 | -0,0002 | |||
| TRV / The Travelers Companies, Inc. | 0,00 | 0,00 | 0,78 | 1,17 | 0,0860 | -0,0003 | |||
| DHR / Danaher Corporation | 0,00 | -3,64 | 0,73 | -7,22 | 0,0813 | -0,0076 | |||
| UDR / UDR, Inc. | 0,02 | -1,31 | 0,72 | -10,77 | 0,0800 | -0,0111 | |||
| FRT / Federal Realty Investment Trust | 0,01 | -1,31 | 0,71 | -4,17 | 0,0792 | -0,0047 | |||
| PM / Philip Morris International Inc. | 0,00 | -10,35 | 0,67 | 2,92 | 0,0743 | 0,0009 | |||
| VMC / Vulcan Materials Company | 0,00 | 0,00 | 0,65 | 11,70 | 0,0721 | 0,0066 | |||
| SPY / SPDR S&P 500 ETF | 0,00 | 0,00 | 0,62 | 10,34 | 0,0687 | 0,0055 | |||
| GIS / General Mills, Inc. | 0,01 | -0,18 | 0,59 | -13,51 | 0,0654 | -0,0114 | |||
| CARR / Carrier Global Corporation | 0,01 | -13,45 | 0,59 | -0,17 | 0,0651 | -0,0011 | |||
| LIN / Linde plc | 0,00 | 0,00 | 0,58 | 0,87 | 0,0640 | -0,0005 | |||
| BMY / Bristol-Myers Squibb Company | 0,01 | -5,74 | 0,56 | -28,50 | 0,0619 | -0,0260 | |||
| DE / Deere & Company | 0,00 | -3,13 | 0,53 | 4,91 | 0,0593 | 0,0019 | |||
| OTIS / Otis Worldwide Corporation | 0,01 | -10,56 | 0,52 | -14,21 | 0,0576 | -0,0106 | |||
| CL / Colgate-Palmolive Company | 0,01 | -0,97 | 0,51 | -3,75 | 0,0569 | -0,0033 | |||
| ADM / Archer-Daniels-Midland Company | 0,01 | 0,00 | 0,51 | 9,87 | 0,0568 | 0,0043 | |||
| BEN / Franklin Resources, Inc. | 0,02 | 0,00 | 0,51 | 24,15 | 0,0565 | 0,0102 | |||
| FI / Fiserv, Inc. | 0,00 | 0,00 | 0,50 | -21,96 | 0,0556 | -0,0167 | |||
| VWO / Vanguard International Equity Index Funds - Vanguard FTSE Emerging Markets ETF | 0,01 | 0,00 | 0,50 | 9,27 | 0,0550 | 0,0039 | |||
| COST / Costco Wholesale Corporation | 0,00 | -12,10 | 0,49 | -7,91 | 0,0542 | -0,0056 | |||
| COF / Capital One Financial Corporation | 0,00 | 0,49 | 0,0541 | 0,0541 | |||||
| T / AT&T Inc. | 0,02 | 0,00 | 0,49 | 2,32 | 0,0539 | 0,0004 | |||
| MSI / Motorola Solutions, Inc. | 0,00 | 0,00 | 0,48 | -3,82 | 0,0530 | -0,0031 | |||
| MDLZ / Mondelez International, Inc. | 0,01 | 0,06 | 0,47 | -0,64 | 0,0519 | -0,0011 | |||
| COP / ConocoPhillips | 0,01 | -0,02 | 0,47 | -14,63 | 0,0519 | -0,0098 | |||
| BALL / Ball Corporation | 0,01 | -3,13 | 0,47 | 4,47 | 0,0518 | 0,0014 | |||
| LH / Labcorp Holdings Inc. | 0,00 | -12,09 | 0,46 | -0,86 | 0,0510 | -0,0012 | |||
| NOC / Northrop Grumman Corporation | 0,00 | -2,69 | 0,45 | -5,04 | 0,0502 | -0,0035 | |||
| AVGO / Broadcom Inc. | 0,00 | -1,20 | 0,45 | 63,18 | 0,0501 | 0,0188 | |||
| NSC / Norfolk Southern Corporation | 0,00 | -10,24 | 0,45 | -3,03 | 0,0498 | -0,0023 | |||
| DOV / Dover Corporation | 0,00 | 0,00 | 0,44 | 4,27 | 0,0489 | 0,0013 | |||
| WM / Waste Management, Inc. | 0,00 | -1,30 | 0,44 | -2,47 | 0,0483 | -0,0020 | |||
| PFE / Pfizer Inc. | 0,02 | -21,43 | 0,42 | -24,91 | 0,0462 | -0,0162 | |||
| CVS / CVS Health Corporation | 0,01 | 0,49 | 0,38 | 2,43 | 0,0422 | 0,0003 | |||
| TFC / Truist Financial Corporation | 0,01 | -0,59 | 0,36 | 3,75 | 0,0400 | 0,0009 | |||
| TMO / Thermo Fisher Scientific Inc. | 0,00 | -3,40 | 0,36 | -21,37 | 0,0397 | -0,0115 | |||
| WTM / White Mountains Insurance Group, Ltd. | 0,00 | 0,00 | 0,36 | -6,79 | 0,0396 | -0,0035 | |||
| HWM / Howmet Aerospace Inc. | 0,00 | 0,00 | 0,36 | 43,72 | 0,0395 | 0,0115 | |||
| BA / The Boeing Company | 0,00 | 0,00 | 0,35 | 22,78 | 0,0383 | 0,0066 | |||
| MDT / Medtronic plc | 0,00 | -19,44 | 0,34 | -21,81 | 0,0374 | -0,0112 | |||
| WCN / Waste Connections, Inc. | 0,00 | 0,00 | 0,34 | -4,29 | 0,0372 | -0,0023 | |||
| NYT / The New York Times Company | 0,01 | 0,00 | 0,33 | 12,84 | 0,0371 | 0,0037 | |||
| GHC / Graham Holdings Company | 0,00 | 0,00 | 0,33 | -1,51 | 0,0363 | -0,0011 | |||
| AFL / Aflac Incorporated | 0,00 | 0,00 | 0,32 | -5,31 | 0,0357 | -0,0025 | |||
| PEG / Public Service Enterprise Group Incorporated | 0,00 | 0,00 | 0,32 | 2,26 | 0,0352 | 0,0002 | |||
| NKE / NIKE, Inc. | 0,00 | 1,65 | 0,31 | 13,77 | 0,0349 | 0,0037 | |||
| WEC / WEC Energy Group, Inc. | 0,00 | 0,00 | 0,31 | -4,35 | 0,0342 | -0,0021 | |||
| AEP / American Electric Power Company, Inc. | 0,00 | 0,00 | 0,30 | -5,05 | 0,0334 | -0,0023 | |||
| PSX / Phillips 66 | 0,00 | 0,00 | 0,30 | -3,22 | 0,0334 | -0,0017 | |||
| SJM / The J. M. Smucker Company | 0,00 | 0,00 | 0,30 | -16,90 | 0,0327 | -0,0074 | |||
| AVAV / AeroVironment, Inc. | 0,00 | 0,28 | 0,0316 | 0,0316 | |||||
| APD / Air Products and Chemicals, Inc. | 0,00 | -25,23 | 0,28 | -28,61 | 0,0308 | -0,0129 | |||
| YUM / Yum! Brands, Inc. | 0,00 | 0,00 | 0,27 | -5,56 | 0,0302 | -0,0024 | |||
| TRMB / Trimble Inc. | 0,00 | 0,00 | 0,26 | 15,70 | 0,0287 | 0,0035 | |||
| NFG / National Fuel Gas Company | 0,00 | 0,00 | 0,26 | 7,05 | 0,0286 | 0,0014 | |||
| QCOM / QUALCOMM Incorporated | 0,00 | -6,10 | 0,26 | -2,67 | 0,0283 | -0,0012 | |||
| XLU / The Select Sector SPDR Trust - The Utilities Select Sector SPDR Fund | 0,00 | 0,00 | 0,24 | 3,39 | 0,0272 | 0,0005 | |||
| BHRB / Burke & Herbert Financial Services Corp. | 0,00 | 0,10 | 0,24 | 6,19 | 0,0267 | 0,0012 | |||
| EFA / iShares Trust - iShares MSCI EAFE ETF | 0,00 | 0,00 | 0,24 | 9,59 | 0,0267 | 0,0019 | |||
| DTE / DTE Energy Company | 0,00 | -11,79 | 0,24 | -15,71 | 0,0263 | -0,0053 | |||
| TSLA / Tesla, Inc. | 0,00 | 0,23 | 0,0260 | 0,0260 | |||||
| MTD / Mettler-Toledo International Inc. | 0,00 | 0,00 | 0,23 | -0,43 | 0,0254 | -0,0005 | |||
| CI / The Cigna Group | 0,00 | 0,00 | 0,22 | 0,46 | 0,0245 | -0,0003 | |||
| CMG / Chipotle Mexican Grill, Inc. | 0,00 | 0,22 | 0,0243 | 0,0243 | |||||
| MO / Altria Group, Inc. | 0,00 | -1,34 | 0,22 | -3,59 | 0,0239 | -0,0013 | |||
| FSLR / First Solar, Inc. | 0,00 | 0,21 | 0,0237 | 0,0237 | |||||
| IWF / iShares Trust - iShares Russell 1000 Growth ETF | 0,00 | 0,21 | 0,0230 | 0,0230 | |||||
| LPX / Louisiana-Pacific Corporation | 0,00 | 0,00 | 0,20 | -6,39 | 0,0227 | -0,0020 | |||
| TGT / Target Corporation | 0,00 | -26,15 | 0,20 | -30,24 | 0,0226 | -0,0103 | |||
| ELME / Elme Communities | 0,01 | 0,00 | 0,19 | -8,57 | 0,0213 | -0,0024 | |||
| VWDRY / Vestas Wind Systems A/S - Depositary Receipt (Common Stock) | 0,02 | 0,00 | 0,10 | 9,09 | 0,0107 | 0,0007 | |||
| DFS / Discover Financial Services | 0,00 | -100,00 | 0,00 | 0,0000 | |||||
| MAN / ManpowerGroup Inc. | 0,00 | -100,00 | 0,00 | 0,0000 | |||||
| BFS / Saul Centers, Inc. | 0,00 | -100,00 | 0,00 | 0,0000 | |||||
| PKG / Packaging Corporation of America | 0,00 | -100,00 | 0,00 | 0,0000 | |||||
| CMCSA / Comcast Corporation | 0,00 | -100,00 | 0,00 | 0,0000 | |||||
| HPQ / HP Inc. | 0,00 | -100,00 | 0,00 | 0,0000 | |||||
| CADNF / Cascades Inc. | 0,00 | -100,00 | 0,00 | 0,0000 | |||||
| NSRGY / Nestlé S.A. - Depositary Receipt (Common Stock) | 0,00 | -100,00 | 0,00 | 0,0000 |