Grundlæggende statistik
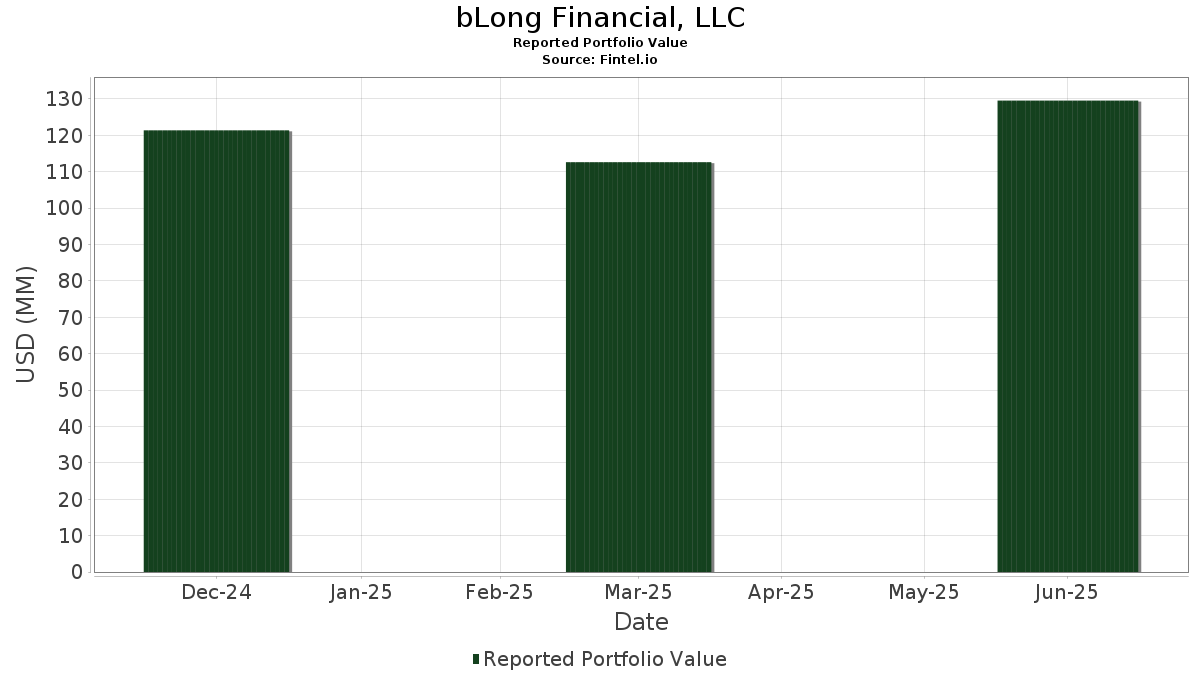
| Porteføljeværdi | $ 129.566.377 |
| Nuværende stillinger | 79 |
Seneste beholdninger, ydeevne, AUM (fra 13F, 13D)
bLong Financial, LLC har afsløret 79 samlede besiddelser i deres seneste SEC-arkivering. Den seneste porteføljeværdi er beregnet til at være $ 129.566.377 USD. Faktiske aktiver under forvaltning (AUM) er denne værdi plus kontanter (som ikke er oplyst). bLong Financial, LLCs største beholdninger er NVIDIA Corporation (US:NVDA) , Apple Inc. (US:AAPL) , iShares Trust - iShares MSCI Europe Financials ETF (US:EUFN) , Eli Lilly and Company (US:LLY) , and Microsoft Corporation (US:MSFT) . bLong Financial, LLCs nye stillinger omfatter Spinnaker ETF Series - Select STOXX Europe Aerospace & Defense ETF (US:EUAD) , iShares Trust - iShares International Select Dividend ETF (US:IDV) , iShares, Inc. - iShares Emerging Markets Dividend ETF (US:DVYE) , Arm Holdings plc - Depositary Receipt (Common Stock) (US:ARM) , and Ubiquiti Inc. (US:UI) .
Top øger dette kvartal
Vi bruger ændringen i porteføljeallokeringen, fordi dette er den mest meningsfulde metrik. Ændringer kan skyldes handler eller ændringer i aktiekurser.
| Sikkerhed | Aktier (MM) |
Værdi (MM$) |
Portefølje % | ΔPortefølje % |
|---|---|---|---|---|
| 0,49 | 15,34 | 11,8418 | 4,7202 | |
| 0,17 | 26,56 | 20,4959 | 4,2883 | |
| 0,11 | 4,73 | 3,6534 | 3,6534 | |
| 0,08 | 2,62 | 2,0233 | 2,0233 | |
| 0,06 | 1,64 | 1,2694 | 1,2694 | |
| 0,01 | 2,52 | 1,9450 | 0,5935 | |
| 0,01 | 5,41 | 4,1757 | 0,5840 | |
| 0,01 | 3,77 | 2,9133 | 0,2964 | |
| 0,02 | 2,25 | 1,7386 | 0,2901 | |
| 0,00 | 0,33 | 0,2527 | 0,2527 |
Top falder i dette kvartal
Vi bruger ændringen i porteføljeallokeringen, fordi dette er den mest meningsfulde metrik. Ændringer kan skyldes handler eller ændringer i aktiekurser.
| Sikkerhed | Aktier (MM) |
Værdi (MM$) |
Portefølje % | ΔPortefølje % |
|---|---|---|---|---|
| 0,09 | 19,30 | 14,8956 | -3,7193 | |
| 0,01 | 5,47 | 4,2193 | -0,8863 | |
| 0,02 | 1,60 | 1,2330 | -0,3828 | |
| 0,00 | 2,12 | 1,6350 | -0,3688 | |
| 0,00 | 0,70 | 0,5425 | -0,2236 | |
| 0,01 | 0,69 | 0,5338 | -0,2222 | |
| 0,00 | 0,85 | 0,6573 | -0,2002 | |
| 0,00 | 0,83 | 0,6385 | -0,1905 | |
| 0,03 | 1,11 | 0,8529 | -0,1796 | |
| 0,01 | 0,88 | 0,6825 | -0,1699 |
13F og Fondsarkivering
Denne formular blev indsendt den 2025-08-13 for rapporteringsperioden 2025-06-30. Klik på linkikonet for at se den fulde transaktionshistorik.
Opgrader for at låse op for premium-data og eksportere til Excel ![]() .
.
| Sikkerhed | Type | Gennemsnitlig aktiekurs | Aktier (MM) |
Δ Aktier (%) |
Δ Aktier (%) |
Værdi ($MM) |
Portefølje (%) |
ΔPortefølje (%) |
|
|---|---|---|---|---|---|---|---|---|---|
| NVDA / NVIDIA Corporation | 0,17 | -0,21 | 26,56 | 45,47 | 20,4959 | 4,2883 | |||
| AAPL / Apple Inc. | 0,09 | -0,34 | 19,30 | -7,96 | 14,8956 | -3,7193 | |||
| EUFN / iShares Trust - iShares MSCI Europe Financials ETF | 0,49 | 72,28 | 15,34 | 91,27 | 11,8418 | 4,7202 | |||
| LLY / Eli Lilly and Company | 0,01 | 0,72 | 5,47 | -4,94 | 4,2193 | -0,8863 | |||
| MSFT / Microsoft Corporation | 0,01 | 0,93 | 5,41 | 33,75 | 4,1757 | 0,5840 | |||
| EUAD / Spinnaker ETF Series - Select STOXX Europe Aerospace & Defense ETF | 0,11 | 4,73 | 3,6534 | 3,6534 | |||||
| META / Meta Platforms, Inc. | 0,01 | 0,00 | 3,77 | 28,06 | 2,9133 | 0,2964 | |||
| IDV / iShares Trust - iShares International Select Dividend ETF | 0,08 | 2,62 | 2,0233 | 2,0233 | |||||
| AVGO / Broadcom Inc. | 0,01 | 0,55 | 2,52 | 65,57 | 1,9450 | 0,5935 | |||
| AMD / Advanced Micro Devices, Inc. | 0,02 | -0,03 | 2,25 | 38,07 | 1,7386 | 0,2901 | |||
| JPM / JPMorgan Chase & Co. | 0,01 | -0,66 | 2,18 | 17,38 | 1,6838 | 0,0341 | |||
| BRK.B / Berkshire Hathaway Inc. | 0,00 | 2,90 | 2,12 | -6,16 | 1,6350 | -0,3688 | |||
| IBM / International Business Machines Corporation | 0,01 | 0,08 | 1,84 | 18,67 | 1,4179 | 0,0432 | |||
| DVYE / iShares, Inc. - iShares Emerging Markets Dividend ETF | 0,06 | 1,64 | 1,2694 | 1,2694 | |||||
| MRK / Merck & Co., Inc. | 0,02 | -0,46 | 1,60 | -12,20 | 1,2330 | -0,3828 | |||
| CRM / Salesforce, Inc. | 0,00 | 1,66 | 1,34 | 3,32 | 1,0321 | -0,1172 | |||
| CSCO / Cisco Systems, Inc. | 0,02 | 0,00 | 1,23 | 12,43 | 0,9499 | -0,0220 | |||
| MS / Morgan Stanley | 0,01 | -2,26 | 1,22 | 18,01 | 0,9413 | 0,0237 | |||
| GOOGL / Alphabet Inc. | 0,01 | 0,00 | 1,21 | 13,98 | 0,9317 | -0,0087 | |||
| TSLA / Tesla, Inc. | 0,00 | 1,23 | 1,17 | 24,15 | 0,9049 | 0,0660 | |||
| VZ / Verizon Communications Inc. | 0,03 | -0,39 | 1,11 | -4,91 | 0,8529 | -0,1796 | |||
| ABT / Abbott Laboratories | 0,01 | 0,06 | 0,99 | 2,60 | 0,7622 | -0,0924 | |||
| DELL / Dell Technologies Inc. | 0,01 | 2,90 | 0,98 | 38,39 | 0,7543 | 0,1274 | |||
| JNJ / Johnson & Johnson | 0,01 | 0,00 | 0,88 | -7,92 | 0,6825 | -0,1699 | |||
| AMGN / Amgen Inc. | 0,00 | -1,61 | 0,85 | -11,81 | 0,6573 | -0,2002 | |||
| ABBV / AbbVie Inc. | 0,00 | 0,00 | 0,83 | -11,36 | 0,6385 | -0,1905 | |||
| RTX / RTX Corporation | 0,01 | 0,00 | 0,78 | 10,24 | 0,5985 | -0,0260 | |||
| ED / Consolidated Edison, Inc. | 0,01 | 0,00 | 0,77 | -9,20 | 0,5944 | -0,1591 | |||
| WMT / Walmart Inc. | 0,01 | 0,00 | 0,76 | 11,40 | 0,5884 | -0,0193 | |||
| GOOG / Alphabet Inc. | 0,00 | 0,00 | 0,72 | 13,50 | 0,5586 | -0,0073 | |||
| DFAC / Dimensional ETF Trust - Dimensional U.S. Core Equity 2 ETF | 0,02 | 0,00 | 0,71 | 8,74 | 0,5473 | -0,0322 | |||
| MAA / Mid-America Apartment Communities, Inc. | 0,00 | -7,77 | 0,70 | -18,56 | 0,5425 | -0,2236 | |||
| AMZN / Amazon.com, Inc. | 0,00 | 3,26 | 0,70 | 19,01 | 0,5371 | 0,0182 | |||
| BMY / Bristol-Myers Squibb Company | 0,01 | 7,01 | 0,69 | -18,80 | 0,5338 | -0,2222 | |||
| HON / Honeywell International Inc. | 0,00 | 0,00 | 0,61 | 9,84 | 0,4745 | -0,0218 | |||
| ZS / Zscaler, Inc. | 0,00 | 0,00 | 0,60 | 58,58 | 0,4640 | 0,1267 | |||
| MO / Altria Group, Inc. | 0,01 | 0,00 | 0,57 | -2,42 | 0,4366 | -0,0775 | |||
| TT / Trane Technologies plc | 0,00 | 0,00 | 0,52 | 29,70 | 0,4051 | 0,0462 | |||
| BA / The Boeing Company | 0,00 | -3,90 | 0,49 | 18,07 | 0,3787 | 0,0097 | |||
| MCD / McDonald's Corporation | 0,00 | 0,00 | 0,49 | -6,33 | 0,3768 | -0,0866 | |||
| PG / The Procter & Gamble Company | 0,00 | 0,00 | 0,48 | -6,45 | 0,3700 | -0,0853 | |||
| T / AT&T Inc. | 0,02 | -1,21 | 0,47 | 1,08 | 0,3634 | -0,0501 | |||
| ORCL / Oracle Corporation | 0,00 | 0,00 | 0,46 | 56,42 | 0,3577 | 0,0946 | |||
| CVX / Chevron Corporation | 0,00 | 0,00 | 0,45 | -14,48 | 0,3470 | -0,1193 | |||
| GS / The Goldman Sachs Group, Inc. | 0,00 | 0,00 | 0,45 | 29,36 | 0,3441 | 0,0386 | |||
| WM / Waste Management, Inc. | 0,00 | 0,00 | 0,43 | -1,15 | 0,3304 | -0,0541 | |||
| COP / ConocoPhillips | 0,00 | -2,20 | 0,40 | -16,39 | 0,3075 | -0,1158 | |||
| PFE / Pfizer Inc. | 0,02 | -0,63 | 0,38 | -4,99 | 0,2948 | -0,0619 | |||
| WELL / Welltower Inc. | 0,00 | 0,00 | 0,38 | 0,27 | 0,2907 | -0,0426 | |||
| QBTS / D-Wave Quantum Inc. | 0,02 | 2,29 | 0,36 | 96,72 | 0,2784 | 0,1159 | |||
| KO / The Coca-Cola Company | 0,01 | 0,00 | 0,36 | -1,11 | 0,2759 | -0,0454 | |||
| VRT / Vertiv Holdings Co | 0,00 | 0,33 | 0,2527 | 0,2527 | |||||
| GE / General Electric Company | 0,00 | 0,00 | 0,33 | 28,85 | 0,2519 | 0,0266 | |||
| SNOW / Snowflake Inc. | 0,00 | -37,11 | 0,32 | -3,93 | 0,2461 | -0,0479 | |||
| FDX / FedEx Corporation | 0,00 | 0,00 | 0,32 | -6,80 | 0,2439 | -0,0570 | |||
| PEP / PepsiCo, Inc. | 0,00 | 0,00 | 0,31 | -11,85 | 0,2358 | -0,0722 | |||
| GLW / Corning Incorporated | 0,01 | 0,00 | 0,30 | 15,12 | 0,2293 | -0,0003 | |||
| TXN / Texas Instruments Incorporated | 0,00 | 0,00 | 0,29 | 15,54 | 0,2243 | 0,0010 | |||
| LMT / Lockheed Martin Corporation | 0,00 | -1,57 | 0,29 | 2,12 | 0,2234 | -0,0284 | |||
| IP / International Paper Company | 0,01 | 0,00 | 0,27 | -12,18 | 0,2120 | -0,0658 | |||
| GMED / Globus Medical, Inc. | 0,00 | -7,81 | 0,26 | -25,64 | 0,2016 | -0,1104 | |||
| VLO / Valero Energy Corporation | 0,00 | -4,96 | 0,26 | -3,38 | 0,1987 | -0,0376 | |||
| NSC / Norfolk Southern Corporation | 0,00 | 0,00 | 0,26 | 8,05 | 0,1976 | -0,0127 | |||
| QCOM / QUALCOMM Incorporated | 0,00 | 0,00 | 0,25 | 3,70 | 0,1951 | -0,0214 | |||
| WMB / The Williams Companies, Inc. | 0,00 | -5,87 | 0,25 | -1,18 | 0,1944 | -0,0316 | |||
| DUK / Duke Energy Corporation | 0,00 | 0,00 | 0,25 | -3,54 | 0,1898 | -0,0359 | |||
| SBUX / Starbucks Corporation | 0,00 | 0,00 | 0,24 | -6,51 | 0,1886 | -0,0436 | |||
| TRV / The Travelers Companies, Inc. | 0,00 | 0,00 | 0,23 | 1,32 | 0,1776 | -0,0243 | |||
| ARM / Arm Holdings plc - Depositary Receipt (Common Stock) | 0,00 | 0,23 | 0,1760 | 0,1760 | |||||
| FI / Fiserv, Inc. | 0,00 | 0,00 | 0,22 | -21,83 | 0,1714 | -0,0811 | |||
| FHN / First Horizon Corporation | 0,01 | 0,00 | 0,22 | 9,05 | 0,1678 | -0,0090 | |||
| UNH / UnitedHealth Group Incorporated | 0,00 | 0,00 | 0,21 | -40,40 | 0,1606 | -0,1495 | |||
| UI / Ubiquiti Inc. | 0,00 | 0,21 | 0,1589 | 0,1589 | |||||
| SYK / Stryker Corporation | 0,00 | 0,20 | 0,1557 | 0,1557 | |||||
| ALL / The Allstate Corporation | 0,00 | 0,00 | 0,20 | -2,90 | 0,1554 | -0,0285 | |||
| XOM / Exxon Mobil Corporation | 0,00 | 0,00 | 0,20 | -9,46 | 0,1553 | -0,0418 | |||
| RGTI / Rigetti Computing, Inc. | 0,01 | 0,00 | 0,16 | 49,52 | 0,1217 | 0,0282 | |||
| LUMN / Lumen Technologies, Inc. | 0,02 | -14,92 | 0,08 | -4,94 | 0,0597 | -0,0126 | |||
| BEAT / HeartBeam, Inc. | 0,01 | 0,00 | 0,01 | -40,00 | 0,0096 | -0,0082 | |||
| TLH / iShares Trust - iShares 10-20 Year Treasury Bond ETF | 0,00 | -100,00 | 0,00 | 0,0000 | |||||
| IEF / iShares Trust - iShares 7-10 Year Treasury Bond ETF | 0,00 | -100,00 | 0,00 | 0,0000 | |||||
| NEA / Nuveen AMT-Free Quality Municipal Income Fund | 0,00 | -100,00 | 0,00 | 0,0000 | |||||
| EWG / iShares, Inc. - iShares MSCI Germany ETF | 0,00 | -100,00 | 0,00 | 0,0000 | |||||
| IEV / iShares Trust - iShares Europe ETF | 0,00 | -100,00 | 0,00 | 0,0000 |