Grundlæggende statistik
| Institutionelle ejere | 754 total, 744 long only, 0 short only, 10 long/short - change of -17,93% MRQ |
| Gennemsnitlig porteføljeallokering | 0.7478 % - change of -13,05% MRQ |
| Institutionelle aktier (lange) | 686.417.126 (ex 13D/G) - change of -41,44MM shares -5,69% MRQ |
| Institutionel værdi (lang) | $ 24.831.722 USD ($1000) |
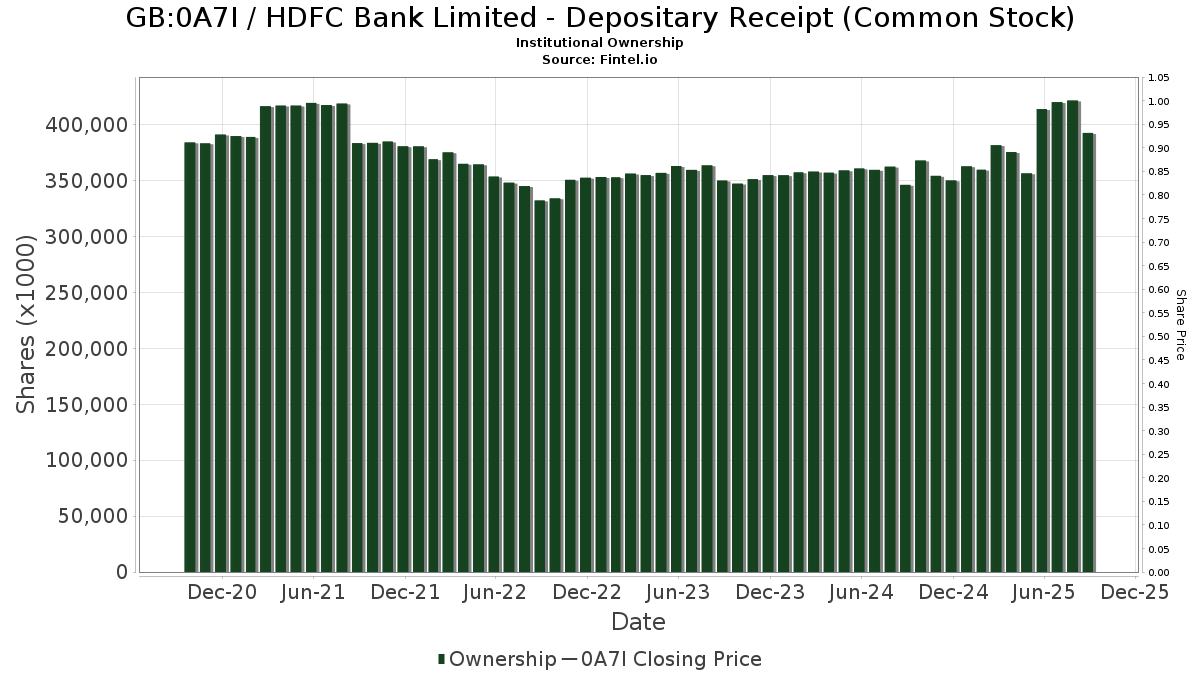
Institutionelt ejerskab og aktionærer
HDFC Bank Limited - Depositary Receipt (Common Stock) (GB:0A7I) har 754 institutionelle ejere og aktionærer, der har indsendt 13D/G- eller 13F-formularer til Securities Exchange Commission (SEC). Disse institutioner har i alt 686,417,126 aktier. Største aktionærer omfatter GQG Partners LLC, Royal Bank Of Canada, Schroder Investment Management Group, Harding Loevner Lp, FIL Ltd, Morgan Stanley, Jpmorgan Chase & Co, Franklin Resources Inc, Fmr Llc, and Lazard Asset Management Llc .
HDFC Bank Limited - Depositary Receipt (Common Stock) (LSE:0A7I) institutionel ejerskabsstruktur viser aktuelle positioner i virksomheden efter institutioner og fonde, samt seneste ændringer i positionsstørrelse. Større aktionærer kan omfatte individuelle investorer, investeringsforeninger, hedgefonde eller institutioner. Skema 13D angiver, at investoren besidder (eller besidder) mere end 5 % af virksomheden og har til hensigt (eller har til hensigt at) aktivt at forfølge en ændring i forretningsstrategi. Skema 13G indikerer en passiv investering på over 5%.
The share price as of December 23, 2025 is 36,27 / share. Previously, on March 11, 2025, the share price was 58,98 / share. This represents a decline of 38,51% over that period.
Fondens stemningsscore
Fund Sentiment Score (fka Ownership Accumulation Score) finder de aktier, der bliver mest købt af fonde. Det er resultatet af en sofistikeret, multi-faktor kvantitativ model, der identificerer virksomheder med de højeste niveauer af institutionel akkumulering. Scoringsmodellen bruger en kombination af den samlede stigning i oplyste ejere, ændringerne i porteføljeallokeringer i disse ejere og andre målinger. Tallet går fra 0 til 100, hvor højere tal indikerer et højere niveau af akkumulering for sine jævnaldrende, og 50 er gennemsnittet.
Opdateringsfrekvens: Dagligt
Se Ownership Explorer, som giver en liste over højest rangerende virksomheder.
AI+ Ask Fintel’s AI assistant about HDFC Bank Limited - Depositary Receipt (Common Stock).
Select a question to share a public post with an AI-crafted answer.
Thinking of good questions…
13F og NPORT arkivering
Detaljer om 13F-arkivering er gratis. Detaljer om NP-ansøgninger kræver et premium-medlemskab. Grønne rækker angiver nye positioner. Røde rækker angiver lukkede positioner. Klik på linket ikon for at se den fulde transaktionshistorik.
Opgrader
for at låse premium-data op og eksportere til Excel ![]() .
.
Important Note
In an effort to reduce load times for our mobile users, we are testing some ways to deliver lighter pages.
In this first test, we will deliver only the most recent 750 transactions (out of 915 for this stock). If you are interested in loading *all* the transactions for this company, click the "load all" button below. This is just a test and if you don't like it, please let us know by submitting some gentle feedback via the link at the bottom of this page.
Load All| Fil dato | Kilde | Investor | Type | Gennemsnitlig pris (Øst) |
Aktier | Δ Aktier (%) |
Rapporteret Værdi ($1000) |
Δ Værdi (%) |
Port Alloc (%) |
|
|---|---|---|---|---|---|---|---|---|---|---|
| 2025-09-26 | NP | FFGX - Fidelity Fundamental Global ex-U.S. ETF | 7.861 | 1,12 | 603 | 6,73 | ||||
| 2026-02-13 | 13F | Marshall Wace, Llp | 0 | -100,00 | 0 | |||||
| 2026-02-17 | 13F | Summit Global Investments | 35.323 | -36,69 | 1 | 0,00 | ||||
| 2025-09-25 | NP | DFAE - Dimensional Emerging Core Equity Market ETF | 532.736 | 6,98 | 40.898 | 12,99 | ||||
| 2026-02-06 | 13F | FourThought Financial Partners, LLC | 24.058 | 3,22 | 879 | 10,43 | ||||
| 2026-02-17 | 13F | Glenmede Trust Co Na | 11.667 | 98,72 | 426 | 9,23 | ||||
| 2026-02-19 | 13F | Invesco Ltd. | 12.196.148 | -1,15 | 445.647 | 5,74 | ||||
| 2026-02-17 | 13F | Susquehanna International Group, Llp | Put | 37.600 | -53,81 | 1.374 | -50,61 | |||
| 2026-02-17 | 13F | Susquehanna International Group, Llp | Call | 88.200 | 121,61 | 3.223 | 137,09 | |||
| 2026-02-11 | 13F | Janney Montgomery Scott LLC | 16.958 | 15,35 | 1 | |||||
| 2026-02-17 | 13F | Susquehanna International Group, Llp | 75.536 | 471,12 | 2.760 | 511,97 | ||||
| 2025-09-25 | NP | DFSE - Dimensional Emerging Markets Sustainability Core 1 ETF | 20.575 | 0,00 | 1.580 | 5,62 | ||||
| 2026-02-03 | 13F | Crossmark Global Holdings, Inc. | 121.732 | -0,85 | 4.448 | 6,06 | ||||
| 2026-01-26 | 13F | Foster Victor Wealth Advisors, LLC | 12.328 | 109,34 | 402 | 100,00 | ||||
| 2025-11-12 | 13F | Transce3nd, LLC | 0 | -100,00 | 0 | -100,00 | ||||
| 2025-11-07 | 13F | Advisors Capital Management, LLC | 0 | -100,00 | 0 | -100,00 | ||||
| 2026-01-20 | 13F | Perpetual Ltd | 2.229.755 | 0,13 | 81.475 | 7,10 | ||||
| 2026-02-17 | 13F | Lazard Asset Management Llc | 12.478.341 | 8,73 | 455.959 | 16,30 | ||||
| 2025-09-26 | NP | FSSGX - Fidelity SAI Sustainable Emerging Markets Equity Fund | 4.537 | 0,00 | 348 | 5,78 | ||||
| 2026-02-13 | 13F | JustInvest LLC | 187.064 | 19,77 | 6.835 | 28,12 | ||||
| 2026-02-13 | 13F | Colony Group, LLC | 18.610 | 26,11 | 680 | 35,19 | ||||
| 2026-02-12 | 13F | Commonwealth Equity Services, Llc | 18.906 | -13,62 | 691 | |||||
| 2026-02-13 | 13F | Causeway Capital Management Llc | 422.279 | 9,63 | 15.430 | 17,28 | ||||
| 2026-02-02 | 13F | CENTRAL TRUST Co | 4 | 0 | ||||||
| 2026-02-05 | 13F | iA Global Asset Management Inc. | 15.654 | 0,00 | 1 | |||||
| 2026-01-14 | 13F | Cooper Investors Pty Ltd | 0 | -100,00 | 0 | |||||
| 2026-02-10 | 13F | Guardcap Asset Management Ltd | 126.900 | -1,32 | 4.637 | 5,56 | ||||
| 2025-11-14 | 13F | Binnacle Investments Inc | 680 | 100,00 | 23 | -11,54 | ||||
| 2026-02-11 | 13F | LPL Financial LLC | 125.640 | -45,02 | 4.591 | -41,20 | ||||
| 2026-02-06 | 13F | Leonteq Securities AG | 41.751 | -16,37 | 1.526 | -10,56 | ||||
| 2026-02-17 | 13F | GAM Holding AG | 70.457 | -38,80 | 2.574 | -34,54 | ||||
| 2026-02-13 | 13F | Parkside Financial Bank & Trust | 913 | 0,00 | 33 | 6,45 | ||||
| 2026-02-17 | 13F | Fmr Llc | 12.860.281 | -19,09 | 469.915 | -13,46 | ||||
| 2026-02-11 | 13F | Cerity Partners LLC | 117.883 | -15,52 | 4.307 | -9,63 | ||||
| 2026-02-12 | 13F | Advisors Asset Management, Inc. | 72.734 | 5,00 | 2.658 | 12,30 | ||||
| 2026-02-13 | 13F | NLB Skladi, upravljanje premozenja, d.o.o. | 85.065 | 3.108 | ||||||
| 2026-01-12 | 13F | Salem Investment Counselors Inc | 0 | -100,00 | 0 | |||||
| 2026-01-16 | 13F | Piscataqua Savings Bank | 60 | 2 | ||||||
| 2026-02-05 | 13F | Tucker Asset Management Llc | 40 | 1 | ||||||
| 2026-02-17 | 13F | Brevan Howard Capital Management LP | 66.616 | -3,28 | 2.428 | 3,76 | ||||
| 2026-02-13 | 13F | Walleye Trading LLC | Put | 3.000 | -58,33 | 110 | -55,51 | |||
| 2026-02-10 | 13F | Daiwa Securities Group Inc. | 86.274 | 9,37 | 3 | 50,00 | ||||
| 2026-02-13 | 13F/A | Alberta Investment Management Corp | 0 | -100,00 | 0 | |||||
| 2026-02-17 | 13F | Oaktree Fund Advisors, LLC | 128.863 | -5,17 | 4.709 | 1,44 | ||||
| 2025-09-25 | NP | INDAX - ALPS/Kotak India Growth Fund Investor Shares | 51.000 | 0,00 | 3.915 | 5,61 | ||||
| 2026-02-12 | 13F | DJE Kapital AG | 1.692.753 | 23,88 | 61.963 | -40,45 | ||||
| 2026-02-17 | 13F | Grantham, Mayo, Van Otterloo & Co. LLC | 0 | -100,00 | 0 | |||||
| 2026-01-20 | 13F | Toth Financial Advisory Corp | 2 | 0 | ||||||
| 2026-02-05 | 13F | Elyxium Wealth, LLC | 566 | 21 | ||||||
| 2026-02-12 | 13F | Dividend Asset Capital, Llc | 9.290 | 0,00 | 339 | 6,94 | ||||
| 2026-01-29 | 13F | State Of Michigan Retirement System | 595.200 | 32,68 | 21.749 | 41,92 | ||||
| 2026-01-14 | 13F | Nova Wealth Management, Inc. | 0 | -100,00 | 0 | |||||
| 2026-01-27 | 13F | Regions Financial Corp | 32.333 | 0,67 | 1.181 | 7,66 | ||||
| 2025-09-26 | NP | TIIEX - TIAA-CREF International Equity Fund Institutional Class | 386.724 | -5,02 | 29.689 | 0,31 | ||||
| 2026-02-13 | 13F | Morgan Stanley | 21.690.727 | -2,49 | 792.579 | 4,30 | ||||
| 2026-02-10 | 13F | Sustainable Growth Advisers, LP | 5.710.975 | -47,68 | 208.679 | -44,03 | ||||
| 2026-01-26 | 13F | Sather Financial Group Inc | 20.754 | 0,61 | 758 | 7,67 | ||||
| 2026-01-27 | 13F | Ninety One UK Ltd | 1.492.417 | 6,66 | 54.533 | 14,09 | ||||
| 2026-02-17 | 13F | Mercer Global Advisors Inc /adv | 28.276 | 10,09 | 1.033 | 17,79 | ||||
| 2026-02-13 | 13F | L1 Capital Pty Ltd | 503.481 | 18.397 | ||||||
| 2026-02-09 | 13F | Atlantic Trust, LLC | 0 | -100,00 | 0 | |||||
| 2026-01-23 | 13F | Robeco Institutional Asset Management B.V. | 12.392.854 | 6,82 | 452.835 | 14,26 | ||||
| 2026-02-17 | 13F | Orbis Allan Gray Ltd | 700.833 | -7,42 | 25.608 | -0,96 | ||||
| 2026-02-11 | 13F | Group One Trading, L.p. | Call | 44.600 | -1,55 | 1.630 | 5,30 | |||
| 2026-02-13 | 13F | Walleye Trading LLC | Call | 3.900 | -65,79 | 143 | -63,50 | |||
| 2025-11-07 | 13F | Synovus Financial Corp | 45.290 | 95,34 | 1.547 | -12,94 | ||||
| 2026-02-11 | 13F | Group One Trading, L.p. | Put | 86.100 | 11,96 | 3.146 | 19,80 | |||
| 2026-02-13 | 13F | Walleye Trading LLC | 64.521 | -78,15 | 2.358 | -76,63 | ||||
| 2026-02-11 | 13F | Group One Trading, L.p. | 18.041 | -34,20 | 659 | -29,59 | ||||
| 2026-02-02 | 13F | Aikya Investment Management Ltd | 4.729.768 | 9,26 | 172.826 | 16,88 | ||||
| 2026-02-09 | 13F | Nicola Wealth Management Ltd. | 403.000 | 29,17 | 14.726 | 38,17 | ||||
| 2026-02-12 | 13F | Hollencrest Capital Management | 4.242 | 0,00 | 155 | 7,64 | ||||
| 2026-02-03 | 13F | Harel Insurance Investments & Financial Services Ltd. | 15.422 | -13,71 | 1 | |||||
| 2026-02-09 | 13F | Coldstream Capital Management Inc | 22.927 | -31,69 | 838 | -26,96 | ||||
| 2025-11-14 | 13F | Wetherby Asset Management Inc | 66.852 | 83,17 | 2.284 | -18,41 | ||||
| 2025-11-19 | 13F/A | Danske Bank A/s | 0 | 0 | ||||||
| 2026-02-10 | 13F | Westwood Global Investments, LLC | 787.941 | 0,13 | 28.791 | 7,10 | ||||
| 2026-02-06 | 13F | Marathon Asset Mgmt Ltd | 973.218 | 10,73 | 35.561 | 18,44 | ||||
| 2026-01-07 | 13F | Harbor Investment Advisory, Llc | 362 | 5,85 | 13 | 18,18 | ||||
| 2026-01-30 | 13F | Keybank National Association/oh | 69.699 | -1,44 | 2.547 | 5,42 | ||||
| 2026-02-13 | 13F | Itau Unibanco Holding S.A. | 614 | 22 | ||||||
| 2026-02-12 | 13F | Loomis Sayles & Co L P | 5.975 | -95,10 | 218 | -94,76 | ||||
| 2026-02-13 | 13F | BNP Paribas Asset Management Holding S.A. | 294.668 | 11 | ||||||
| 2026-02-17 | 13F | Sender Co & Partners, Inc. | Call | 0 | -100,00 | 0 | ||||
| 2026-01-23 | 13F | Sumitomo Mitsui Trust Holdings, Inc. | 3.219.373 | -0,53 | 117.636 | 6,40 | ||||
| 2026-02-13 | 13F | Acumen Wealth Advisors, LLC | 192 | 7 | ||||||
| 2026-02-17 | 13F | EFG International AG | 109.119 | 3.987 | ||||||
| 2026-01-14 | 13F | Generali Investments CEE, investicni spolecnost, a.s. | 177.418 | -8,35 | 6.483 | -1,97 | ||||
| 2026-02-09 | 13F | Fisher Asset Management, LLC | 11.850.762 | 29,20 | 433.027 | 38,20 | ||||
| 2026-01-27 | 13F | WealthCollab, LLC | 242 | 0,00 | 9 | 0,00 | ||||
| 2026-02-12 | 13F | Greenfield Seitz Capital Management, LLC | 107.557 | -3,52 | 3.930 | 3,20 | ||||
| 2026-02-13 | 13F | FORA Capital, LLC | 0 | -100,00 | 0 | |||||
| 2026-02-06 | 13F | Envestnet Portfolio Solutions, Inc. | 9.350 | -21,10 | 342 | -15,59 | ||||
| 2025-09-25 | NP | JNBAX - JPMorgan Income Builder Fund Class A | 7.750 | 0,00 | 595 | 5,51 | ||||
| 2026-02-13 | 13F | Cornerstone Financial Management LLC | 338 | 12 | ||||||
| 2026-01-15 | 13F | Boit C F David | 3.100 | 0,00 | 103 | -2,86 | ||||
| 2025-11-12 | 13F | Creekmur Asset Management LLC | 145 | 98,63 | 5 | -20,00 | ||||
| 2026-02-13 | 13F | Charles-Lim Capital Ltd | 2.225.000 | 11,25 | 81.302 | 19,00 | ||||
| 2026-02-10 | 13F | Bruce G. Allen Investments, LLC | 2.083 | 54,30 | 76 | 65,22 | ||||
| 2026-02-11 | 13F | Axiom International Investors Llc /de | 214.700 | -5,83 | 7.845 | 0,73 | ||||
| 2025-09-26 | NP | JDIBX - John Hancock Disciplined Value International Fund Class A | 1.062.103 | 81.538 | ||||||
| 2026-02-17 | 13F | Aqr Capital Management Llc | 256.011 | 99,54 | 9.355 | 114,15 | ||||
| 2026-02-04 | 13F | Schwartz Investment Counsel Inc | 100.100 | 0,00 | 3.658 | 6,96 | ||||
| 2026-02-11 | 13F | Fox Run Management, L.l.c. | 14.702 | 537 | ||||||
| 2026-02-04 | 13F | C WorldWide Group Holding A/S | 7.505.340 | -19,84 | 274 | -14,11 | ||||
| 2026-01-20 | 13F | Independence Bank of Kentucky | 600 | 0,00 | 22 | 5,00 | ||||
| 2026-02-13 | 13F | Virtus ETF Advisers LLC | 93.098 | -1,70 | 3.402 | 5,13 | ||||
| 2025-09-29 | NP | AWWIX - CIBC ATLAS INTERNATIONAL GROWTH FUND Institutional Class Shares | 315.690 | 4,23 | 24.236 | 10,08 | ||||
| 2026-02-11 | 13F | Explore Capital Management, LLC | 97.060 | -67,52 | 3.547 | -65,27 | ||||
| 2026-01-30 | 13F | Exencial Wealth Advisors, Llc | 48.555 | 4,97 | 1.774 | 12,28 | ||||
| 2026-02-03 | 13F | D.B. Root & Company, LLC | 0 | -100,00 | 0 | |||||
| 2026-02-04 | 13F | ABN AMRO Bank N.V. | 24.000 | 0,00 | 874 | 6,85 | ||||
| 2025-10-22 | 13F | Motco | 0 | -100,00 | 0 | -100,00 | ||||
| 2026-02-06 | 13F | Diamond Hill Capital Management Inc | 158.056 | 0,00 | 5.775 | 6,96 | ||||
| 2025-11-03 | 13F | Townsquare Capital Llc | 0 | -100,00 | 0 | -100,00 | ||||
| 2026-02-13 | 13F | Van Eck Associates Corp | 261.809 | 16,04 | 10 | 28,57 | ||||
| 2026-01-16 | 13F | Banque Pictet & Cie Sa | 228.910 | -15,25 | 8.364 | -9,34 | ||||
| 2026-01-12 | 13F | Roble, Belko & Company, Inc | 496 | 0,00 | 0 | |||||
| 2025-09-25 | NP | abrdn Funds - abrdn Emerging Markets Dividend Active ETF | 52.700 | -6,35 | 4.046 | -1,10 | ||||
| 2025-11-13 | 13F | Renaissance Technologies Llc | 0 | -100,00 | 0 | -100,00 | ||||
| 2026-02-20 | 13F | Kovitz Investment Group Partners, LLC | 31.513 | 2,96 | 1.152 | 10,14 | ||||
| 2026-02-17 | 13F | Northern Trust Corp | 1.693.980 | -2,80 | 61.898 | 3,97 | ||||
| 2025-09-25 | NP | VMMSX - Vanguard Emerging Markets Select Stock Fund Investor Shares | 34.033 | -16,56 | 2.613 | -11,88 | ||||
| 2026-02-12 | 13F | Benson Wealth Management INC | 168 | 6 | ||||||
| 2025-09-26 | NP | FEMYX - Fidelity Series Sustainable Emerging Markets Fund | 4.020 | 33,16 | 309 | 40,64 | ||||
| 2026-02-17 | 13F | LMR Partners LLP | 0 | -100,00 | 0 | |||||
| 2026-02-11 | 13F | Buckingham Strategic Partners | 20.450 | -10,44 | 747 | -5,44 | ||||
| 2025-09-25 | NP | HFIGX - Hartford Schroders Diversified Growth Fund Class I | 2.410 | 11,37 | 185 | 17,83 | ||||
| 2026-01-20 | 13F | Signaturefd, Llc | 44.652 | -0,25 | 1.632 | 6,67 | ||||
| 2026-01-13 | 13F | Matrix Trust Co | 31.490 | 10,47 | 1 | |||||
| 2026-02-13 | 13F | Macquarie Group Ltd | 0 | -100,00 | 0 | |||||
| 2026-02-13 | 13F | Nfj Investment Group, Llc | 0 | -100,00 | 0 | |||||
| 2026-02-14 | 13F | Militia Capital Partners, LP | 30.244 | 115,35 | 1.105 | 130,69 | ||||
| 2026-02-12 | 13F | Campbell & CO Investment Adviser LLC | 0 | -100,00 | 0 | |||||
| 2026-02-11 | 13F | West Family Investments, Inc. | 49.139 | -4,43 | 1.796 | 2,22 | ||||
| 2025-09-29 | NP | Calamos Global Dynamic Income Fund | 9.576 | -22,74 | 735 | -18,33 | ||||
| 2026-02-12 | 13F | Lansforsakringar Fondforvaltning AB (publ) | 67.904 | 6,79 | 2.481 | 14,23 | ||||
| 2026-02-17 | 13F | Two Sigma Investments, Lp | 533.992 | -72,97 | 19.512 | -71,09 | ||||
| 2025-09-22 | NP | TISLX - Transamerica International Sustainable Equity R6 | 2.228 | 0,00 | 171 | 6,21 | ||||
| 2026-01-29 | 13F | Matthews International Capital Management Llc | 343.916 | 58,29 | 12.567 | 69,33 | ||||
| 2025-09-25 | NP | TIER - T. Rowe Price International Equity Research ETF | 725 | 56 | ||||||
| 2026-02-12 | 13F | JPL Wealth Management, LLC | 0 | -100,00 | 0 | |||||
| 2026-02-06 | 13F | IFP Advisors, Inc | 18.351 | 0,02 | 671 | 7,03 | ||||
| 2026-02-10 | 13F | Peapack Gladstone Financial Corp | 6.067 | -48,13 | 0 | |||||
| 2026-01-30 | 13F | ARGA Investment Management, LP | 1.053.708 | 0,00 | 38.502 | 6,97 | ||||
| 2026-02-09 | 13F | Frazier Financial Advisors, LLC | 546 | 0,00 | 20 | 5,56 | ||||
| 2026-01-29 | 13F | UMA Financial Services, Inc. | 1.203 | -22,49 | 44 | -18,87 | ||||
| 2026-02-17 | 13F | Clear Street Markets Llc | 533 | 19 | ||||||
| 2025-09-29 | NP | CNGLX - Commonwealth Global Fund | 8.000 | 0,00 | 614 | 5,68 | ||||
| 2026-02-13 | 13F | Neuberger Berman Group LLC | 446.942 | -0,95 | 16.325 | 5,92 | ||||
| 2026-01-22 | 13F | Trinity Street Asset Management LLP | 6.067.000 | -1,09 | 221.688 | 5,81 | ||||
| 2026-02-17 | 13F | Man Group plc | 4.550.345 | 12.615,43 | 166.270 | 13.506,30 | ||||
| 2026-02-12 | 13F | Mount Yale Investment Advisors, LLC | 26.813 | 151,88 | 980 | 169,70 | ||||
| 2026-02-13 | 13F | Sands Capital Management, Llc | 6.117.362 | -1,19 | 223.528 | 5,70 | ||||
| 2026-02-12 | 13F | Keel Point, LLC | 6.542 | -0,17 | 239 | 7,17 | ||||
| 2026-01-16 | 13F | First Pacific Financial | 0 | -100,00 | 0 | |||||
| 2026-01-22 | 13F | Personal Cfo Solutions, Llc | 6.403 | 3,02 | 234 | 9,91 | ||||
| 2026-02-13 | 13F | Toroso Investments, LLC | 19.782 | 0,00 | 723 | 6,96 | ||||
| 2026-02-17 | 13F | Old Mission Capital Llc | 50.982 | 1.863 | ||||||
| 2026-02-12 | 13F | BlackRock, Inc. | 6.464.490 | 16,74 | 236.212 | 24,87 | ||||
| 2026-01-06 | 13F | Nelson, Van Denburg & Campbell Wealth Management Group, LLC | 8.515 | -0,11 | 311 | 6,87 | ||||
| 2025-11-14 | 13F | Blue Capital, Inc. | 0 | -100,00 | 0 | -100,00 | ||||
| 2026-02-11 | 13F | Kontiki Capital Management (HK) Ltd. | 7.362.626 | -0,76 | 269.030 | 6,15 | ||||
| 2026-02-13 | 13F | Citigroup Inc | 462.911 | -74,86 | 16.915 | -73,11 | ||||
| 2026-02-17 | 13F | Scientech Research LLC | 0 | -100,00 | 0 | |||||
| 2025-09-26 | NP | EPIN - Harbor International Equity ETF | 920 | 71 | ||||||
| 2026-02-03 | 13F | Mitsubishi UFJ Kokusai Asset Management Co., Ltd. | 0 | -100,00 | 0 | |||||
| 2025-09-23 | NP | IEMGX - Voya Multi-Manager Emerging Markets Equity Fund Class I | 53.805 | 0,00 | 4.131 | 5,60 | ||||
| 2026-02-12 | 13F | Barings Llc | 682.813 | 14,59 | 24.950 | 22,58 | ||||
| 2026-01-23 | 13F | BSW Wealth Partners | 7.866 | -2,92 | 287 | 3,99 | ||||
| 2026-02-17 | 13F | D. E. Shaw & Co., Inc. | 8.162 | -14,75 | 298 | -8,87 | ||||
| 2026-01-29 | 13F | Vanguard Group Inc | 522.874 | 0,42 | 19.106 | 7,42 | ||||
| 2026-02-10 | 13F | Triglav Skladi, D.o.o. | 60.770 | 24,02 | 2.221 | 32,70 | ||||
| 2026-02-17 | 13F | Price T Rowe Associates Inc /md/ | 1.047.088 | -7,00 | 38 | 0,00 | ||||
| 2026-02-18 | 13F | Mackenzie Financial Corp | 1.954.635 | 6,24 | 71.087 | 13,11 | ||||
| 2026-02-13 | 13F | Public Employees Retirement Association Of Colorado | 1.288.840 | 0,00 | 47 | 6,82 | ||||
| 2026-02-02 | 13F | One Wealth Advisors, LLC | 27.295 | -0,49 | 997 | 6,52 | ||||
| 2025-11-06 | 13F | Blume Capital Management, Inc. | 0 | -100,00 | 0 | |||||
| 2026-02-17 | 13F | HighVista Strategies LLC | 22.127 | -32,30 | 809 | -27,60 | ||||
| 2026-02-10 | 13F | Westpac Banking Corp | 6.412 | -2,76 | 234 | 4,00 | ||||
| 2025-09-26 | NP | FBCG - Fidelity Blue Chip Growth ETF This fund is a listed as child fund of Fmr Llc and if that institution has disclosed ownership in this security, then these positions will not be double counted when calculating total shares and total value | 62.753 | 3,25 | 4.818 | 9,06 | ||||
| 2026-02-13 | 13F | Aviso Financial Inc. | 0 | -100,00 | 0 | |||||
| 2026-02-17 | 13F | Guggenheim Capital Llc | 91.693 | 1,75 | 3.350 | 8,84 | ||||
| 2026-02-13 | 13F | MayTech Global Investments, LLC | 356.320 | -0,06 | 13.020 | 6,92 | ||||
| 2026-02-17 | 13F | Shelton Capital Management | 24.990 | 22,56 | 913 | 31,18 | ||||
| 2026-02-17 | 13F | Snowden Capital Advisors LLC | 11.556 | 2,14 | 422 | 9,33 | ||||
| 2026-02-17 | 13F | Creative Planning | 123.507 | -6,28 | 4.513 | 0,24 | ||||
| 2026-02-11 | 13F | Fiera Capital Corp | 8.514.965 | -7,66 | 311.137 | -1,23 | ||||
| 2025-09-26 | NP | FCPAX - Fidelity Advisor International Capital Appreciation Fund Class A This fund is a listed as child fund of Fmr Llc and if that institution has disclosed ownership in this security, then these positions will not be double counted when calculating total shares and total value | 18.334 | 1.408 | ||||||
| 2025-09-24 | NP | EMQAX - Ashmore Emerging Markets Active Equity Fund CLASS A | 7.711 | -49,69 | 592 | -46,95 | ||||
| 2026-02-14 | 13F | Frec Markets, Inc. | 15.447 | 564 | ||||||
| 2026-02-10 | 13F | Fideuram Asset Management (Ireland) dac | 11.508 | 660 | ||||||
| 2025-09-23 | NP | FCGPX - MainStay PineStone Global Equity Fund Class P | 9.685 | -14,93 | 744 | -10,16 | ||||
| 2025-09-25 | NP | DVRAX - MFS Global Alternative Strategy Fund A | 5.461 | 17,37 | 419 | 23,96 | ||||
| 2025-09-24 | NP | EMFIX - Ashmore Emerging Markets Equity Fund INSTITUTIONAL CLASS | 103.583 | 5,18 | 7.952 | 11,09 | ||||
| 2025-09-26 | NP | FBGRX - Fidelity Blue Chip Growth Fund This fund is a listed as child fund of Fmr Llc and if that institution has disclosed ownership in this security, then these positions will not be double counted when calculating total shares and total value | 464.410 | 13,49 | 35.653 | 19,86 | ||||
| 2026-01-23 | 13F | Tectonic Advisors Llc | 9.812 | -1,44 | 359 | 5,29 | ||||
| 2026-01-26 | 13F | JNBA Financial Advisors | 34 | 1 | ||||||
| 2026-02-17 | 13F | Signature Equity Partners, LLC | 35 | 1 | ||||||
| 2025-09-23 | NP | VVIFX - Voya VACS Series EME Fund | 69.122 | -8,47 | 5.306 | -3,33 | ||||
| 2026-02-09 | 13F | William Blair Investment Management, Llc | 338.403 | -23,01 | 12.364 | -17,66 | ||||
| 2025-09-25 | NP | VTRIX - Vanguard International Value Fund Investor Shares This fund is a listed as child fund of Vanguard Group Inc and if that institution has disclosed ownership in this security, then these positions will not be double counted when calculating total shares and total value | 1.035.244 | 70,65 | 79.476 | 80,22 | ||||
| 2026-02-17 | 13F | Tower Research Capital LLC (TRC) | 0 | -100,00 | 0 | |||||
| 2025-09-26 | NP | RINYX - International Developed Markets Fund Class Y | 99.811 | 0,00 | 7.662 | 5,61 | ||||
| 2026-02-06 | 13F | Handelsbanken Fonder AB | 39.815 | 44,78 | 1 | |||||
| 2026-02-12 | 13F | DRW Securities, LLC | 0 | -100,00 | 0 | |||||
| 2025-09-26 | NP | FBCGX - Fidelity Blue Chip Growth K6 Fund This fund is a listed as child fund of Fmr Llc and if that institution has disclosed ownership in this security, then these positions will not be double counted when calculating total shares and total value | 103.921 | 11,77 | 7.978 | 18,05 | ||||
| 2026-01-14 | 13F | Baron Wealth Management LLC | 6.446 | 0,00 | 236 | 6,82 | ||||
| 2026-02-17 | 13F | Ninepoint Partners LP | 15.219 | 86,26 | 556 | 99,28 | ||||
| 2026-02-13 | 13F | Templeton & Phillips Capital Management, LLC | 0 | -100,00 | 0 | |||||
| 2025-10-30 | 13F | Twin Peaks Wealth Advisors, LLC | 0 | -100,00 | 0 | -100,00 | ||||
| 2026-02-17 | 13F | Raymond James Financial Inc | 926.476 | 6,90 | 33.853 | 14,35 | ||||
| 2026-02-04 | 13F | Aubrey Capital Management Ltd | 32.345 | 5,23 | 1.180 | 12,49 | ||||
| 2026-02-13 | 13F | Level Four Advisory Services, Llc | 15.851 | 0,80 | 579 | 7,82 | ||||
| 2026-02-13 | 13F | Mariner, LLC | 148.473 | 6,77 | 5.423 | 14,15 | ||||
| 2026-02-13 | 13F | Castlefield Investment Partners LLP | 339 | 5.492 | ||||||
| 2026-01-23 | 13F | Altfest L J & Co Inc | 24.600 | 253,65 | 899 | 278,90 | ||||
| 2026-01-09 | 13F | Assenagon Asset Management S.A. | 0 | -100,00 | 0 | -100,00 | ||||
| 2026-01-08 | 13F | Tuttle Tactical Management LLC | 18.980 | 694 | ||||||
| 2026-02-12 | 13F | Colonial Trust Co / SC | 92 | 3 | ||||||
| 2026-02-12 | 13F | Integrated Quantitative Investments LLC | 30.794 | -6,02 | 1.125 | 0,54 | ||||
| 2026-01-13 | 13F | Mather Group, Llc. | 6.412 | 0,44 | 234 | 7,34 | ||||
| 2026-02-05 | 13F | Center for Financial Planning, Inc. | 202 | 0,00 | 7 | 16,67 | ||||
| 2026-02-13 | 13F | Y-Intercept (Hong Kong) Ltd | 33.404 | 1.221 | ||||||
| 2025-10-15 | 13F | Brookstone Capital Management | 0 | -100,00 | 0 | -100,00 | ||||
| 2026-02-09 | 13F | Endowment Wealth Management, Inc. | 10.489 | -10,30 | 383 | -4,01 | ||||
| 2025-09-26 | NP | MSTFX - Morningstar International Equity Fund | 127.729 | 0,27 | 9.806 | 5,90 | ||||
| 2025-09-23 | NP | EXOSX - Overseas Series Class I | 154.695 | 0,00 | 11.876 | 5,61 | ||||
| 2026-02-02 | 13F | Truist Financial Corp | 61.697 | -8,54 | 2.254 | -2,17 | ||||
| 2026-02-12 | 13F/A | Pinebridge Investments Llc | 1.197.800 | 43.768 | ||||||
| 2025-09-29 | NP | Calamos Global Total Return Fund | 2.780 | -20,23 | 213 | -15,81 | ||||
| 2026-02-06 | 13F | Creative Financial Designs Inc /adv | 0 | -100,00 | 0 | |||||
| 2026-02-05 | 13F | Atria Investments Llc | 69.337 | -6,29 | 2.534 | 0,24 | ||||
| 2026-02-10 | 13F | Commonwealth Of Pennsylvania Public School Empls Retrmt Sys | 576.635 | 14,84 | 21.070 | 22,85 | ||||
| 2025-10-07 | 13F | Thurston, Springer, Miller, Herd & Titak, Inc. | 0 | -100,00 | 0 | -100,00 | ||||
| 2025-11-14 | 13F | PineBridge Investments, L.P. | 1.197.800 | 100,00 | 40.917 | -10,89 | ||||
| 2026-02-17 | 13F | Cresset Asset Management, LLC | 25.013 | -9,33 | 914 | -3,08 | ||||
| 2026-02-14 | 13F | Whipplewood Advisors, LLC | 18 | 1 | ||||||
| 2026-02-17 | 13F | FIL Ltd | 23.312.525 | -4,71 | 851.840 | 1,93 | ||||
| 2026-02-04 | 13F | Advisor OS, LLC | 11.559 | 11,93 | 422 | 19,89 | ||||
| 2025-09-26 | NP | FSUMX - Fidelity Series Sustainable U.S. Market Fund | 340 | 21,00 | 26 | 30,00 | ||||
| 2026-01-28 | 13F | Oversea-Chinese Banking CORP Ltd | 356.588 | 97,30 | 13.027 | 111,07 | ||||
| 2026-01-08 | 13F | Sarasin & Partners LLP | 50.732 | -10,07 | 1.854 | -3,74 | ||||
| 2026-01-08 | 13F | Adirondack Trust Co | 172 | 6 | ||||||
| 2026-02-11 | 13F | CenterBook Partners LP | 17.210 | 629 | ||||||
| 2025-09-25 | NP | IUAEX - JPMorgan International Unconstrained Equity Fund Class A | 598.810 | 0,00 | 45.971 | 5,61 | ||||
| 2026-02-17 | 13F | Quadrature Capital Ltd | 124.826 | 109,87 | 4.561 | 124,57 | ||||
| 2026-01-22 | 13F | Financial Consulate, Inc | 54 | 2 | ||||||
| 2026-01-12 | 13F | Foster Group, Inc. | 6.207 | -4,86 | 227 | 1,80 | ||||
| 2026-02-11 | 13F | Jpmorgan Chase & Co | 20.504.634 | 6,77 | 749.239 | 14,21 | ||||
| 2026-01-29 | 13F | Inscription Capital, LLC | 6.857 | 2,77 | 251 | 10,13 | ||||
| 2025-11-14 | 13F | AXA Investment Managers S.A. | 294.668 | 10.066 | ||||||
| 2026-01-21 | 13F | Naviter Wealth, LLC | 69.184 | -17,90 | 2.528 | -12,20 | ||||
| 2026-01-14 | 13F | Jfs Wealth Advisors, Llc | 2.050 | -4,38 | 75 | 1,37 | ||||
| 2026-01-29 | 13F | Rakuten Securities, Inc. | 647 | 71,16 | 24 | 91,67 | ||||
| 2026-01-23 | 13F | Gibbs Wealth Management | 14.221 | -14,74 | 471 | -17,40 | ||||
| 2026-02-12 | 13F | Xponance, Inc. | 8.451 | -0,81 | 309 | 5,84 | ||||
| 2026-01-21 | 13F | Yousif Capital Management, Llc | 29.262 | -22,16 | 946 | -26,32 | ||||
| 2026-02-17 | 13F | Cetera Investment Advisers | 140.247 | -14,55 | 5.125 | -8,60 | ||||
| 2026-02-13 | 13F | Pinnacle Wealth Planning Services, Inc. | 7.042 | 4,68 | 257 | 12,23 | ||||
| 2026-02-12 | 13F | Steward Partners Investment Advisory, Llc | 5.527 | 1,73 | 202 | 8,65 | ||||
| 2026-02-17 | 13F | Steadfast Capital Management Lp | 2.842.300 | 16,37 | 103.858 | 24,48 | ||||
| 2026-01-15 | 13F | Allspring Global Investments Holdings, LLC | 2.204.370 | -3,51 | 80.415 | 4,14 | ||||
| 2026-02-06 | 13F | Vestmark Advisory Solutions, Inc. | 195.493 | 246,20 | 7.143 | 270,49 | ||||
| 2026-02-11 | 13F | Allianz Asset Management GmbH | 954.255 | 135,82 | 34.868 | 152,26 | ||||
| 2025-10-28 | 13F | Country Trust Bank | 0 | -100,00 | 0 | -100,00 | ||||
| 2025-11-04 | 13F | Penserra Capital Management LLC | 0 | -100,00 | 0 | |||||
| 2026-01-21 | 13F | SJS Investment Consulting Inc. | 192 | 7 | ||||||
| 2026-02-17 | 13F | Credit Agricole S A | 19.974 | 0,00 | 730 | 6,89 | ||||
| 2026-01-30 | 13F | State of New Jersey Common Pension Fund D | 2.384.413 | 0,64 | 87.126 | 7,65 | ||||
| 2026-02-02 | 13F | Fifth Third Bancorp | 110.464 | -1,48 | 4.036 | 5,38 | ||||
| 2026-01-23 | 13F | DHJJ Financial Advisors, Ltd. | 102 | 0,00 | 4 | 0,00 | ||||
| 2026-02-13 | 13F | Kestra Advisory Services, LLC | 0 | -100,00 | 0 | |||||
| 2025-09-25 | NP | WRAAX - Wilmington Global Alpha Equities Fund Class A Shares | 22.048 | 0,78 | 1.693 | 6,42 | ||||
| 2026-02-10 | 13F | Channing Global Advisors, Llc | 179.616 | 1,25 | 6.563 | 8,32 | ||||
| 2026-01-23 | 13F | Assetmark, Inc | 6.268 | 51,99 | 229 | 63,57 | ||||
| 2026-02-13 | 13F | State Street Corp | 3.117.515 | 1,23 | 113.914 | 8,29 | ||||
| 2026-02-10 | 13F | Eurizon SLJ Capital Ltd | 37.310 | 1.363 | ||||||
| 2025-09-29 | NP | GTDDX - INVESCO Developing Markets Fund Class A | 861.538 | 6,93 | 66.140 | 12,93 | ||||
| 2026-02-11 | 13F | Ovata Capital Management Ltd | 277.332 | 10.022 | ||||||
| 2026-01-29 | 13F | Munich Reinsurance Co Stock Corp in Munich | 222.218 | 0,00 | 8.098 | 6,68 | ||||
| 2025-09-22 | NP | GSIHX - Goldman Sachs GQG Partners International Opportunities Fund Class A Shares | 7.437.704 | 0,00 | 570.993 | 5,61 | ||||
| 2025-09-26 | NP | HNICX - Harbor International Compounders Fund Retirement Class | 38.112 | 1,04 | 2.926 | 6,71 | ||||
| 2026-02-06 | 13F | Hardy Reed LLC | 9.526 | 5,88 | 348 | 13,36 | ||||
| 2026-02-12 | 13F | Dundas Partners LLP | 883.744 | 2,27 | 32.292 | 9,40 | ||||
| 2026-03-04 | 13F | SHP Wealth Management | 163 | 6 | ||||||
| 2026-01-22 | 13F | CCLA Investment Management Ltd | 4.286.185 | -1,52 | 157 | 5,41 | ||||
| 2025-09-25 | NP | GAOAX - JPMorgan Global Allocation Fund Class A | 82.322 | 8,04 | 6.320 | 14,10 | ||||
| 2025-09-26 | NP | RAZAX - Multi-Asset Growth Strategy Fund Class A | 5.012 | 0,00 | 385 | 5,49 | ||||
| 2026-02-10 | 13F | Murphy & Mullick Capital Management Corp | 13.006 | -4,09 | 475 | 2,59 | ||||
| 2026-02-09 | 13F | Morningstar Investment Management LLC | 0 | -100,00 | 0 | |||||
| 2026-01-28 | 13F | Geneos Wealth Management Inc. | 74 | 0,00 | 3 | 0,00 | ||||
| 2026-01-28 | 13F | Legacy Capital Group California, Inc. | 11.194 | 8,77 | 409 | 16,52 | ||||
| 2026-01-30 | 13F | Rachor Investment Advisory Services, LLC | 71 | 3 | ||||||
| 2025-09-25 | NP | EMGAX - Wells Fargo Emerging Markets Equity Fund Class A | 140.209 | -16,15 | 10.764 | -11,44 | ||||
| 2026-01-16 | 13F | Crewe Advisors LLC | 138 | 97,14 | 5 | 150,00 | ||||
| 2026-01-26 | 13F | Mirae Asset Global Investments Co., Ltd. | 1.139.300 | 1,56 | 41.630 | 8,64 | ||||
| 2026-02-10 | 13F | Bnp Paribas Arbitrage, Sa | 188.624 | -68,16 | 6.892 | -65,94 | ||||
| 2026-01-05 | 13F | Roxbury Financial LLC | 1.163 | 0,09 | 43 | 7,69 | ||||
| 2026-02-17 | 13F | Henry James International Management Inc. | 83.354 | -0,16 | 3.046 | 6,80 | ||||
| 2026-01-28 | 13F | Migdal Insurance & Financial Holdings Ltd. | 19.948 | -27,32 | 1 | |||||
| 2025-11-12 | 13F | Foresight Global Investors, Inc. | 0 | -100,00 | 0 | -100,00 | ||||
| 2026-01-15 | 13F | Nisa Investment Advisors, Llc | 29.982 | 2,02 | 1.096 | 9,17 | ||||
| 2026-02-12 | 13F | Polen Capital Management Llc | 0 | -100,00 | 0 | |||||
| 2026-02-17 | 13F | Zurich Insurance Group Ltd/FI | 375.539 | 1,11 | 13.722 | 8,16 | ||||
| 2026-02-12 | 13F | Insigneo Advisory Services, Llc | 5.819 | 213 | ||||||
| 2026-02-17 | 13F | Hood River Capital Management LLC | 395 | 14 | ||||||
| 2026-02-13 | 13F | Squarepoint Ops LLC | 15.311 | -55,01 | 559 | -51,89 | ||||
| 2025-10-09 | 13F | Dynamic Advisor Solutions LLC | 0 | -100,00 | 0 | -100,00 | ||||
| 2026-02-03 | 13F | Washington Trust Advisors, Inc. | 460 | 0,00 | 17 | 6,67 | ||||
| 2026-02-13 | 13F | Transamerica Financial Advisors, Inc. | 530 | 19 | ||||||
| 2026-01-21 | 13F | Portside Wealth Group, LLC | 7.809 | -16,19 | 285 | -10,38 | ||||
| 2026-02-02 | 13F | CX Institutional | 422 | 9,33 | 0 | |||||
| 2026-02-09 | 13F | Freemont Capital Pte Ltd | 0 | -100,00 | 0 | |||||
| 2026-01-30 | 13F | Us Bancorp \de\ | 200.983 | -6,03 | 7.344 | 0,52 | ||||
| 2026-02-13 | 13F | Pinpoint Asset Management (Singapore) Pte. Ltd. | 0 | -100,00 | 0 | |||||
| 2026-01-05 | 13F | GAMMA Investing LLC | 11.139 | 4,26 | 407 | 11,81 | ||||
| 2025-09-26 | NP | PCEMX - PACE International Emerging Markets Equity Investments Class P | 43.979 | 0,00 | 3.376 | 5,63 | ||||
| 2026-02-13 | 13F | Schroder Investment Management Group | 26.264.726 | 4,14 | 959.713 | 11,39 | ||||
| 2026-02-13 | 13F | Thornburg Investment Management Inc | 15.533 | -6,44 | 568 | 0,00 | ||||
| 2025-09-26 | NP | HLMGX - Harding Loevner Global Equity Portfolio Advisor | 103.302 | 0,00 | 7.930 | 5,61 | ||||
| 2026-02-11 | 13F | Parallel Advisors, LLC | 8.037 | -10,37 | 294 | -4,25 | ||||
| 2026-02-17 | 13F | Two Creeks Capital Management, LP | 743.331 | 0,87 | 27.161 | 7,90 | ||||
| 2026-02-13 | 13F | Grandeur Peak Global Advisors, LLC | 27.108 | 0,00 | 991 | 6,91 | ||||
| 2026-02-17 | 13F | Alliancebernstein L.p. | 190.743 | -14,00 | 6.970 | -8,01 | ||||
| 2026-02-17 | 13F | Two Sigma Advisers, Lp | 6.200 | -99,19 | 227 | -99,13 | ||||
| 2025-11-14 | 13F | Sompo Japan Nipponkoa Asset Management Co.,ltd. | 0 | -100,00 | 0 | -100,00 | ||||
| 2026-02-12 | 13F | Dimensional Fund Advisors Lp | 2.898.433 | 0,07 | 105.909 | 7,05 | ||||
| 2026-02-04 | 13F | Western Pacific Wealth Management, LP | 2.134 | 0,00 | 78 | 6,94 | ||||
| 2026-01-08 | 13F | Grove Bank & Trust | 3.762 | -1,36 | 137 | 5,38 | ||||
| 2026-02-12 | 13F | Nuveen, LLC | 2.569.478 | -5,48 | 93.889 | 1,10 | ||||
| 2025-09-26 | NP | AIIEX - INVESCO International Growth Fund Class A | 733.812 | -1,00 | 56.335 | 4,56 | ||||
| 2025-11-14 | 13F | Capula Management Ltd | 0 | -100,00 | 0 | -100,00 | ||||
| 2026-01-22 | 13F | Maseco Llp | 2 | 0,00 | 0 | |||||
| 2026-01-29 | 13F | Sanctuary Advisors, LLC | 59.761 | 14,53 | 2.184 | 22,50 | ||||
| 2026-01-23 | 13F | Westside Investment Management, Inc. | 466 | 30,17 | 17 | 41,67 | ||||
| 2026-02-10 | 13F | Natixis Advisors, L.p. | 5.179.690 | 3,62 | 189 | 11,18 | ||||
| 2026-01-28 | 13F | Salomon & Ludwin, LLC | 8 | 0,00 | 0 | |||||
| 2026-02-10 | 13F | Connor, Clark & Lunn Investment Management Ltd. | 3.836.544 | 57,77 | 140.187 | 68,76 | ||||
| 2026-02-09 | 13F | Kingsview Wealth Management, LLC | 5.691 | 208 | ||||||
| 2026-02-17 | 13F | Hilltop Holdings Inc. | 6.588 | -2,40 | 241 | 4,35 | ||||
| 2026-03-02 | 13F | Tobam | 69.316 | 0,70 | 3 | 0,00 | ||||
| 2026-01-26 | 13F | PDS Planning, Inc | 37.993 | 1,79 | 1.388 | 8,95 | ||||
| 2025-09-26 | NP | RMYAX - Multi-Strategy Income Fund Class A | 11.129 | 19,64 | 854 | 26,33 | ||||
| 2026-02-17 | 13F | Quantinno Capital Management LP | 314.276 | 70,25 | 11.484 | 82,13 | ||||
| 2026-02-10 | 13F | Bnp Paribas | 357.729 | 9,50 | 13.072 | 17,12 | ||||
| 2026-02-13 | 13F | Wealth Alliance | 23.896 | -4,67 | 873 | 1,99 | ||||
| 2026-01-28 | 13F | Eagle Global Advisors Llc | 129.797 | -1,21 | 4.743 | 5,66 | ||||
| 2026-02-12 | 13F | CIBC Private Wealth Group, LLC | 2.671.173 | 3,89 | 97.605 | 11,13 | ||||
| 2026-02-18 | 13F/A | Empowered Funds, LLC | 45.639 | 1.668 | ||||||
| 2026-02-14 | 13F | Rockefeller Capital Management L.P. | 44.117 | -59,94 | 1.612 | -57,15 | ||||
| 2026-02-13 | 13F | 1832 Asset Management L.P. | 5.730.427 | 158,93 | 209.390 | 176,97 | ||||
| 2026-02-17 | 13F | Breakout Capital Partners, LP | 493.371 | 18.028 | ||||||
| 2026-01-22 | 13F | Venturi Wealth Management, LLC | 16.804 | 614 | ||||||
| 2026-02-17 | 13F | Valiant Capital Management, L.P. | 1.122.032 | 5,71 | 40.999 | 13,08 | ||||
| 2026-01-21 | 13F | Flagship Harbor Advisors, Llc | 146 | 5 | ||||||
| 2026-02-17 | 13F | Janus Henderson Group Plc | 1.448.107 | -38,87 | 52.907 | -34,59 | ||||
| 2025-11-10 | 13F | Cary Street Partner Investment Advisory Llc | 0 | -100,00 | 0 | -100,00 | ||||
| 2025-11-06 | 13F | Wealthstream Advisors, Inc. | 12.099 | 118,28 | 413 | -2,59 | ||||
| 2025-09-25 | NP | BBHLX - BBH Partner Fund - International Equity Class I Shares | 507.800 | -13,49 | 38.984 | -8,64 | ||||
| 2026-02-09 | 13F | Genus Capital Management Inc. | 20.504 | 0,00 | 749 | 7,00 | ||||
| 2025-09-26 | NP | SUNAMERICA SERIES TRUST - SA T. Rowe Price Asset Allocation Growth Portfolio Class 1 | 11.187 | -4,69 | 859 | 0,59 | ||||
| 2026-02-13 | 13F | Royal London Asset Management Ltd | 4.709.766 | -2,21 | 172.095 | 4,60 | ||||
| 2026-02-10 | 13F | Td Asset Management Inc | 26.866 | 1,61 | 982 | 8,64 | ||||
| 2026-02-04 | 13F | Mirabaud Asset Management Ltd | 8.766 | 532 | ||||||
| 2026-02-17 | 13F | Balyasny Asset Management Llc | 140.075 | 680,71 | 5.118 | 736,27 | ||||
| 2026-02-17 | 13F | Private Advisor Group, LLC | 14.949 | 7,75 | 546 | 15,43 | ||||
| 2026-01-23 | 13F | Rsm Us Wealth Management Llc | 49.097 | -20,26 | 1.789 | -14,93 | ||||
| 2025-10-31 | 13F | Whittier Trust Co Of Nevada Inc | 0 | -100,00 | 0 | -100,00 | ||||
| 2026-02-06 | 13F/A | Rathbone Brothers plc | 2.585.814 | 3,83 | 94.486 | 11,06 | ||||
| 2025-10-31 | 13F | BCJ Capital Management, LLC | 0 | -100,00 | 0 | -100,00 | ||||
| 2026-02-13 | 13F | GQG Partners LLC | 52.962.709 | 1,49 | 1.935.258 | 8,56 | ||||
| 2026-02-17 | 13F | Ameriprise Financial Inc | 5.380.545 | -11,28 | 196.957 | -4,91 | ||||
| 2026-01-22 | 13F | Massachusetts Financial Services Co /ma/ | 10.266.396 | 0,56 | 375.134 | 7,57 | ||||
| 2026-02-17 | 13F | XTX Topco Ltd | 29.638 | -17,63 | 1.083 | -11,96 | ||||
| 2025-09-26 | NP | EDIAX - Eaton Vance Global Income Builder Fund Class A | 10.268 | 9,16 | 788 | 15,37 | ||||
| 2026-02-13 | 13F | Pathstone Holdings, LLC | 159.941 | 6,15 | 5.920 | 13,26 | ||||
| 2026-02-17 | 13F | Temasek Holdings (Private) Ltd | 10.873.380 | 0,00 | 397.313 | 6,97 | ||||
| 2026-02-17 | 13F | Public Employees Retirement System Of Ohio | 1.873.530 | 9,99 | 68.459 | 17,65 | ||||
| 2026-02-17 | 13F | Blair William & Co/il | 19.497 | -3,59 | 712 | 3,19 | ||||
| 2026-02-02 | 13F | Cornerstone Planning Group LLC | 334 | 0,00 | 11 | -16,67 | ||||
| 2026-02-23 | 13F | Beaird Harris Wealth Management, LLC | 9 | 0,00 | 0 | |||||
| 2026-01-23 | 13F | Deprince Race & Zollo Inc | 329.567 | -0,27 | 12.042 | 6,68 | ||||
| 2026-01-07 | 13F | Retirement Wealth Solutions LLC | 102 | 0,00 | 4 | 0,00 | ||||
| 2026-01-12 | 13F | Abound Wealth Management | 431 | -34,30 | 16 | -31,82 | ||||
| 2026-01-29 | 13F | Impax Asset Management Group plc | 1.695.445 | 0,48 | 61.952 | 7,48 | ||||
| 2025-11-04 | 13F | High Note Wealth, LLC | 0 | -100,00 | 0 | |||||
| 2026-02-17 | 13F | Bamco Inc /ny/ | 111.871 | 4,24 | 4.088 | 11,48 | ||||
| 2026-02-11 | 13F | Dorsey & Whitney Trust CO LLC | 7.467 | -21,73 | 273 | -16,31 | ||||
| 2026-01-07 | 13F | Harbour Capital Advisors, LLC | 14.106 | 0,04 | 515 | 4,47 | ||||
| 2026-01-21 | 13F | Aaron Wealth Advisors LLC | 30.030 | 38,35 | 1.097 | 48,04 | ||||
| 2025-09-26 | NP | HLIDX - International Developed Markets Equity Portfolio Institutional Class | 13.378 | -5,50 | 1.027 | -0,10 | ||||
| 2026-02-13 | 13F | Pin Oak Investment Advisors Inc | 932 | -6,43 | 0 | -100,00 | ||||
| 2026-02-17 | 13F | Schonfeld Strategic Advisors LLC | 18.099 | 661 | ||||||
| 2026-01-08 | 13F | True Wealth Design, LLC | 510 | 661,19 | 19 | 800,00 | ||||
| 2026-02-13 | 13F | Avanda Investment Management Pte. Ltd. | 0 | -100,00 | 0 | |||||
| 2026-01-12 | 13F | Legacy Wealth Asset Management, LLC | 61.527 | 0,43 | 2.248 | 7,46 | ||||
| 2026-01-13 | 13F | Kathmere Capital Management, LLC | 12.061 | 30,23 | 441 | 39,24 | ||||
| 2026-02-05 | 13F | ANTIPODES PARTNERS Ltd | 312.679 | 11,07 | 11.426 | 18,82 | ||||
| 2026-01-28 | 13F | DekaBank Deutsche Girozentrale | 301.487 | 0,00 | 19 | 90,00 | ||||
| 2026-02-06 | 13F | HighTower Advisors, LLC | 418.636 | 4,13 | 15.297 | 11,39 | ||||
| 2026-02-13 | 13F | Stifel Financial Corp | 170.175 | -1,28 | 6.218 | 5,60 | ||||
| 2025-11-14 | 13F | Indus Capital Partners, Llc | 0 | -100,00 | 0 | -100,00 | ||||
| 2026-02-03 | 13F | Alpha Cubed Investments, LLC | 5.570 | 204 | ||||||
| 2026-02-06 | 13F | Banque Cantonale Vaudoise | 56.292 | 0,00 | 2.057 | 205.600,00 | ||||
| 2026-02-11 | 13F | OneAscent Investment Solutions LLC | 28.031 | 0,00 | 1.024 | 7,00 | ||||
| 2026-02-17 | 13F | Veritas Asset Management LLP | 224.364 | 0,00 | 8.198 | 6,97 | ||||
| 2025-09-23 | NP | FCIRX - MainStay PineStone International Equity Fund Class A | 237.718 | 6,64 | 18.250 | 12,63 | ||||
| 2026-01-23 | 13F | Bridgewater Advisors Inc. | 17.013 | -3,52 | 547 | -13,20 | ||||
| 2026-02-17 | 13F | Discovery Capital Management, Llc / Ct | 755.600 | 0,00 | 27.610 | 6,97 | ||||
| 2025-11-13 | 13F | Artemis Investment Management LLP | 0 | -100,00 | 0 | -100,00 | ||||
| 2026-02-09 | 13F | Legal & General Group Plc | 1.097.416 | -11,68 | 40.094 | -5,50 | ||||
| 2026-01-08 | 13F | Value Partners Investments Inc. | 294.084 | 0,00 | 10.747 | 7,04 | ||||
| 2026-02-11 | 13F | Erste Asset Management GmbH | 0 | 0 | ||||||
| 2026-02-11 | 13F | Financiere des Professionnels - Fonds d,investissement inc. | 337.619 | -2,80 | 12.337 | 3,97 | ||||
| 2026-02-24 | 13F | DGS Capital Management, LLC | 10.178 | -0,37 | 372 | 6,61 | ||||
| 2026-02-05 | 13F | LGT Group Foundation | 206.385 | 30,01 | 7.521 | 40,17 | ||||
| 2026-02-17 | 13F | Driehaus Capital Management Llc | 3.722.331 | 16,13 | 136.014 | 24,22 | ||||
| 2026-02-05 | 13F | Bessemer Group Inc | 3.520.543 | 17,98 | 129 | 26,73 | ||||
| 2026-02-13 | 13F | PCM Encore, LLC | 49.941 | 1.825 | ||||||
| 2025-11-07 | 13F | Sierra Ocean, Llc | 0 | -100,00 | 0 | -100,00 | ||||
| 2025-09-24 | NP | SNTKX - Steward International Enhanced Index Fund Class A | 52.972 | 21,90 | 4.067 | 28,75 | ||||
| 2025-11-14 | 13F | Integrity Alliance, Llc. | 0 | -100,00 | 0 | -100,00 | ||||
| 2026-01-22 | 13F | Pinnacle Bancorp, Inc. | 1.694 | 0,00 | 62 | 7,02 | ||||
| 2026-01-23 | 13F | Hardman Johnston Global Advisors LLC | 4.428.563 | 3,72 | 161.820 | 10,95 | ||||
| 2025-11-12 | 13F | Journey Strategic Wealth Llc | 0 | -100,00 | 0 | -100,00 | ||||
| 2026-02-11 | 13F | Gordian Capital Singapore Pte Ltd | 9.800 | 0,00 | 358 | 7,19 | ||||
| 2025-09-26 | NP | HLMIX - Harding Loevner International Equity Portfolio Institutional | 5.577.710 | -4,30 | 428.201 | 1,07 | ||||
| 2025-11-04 | 13F | Guerra Advisors Inc | 0 | 0 | ||||||
| 2026-02-11 | 13F | Nemes Rush Group LLC | 59 | 2 | ||||||
| 2026-02-13 | 13F | Baird Financial Group, Inc. | 2.587.809 | 7,47 | 94.559 | 14,96 | ||||
| 2026-02-17 | 13F | Elliott Investment Management L.P. | 216.756 | 7.920 | ||||||
| 2026-02-12 | 13F | Jane Street Group, Llc | Call | 8.000 | -90,07 | 292 | -89,39 | |||
| 2026-02-10 | 13F | MJT & Associates Financial Advisory Group, Inc. | 0 | -100,00 | 0 | |||||
| 2026-02-12 | 13F | Jane Street Group, Llc | 38.020 | -96,33 | 1.389 | -96,08 | ||||
| 2026-02-12 | 13F | Jane Street Group, Llc | Put | 93.200 | -7,17 | 3.406 | -0,70 | |||
| 2026-01-26 | 13F | Cwm, Llc | 9.439 | 15,63 | 0 | |||||
| 2026-02-17 | 13F | Engineers Gate Manager LP | 0 | -100,00 | 0 | |||||
| 2026-02-17 | 13F | Laird Norton Trust Company, Llc | 119.401 | 4.363 | ||||||
| 2026-02-12 | 13F | Rossby Financial, LCC | 130 | 0,00 | 5 | 0,00 | ||||
| 2026-02-12 | 13F | Skopos Labs, Inc. | 194.498 | 585,60 | 7.068 | 223,48 | ||||
| 2026-02-12 | 13F | Bank Of Montreal /can/ | 139.505 | 0,73 | 5.098 | 7,76 | ||||
| 2026-02-12 | 13F | Triumph Capital Management | 246 | 89,23 | 9 | 100,00 | ||||
| 2026-01-07 | 13F | Central Pacific Bank - Trust Division | 758 | 0,00 | 28 | 8,00 | ||||
| 2026-01-16 | 13F | Standard Life Aberdeen plc | 1.517.149 | 35,36 | 55.437 | 45,24 | ||||
| 2026-02-13 | 13F | Mml Investors Services, Llc | 95.029 | 4,15 | 3.472 | 11,42 | ||||
| 2026-02-18 | 13F | EP Wealth Advisors, Inc. | 12.618 | 245,41 | 461 | 64,64 | ||||
| 2026-02-12 | 13F | Sustainable Insight Capital Management, LLC | 14.098 | 15,58 | 515 | 23,80 | ||||
| 2026-02-17 | 13F | Pinnacle Financial Partners, Inc. | 44.359 | 1.621 | ||||||
| 2026-02-02 | 13F | Kornitzer Capital Management Inc /ks | 140.000 | 0,00 | 5.116 | 6,96 | ||||
| 2026-02-09 | 13F | Hantz Financial Services, Inc. | 221.185 | 15,14 | 8 | 33,33 | ||||
| 2026-02-10 | 13F | Goldman Sachs Group Inc | 1.225.762 | -20,81 | 44.789 | -15,29 | ||||
| 2026-01-23 | 13F | Farther Finance Advisors, LLC | 14.278 | 58,13 | 522 | 69,16 | ||||
| 2026-01-16 | 13F | Pictet North America Advisors SA | 16.928 | 0,00 | 619 | 6,92 | ||||
| 2025-09-25 | NP | SCVEX - Hartford Schroders International Stock Fund Class A | 2.494.170 | 5,91 | 191.477 | 11,85 | ||||
| 2026-02-04 | 13F | Naples Global Advisors, Llc | 60.848 | 0,45 | 2.223 | 7,44 | ||||
| 2026-02-13 | 13F | Flow Traders U.s. Llc | 11.395 | 0 | ||||||
| 2026-02-03 | 13F | Manning & Napier Advisors Llc | 464.815 | -86,59 | 16.984 | -85,66 | ||||
| 2026-02-09 | 13F | Mondrian Investment Partners LTD | 1.365.044 | 42,34 | 49.879 | 52,25 | ||||
| 2025-09-26 | NP | FSYMX - Fidelity Sustainable International Equity Fund Fidelity Advisor Sustainable International Equity Fund: Class M | 976 | 1,67 | 75 | 7,25 | ||||
| 2026-02-12 | 13F | Ratan Capital Management LP | 13.000 | 0,00 | 475 | 6,98 | ||||
| 2025-11-14 | 13F | Zurcher Kantonalbank (Zurich Cantonalbank) | 0 | -100,00 | 0 | -100,00 | ||||
| 2026-01-15 | 13F | Highline Wealth Partners Llc | 626 | -7,12 | 23 | -4,35 | ||||
| 2026-02-11 | 13F | Capital International Sarl | 41.648 | 0,00 | 1.522 | 6,96 | ||||
| 2026-02-12 | 13F | Canopy Partners, LLC | 9.416 | 1,32 | 344 | 8,52 | ||||
| 2025-09-25 | NP | CBSE - Clough Select Equity ETF | 9.225 | -3,88 | 708 | 1,58 | ||||
| 2026-01-08 | 13F | Wealth Enhancement Advisory Services, Llc | 22.558 | 4,99 | 754 | 0,53 | ||||
| 2026-02-26 | 13F | TD Capital Management LLC | 280 | 0,00 | 10 | 11,11 | ||||
| 2026-02-11 | 13F | J.Safra Asset Management Corp | 3.334 | 226,86 | 122 | 255,88 | ||||
| 2026-02-13 | 13F | SPX Equities Gestao de Recursos Ltda | 0 | -100,00 | 0 | |||||
| 2026-02-17 | 13F | SageView Advisory Group, LLC | 910 | 33 | ||||||
| 2026-02-17 | 13F | Gilder Gagnon Howe & Co Llc | 473.474 | -32,15 | 17.301 | -27,42 | ||||
| 2025-09-26 | NP | FSBDX - Fidelity Series Blue Chip Growth Fund This fund is a listed as child fund of Fmr Llc and if that institution has disclosed ownership in this security, then these positions will not be double counted when calculating total shares and total value | 86.000 | 13,16 | 6.602 | 19,51 | ||||
| 2026-02-17 | 13F | DZ BANK AG Deutsche Zentral Genossenschafts Bank, Frankfurt am Main | 263.620 | 38,80 | 9.633 | 48,48 | ||||
| 2026-01-26 | 13F | Merit Financial Group, LLC | 6.621 | 1,55 | 242 | 8,56 | ||||
| 2026-01-26 | 13F | SeaBridge Investment Advisors LLC | 8.878 | 3,33 | 324 | 10,58 | ||||
| 2025-11-10 | 13F | Marshall & Sterling Wealth Advisors Inc. | 0 | -100,00 | 0 | -100,00 | ||||
| 2026-02-11 | 13F | Winton Capital Group Ltd | 50.700 | 0,00 | 1.853 | 6,99 | ||||
| 2025-09-24 | NP | BlackRock ETF Trust - BlackRock International Dividend ETF | 359.972 | 0,00 | 27.635 | 5,61 | ||||
| 2026-02-13 | 13F | Storgate, LLC | 14.129 | 516 | ||||||
| 2026-02-13 | 13F | American Century Companies Inc | 2.300.827 | -35,20 | 84.072 | -30,69 | ||||
| 2026-01-15 | 13F | StonePine Asset Management Inc. | 8.315.726 | 1,86 | 303.857 | 8,96 | ||||
| 2026-02-10 | 13F | CIBC World Markets Inc. | 16.914 | -73,21 | 618 | -71,34 | ||||
| 2026-02-09 | 13F | Hartland & Co., LLC | 550 | -38,48 | 20 | -33,33 | ||||
| 2026-02-11 | 13F | Vise Technologies, Inc. | 350.265 | 1,59 | 12.799 | 8,67 | ||||
| 2026-02-10 | 13F | CIBC Asset Management Inc | 687.171 | -7,66 | 25.016 | -1,25 | ||||
| 2026-01-08 | 13F | Armstrong Advisory Group, Inc | 48 | 0,00 | 2 | 0,00 | ||||
| 2026-01-20 | 13F | Arta Finance Wealth Management LLC | 17.227 | 629 | ||||||
| 2025-09-25 | NP | VMNVX - Vanguard Global Minimum Volatility Fund Admiral Shares | 254.955 | -5,99 | 19.573 | -0,72 | ||||
| 2026-02-12 | 13F | Comgest Global Investors S.a.s. | 502.014 | -7,32 | 18.344 | -0,86 | ||||
| 2026-01-15 | 13F | Lodestone Wealth Management LLC | 292 | 11 | ||||||
| 2026-02-09 | 13F | Smithfield Trust Co | 86 | 0 | ||||||
| 2025-09-29 | NP | ASIAX - INVESCO Asia Pacific Growth Fund Class A | 237.525 | -16,25 | 18.235 | -11,55 | ||||
| 2026-01-26 | 13F | Private Trust Co Na | 346 | 0,00 | 13 | 9,09 | ||||
| 2026-01-21 | 13F | Figure 8 Investment Strategies Llc | 48.510 | 0,83 | 1.773 | 7,85 | ||||
| 2026-01-26 | 13F | KBC Group NV | 319.002 | 0,00 | 12 | 10,00 | ||||
| 2026-02-18 | 13F | Mackenzie Financial Corp | Put | 13.000 | 2 | |||||
| 2026-02-12 | 13F | Aviva Plc | 99.535 | -0,75 | 3.637 | 6,19 | ||||
| 2026-02-12 | 13F | Sit Investment Associates Inc | 0 | -100,00 | 0 | |||||
| 2026-02-12 | 13F | Hyperion Capital Advisors LP | 14.840 | 0,00 | 542 | 7,11 | ||||
| 2025-09-25 | NP | GBLAX - AMERICAN FUNDS GLOBAL BALANCED FUND Class A This fund is a listed as child fund of Capital World Investors and if that institution has disclosed ownership in this security, then these positions will not be double counted when calculating total shares and total value | 1.692.514 | 0,00 | 129.934 | 5,61 | ||||
| 2025-09-26 | NP | FSSEX - Fidelity SAI Sustainable International Equity Fund | 6.303 | 12,29 | 484 | 18,38 | ||||
| 2026-02-12 | 13F | Azimuth Capital Investment Management LLC | 264.399 | 1,59 | 9.661 | 8,67 | ||||
| 2025-11-14 | 13F | Nekton Capital Ltd. | 69.263 | 2.366 | ||||||
| 2025-09-25 | NP | JEMA - JPMorgan Emerging Markets Equity Core ETF | 187.182 | -7,64 | 14.370 | -2,46 | ||||
| 2025-11-12 | 13F | Barclays Plc | Put | 0 | -100,00 | 0 | -100,00 | |||
| 2026-02-10 | 13F | Bank of New York Mellon Corp | 4.736.584 | 6,32 | 173.075 | 13,72 | ||||
| 2026-02-13 | 13F | Fairman Group, LLC | 350 | -8,38 | 13 | -7,69 | ||||
| 2025-11-14 | 13F | Blue Barn Wealth, LLC | 0 | -100,00 | 0 | -100,00 | ||||
| 2026-02-12 | 13F | Callan Family Office, LLC | 176.933 | 40,49 | 6.465 | 50,28 | ||||
| 2025-11-06 | 13F | Vision Financial Markets Llc | 0 | -100,00 | 0 | -100,00 | ||||
| 2026-01-30 | 13F/A | M&t Bank Corp | 115.126 | 788,32 | 4.206 | 851,58 | ||||
| 2026-02-13 | 13F | Sei Investments Co | 6.472.154 | 25,45 | 236.493 | 34,19 | ||||
| 2026-02-17 | 13F | Ameriflex Group, Inc. | 104 | -50,00 | 4 | -57,14 | ||||
| 2026-01-26 | 13F | FACTORIAL MANAGEMENT Ltd | 56.260 | 0,00 | 2.056 | 6,98 | ||||
| 2026-02-11 | 13F | Capital Analysts, Inc. | 226 | 0,00 | 0 | |||||
| 2026-02-13 | 13F | First Trust Advisors Lp | 94.099 | -11,40 | 3.438 | -5,21 | ||||
| 2025-11-12 | 13F | Diversify Wealth Management, Llc | 0 | -100,00 | 0 | -100,00 | ||||
| 2026-02-19 | 13F | CI Private Wealth, LLC | 64.129 | 3,37 | 2.339 | 10,38 | ||||
| 2025-11-12 | 13F | Burgundy Asset Management Ltd. | 0 | -100,00 | 0 | -100,00 | ||||
| 2026-01-30 | 13F | Ares Financial Consulting, LLC | 72 | 3 | ||||||
| 2025-09-26 | NP | UUPIX - Ultraemerging Markets Profund Investor Class | 9.210 | 46,35 | 707 | 54,70 | ||||
| 2026-02-05 | 13F | May Hill Capital, LLC | 45.880 | 129,48 | 1.676 | 145,75 | ||||
| 2026-01-21 | 13F | DMG Group, LLC | 19.761 | 6,70 | 722 | 14,24 | ||||
| 2026-02-12 | 13F | Hrt Financial Lp | 0 | -100,00 | 0 | |||||
| 2026-02-17 | 13F | First Trust Bank, Ltd. | 190.000 | 6.943 | ||||||
| 2026-02-17 | 13F | Wellington Management Group Llp | 0 | -100,00 | 0 | |||||
| 2025-09-23 | NP | MNCCX - Pro-Blend(R) Conservative Term Series Class L | 16.049 | 0,00 | 1.232 | 5,66 | ||||
| 2026-02-13 | 13F | Dodge & Cox | 5.501.800 | -11,47 | 201.036 | -5,30 | ||||
| 2026-02-10 | 13F | NS Partners Ltd | 948.978 | 31,17 | 34.676 | 40,31 | ||||
| 2025-11-13 | 13F | Riggs Asset Managment Co. Inc. | 0 | -100,00 | 0 | -100,00 | ||||
| 2026-02-17 | 13F | Aperture Investors, LLC | 0 | -100,00 | 0 | |||||
| 2026-02-02 | 13F | Principal Financial Group Inc | 106.324 | 0,00 | 3.885 | 6,97 | ||||
| 2026-02-13 | 13F | Resources Investment Advisors, LLC. | 22.431 | -12,96 | 820 | -6,93 | ||||
| 2026-02-13 | 13F | Bank Of Nova Scotia | 29.311 | -7,29 | 1.070 | -0,83 | ||||
| 2026-02-04 | 13F | Ameritas Advisory Services, LLC | 0 | -100,00 | 0 | |||||
| 2026-02-17 | 13F | Ancora Advisors, LLC | 1.520 | 3.204,35 | 56 | 5.400,00 | ||||
| 2026-01-29 | 13F | Calamos Advisors LLC | 40.544 | -1,27 | 1.481 | 5,63 | ||||
| 2026-02-13 | 13F | Umb Bank N A/mo | 6.566 | 3,01 | 240 | 10,14 | ||||
| 2026-02-06 | 13F | Mjp Associates Inc /adv | 7.218 | 10,01 | 264 | 17,41 | ||||
| 2026-02-17 | 13F | Millennium Management Llc | 15.014 | -99,37 | 549 | -99,32 | ||||
| 2026-02-13 | 13F | Arkadios Wealth Advisors | 5.492 | -11,02 | 201 | -4,76 | ||||
| 2026-02-17 | 13F | Harding Loevner Lp | 25.187.687 | -6,98 | 920.256 | -0,52 | ||||
| 2025-11-13 | 13F | Theleme Partners LLP | 0 | -100,00 | 0 | -100,00 | ||||
| 2025-09-29 | NP | EELV - Invesco S&P Emerging Markets Low Volatility ETF This fund is a listed as child fund of Invesco Ltd. and if that institution has disclosed ownership in this security, then these positions will not be double counted when calculating total shares and total value | 20.605 | -12,27 | 1.582 | -7,38 | ||||
| 2025-09-29 | NP | CNWGX - Calamos Evolving World Growth Fund Class A | 39.065 | -19,01 | 2.999 | -14,46 | ||||
| 2026-02-05 | 13F | Allworth Financial LP | 4.394 | -12,37 | 161 | -6,43 | ||||
| 2026-02-10 | 13F | Marietta Investment Partners Llc | 180.102 | -0,34 | 6.581 | 6,59 | ||||
| 2026-02-18 | 13F | GWM Advisors LLC | 67.435 | 1,24 | 2.464 | 8,31 | ||||
| 2026-01-29 | 13F | IMC-Chicago, LLC | 0 | -100,00 | 0 | -100,00 | ||||
| 2026-01-12 | 13F | Byrne Asset Management LLC | 750 | 0,00 | 27 | 8,00 | ||||
| 2026-02-11 | 13F | Capital Research Global Investors | 4.627.387 | 0,16 | 169.085 | 7,14 | ||||
| 2026-01-29 | 13F | Coronation Fund Managers Ltd. | 483.614 | 584,49 | 17.671 | 632,32 | ||||
| 2026-01-23 | 13F | Factory Mutual Insurance Co | 156.328 | 0,00 | 5.712 | 6,97 | ||||
| 2026-02-10 | 13F/A | Guinness Atkinson Asset Management Inc | 9.400 | 0,00 | 342 | 6,56 | ||||
| 2026-02-03 | 13F | Ballentine Partners, LLC | 32.287 | 0,31 | 1.180 | 7,28 | ||||
| 2025-09-25 | NP | TWOEX - TCW White Oak Emerging Markets Equity Fund Class I | 1.505 | -47,74 | 116 | -44,98 | ||||
| 2025-10-20 | 13F | Calamos Wealth Management LLC | 0 | -100,00 | 0 | -100,00 | ||||
| 2026-02-11 | 13F | First Command Advisory Services, Inc. | 138 | 0,00 | 5 | 25,00 | ||||
| 2025-11-14 | 13F | 17 Capital Partners, Llc | 0 | -100,00 | 0 | |||||
| 2026-02-17 | 13F | Tudor Investment Corp Et Al | 0 | -100,00 | 0 | -100,00 | ||||
| 2026-01-27 | 13F | First Horizon Corp | 4.843 | -1,36 | 177 | 5,39 | ||||
| 2025-10-24 | 13F | World Equity Group, Inc. | 0 | -100,00 | 0 | -100,00 | ||||
| 2025-11-14 | 13F | Prelude Capital Management, Llc | 0 | -100,00 | 0 | -100,00 | ||||
| 2025-11-14 | 13F | Icon Wealth Advisors, LLC | 0 | -100,00 | 0 | -100,00 | ||||
| 2025-09-25 | NP | DFAX - Dimensional World ex U.S. Core Equity 2 ETF | 49.666 | 12,14 | 3.813 | 18,42 | ||||
| 2026-02-11 | 13F | OneAscent Family Office, LLC | 5.952 | 0,00 | 217 | 6,90 | ||||
| 2026-02-06 | 13F | Milestone Resources Group Ltd | 1.369.248 | 0,00 | 50 | 8,70 | ||||
| 2026-01-29 | 13F | Deltec Asset Management Llc | 47.200 | -2,07 | 1.725 | 4,74 | ||||
| 2026-02-17 | 13F | CWM Advisors, LLC | 2.327 | 85 | ||||||
| 2026-02-10 | 13F | State of Wyoming | 29.652 | -0,80 | 1.083 | 6,07 | ||||
| 2026-02-13 | 13F | OMERS ADMINISTRATION Corp | 1.474.036 | 0,00 | 53.861 | 6,97 | ||||
| 2026-01-16 | 13F | Empirical Financial Services, LLC d.b.a. Empirical Wealth Management | 6.882 | -66,01 | 251 | -63,68 | ||||
| 2026-02-06 | 13F | Larson Financial Group LLC | 1.136 | 33,80 | 42 | 41,38 | ||||
| 2026-02-12 | 13F | Dsm Capital Partners Llc | 160.785 | -19,00 | 5.875 | -13,35 | ||||
| 2026-01-29 | 13F | Pictet Asset Management Holding SA | 639.657 | -0,12 | 23.373 | 6,84 | ||||
| 2025-09-26 | NP | RGEAX - Global Equity Fund Class A | 116.473 | -12,87 | 8.942 | -7,99 | ||||
| 2026-02-12 | 13F | Earnest Partners Llc | 2.621.555 | 9,53 | 95.792 | 17,16 | ||||
| 2026-02-09 | 13F | PGGM Investments | 3.799.908 | 0,00 | 139 | 6,98 | ||||
| 2026-02-18 | 13F | Vident Advisory, LLC | 162.709 | 1,63 | 5.945 | 8,70 | ||||
| 2026-02-17 | 13F | Point72 Asset Management, L.P. | 123.584 | 4.516 | ||||||
| 2026-02-09 | 13F | Summitry Llc | 20.353 | 10,45 | 744 | 18,12 | ||||
| 2026-02-12 | 13F | Brown Brothers Harriman & Co | 1.460 | -56,80 | 53 | -53,91 | ||||
| 2025-11-04 | 13F | Thrivent Financial For Lutherans | 0 | -100,00 | 0 | |||||
| 2026-02-12 | 13F | New York State Common Retirement Fund | 1.082.116 | 135,32 | 39.541 | 151,72 | ||||
| 2026-02-11 | 13F | Simplex Trading, Llc | Put | 7.900 | -43,57 | 274 | ||||
| 2026-02-13 | 13F | Cloverfields Capital Group, Lp | 51.601 | 1,20 | 1.886 | 8,27 | ||||
| 2026-02-04 | 13F | Madison Asset Management, LLC | 91.380 | -3,86 | 3.339 | 2,87 | ||||
| 2025-09-24 | NP | IMRFX - Columbia Global Opportunities Fund Class A | 2.549 | 0,00 | 196 | 5,41 | ||||
| 2026-02-02 | 13F | Oppenheimer Asset Management Inc. | 430.998 | 1,11 | 15.749 | 8,15 | ||||
| 2026-02-17 | 13F | Waverton Investment Management Ltd | 0 | -100,00 | 0 | -100,00 | ||||
| 2025-10-02 | 13F | Caldwell Trust Co | 0 | -100,00 | 0 | -100,00 | ||||
| 2026-01-26 | 13F | La Banque Postale Asset Management SA | 60.000 | 0,00 | 2.192 | 6,98 | ||||
| 2026-02-04 | 13F | Atlantic Union Bankshares Corp | 270 | -30,77 | 10 | -30,77 | ||||
| 2026-02-17 | 13F | Jain Global LLC | 0 | -100,00 | 0 | |||||
| 2026-01-12 | 13F | DAVENPORT & Co LLC | 105.928 | -3,02 | 3.871 | 3,73 | ||||
| 2026-02-12 | 13F | Pitcairn Co | 0 | -100,00 | 0 | |||||
| 2026-02-13 | 13F | Brown Advisory Inc | 11.929.832 | -0,28 | 435.916 | 6,66 | ||||
| 2026-02-05 | 13F | GSB Wealth Management, LLC | 11.650 | -8,20 | 426 | -1,85 | ||||
| 2025-11-20 | 13F | First Affirmative Financial Network | 7.653 | 96,13 | 261 | -12,71 | ||||
| 2025-09-26 | NP | FGILX - Fidelity Global Equity Income Fund This fund is a listed as child fund of Fmr Llc and if that institution has disclosed ownership in this security, then these positions will not be double counted when calculating total shares and total value | 10.079 | 27,92 | 774 | 35,14 | ||||
| 2026-01-28 | 13F | Loring Wolcott & Coolidge Fiduciary Advisors Llp/ma | 361.642 | -5,63 | 11.732 | -16,03 | ||||
| 2026-02-17 | 13F | Graham Capital Management, L.P. | 7.977 | 291 | ||||||
| 2026-02-11 | 13F | Letko, Brosseau & Associates Inc | 177.035 | 35,91 | 6.469 | 45,38 | ||||
| 2026-02-13 | 13F | Palisade Asset Management, LLC | 0 | -100,00 | 0 | |||||
| 2026-01-23 | 13F | Tower View Investment Management & Research LLC | 0 | -100,00 | 0 | |||||
| 2026-02-13 | 13F | Sterling Capital Management LLC | 10.116 | -10,64 | 370 | -4,40 | ||||
| 2026-01-15 | 13F | J. Safra Sarasin Holding AG | 10.747 | 393 | ||||||
| 2025-10-21 | 13F | Simon Quick Advisors, Llc | 0 | -100,00 | 0 | -100,00 | ||||
| 2025-09-25 | NP | CBLS - Clough Hedged Equity ETF | 15.077 | 1,29 | 1.157 | 7,03 | ||||
| 2026-01-29 | 13F | UBS Group AG | Call | 60.000 | 2.192 | |||||
| 2026-02-13 | 13F | SRS Capital Advisors, Inc. | 12.233 | 589,57 | 447 | 643,33 | ||||
| 2026-01-29 | 13F | UBS Group AG | 3.799.629 | 0,31 | 138.838 | 7,30 | ||||
| 2026-02-11 | 13F | Simplex Trading, Llc | 55.130 | 2.014 | ||||||
| 2026-02-11 | 13F | Simplex Trading, Llc | Call | 9.000 | -35,71 | 238 | ||||
| 2026-02-12 | 13F | Alps Advisors Inc | 102.000 | 0,00 | 3.727 | 6,97 | ||||
| 2026-02-17 | 13F | Jones Financial Companies Lllp | 18.144 | 9,29 | 663 | 16,96 | ||||
| 2026-02-09 | 13F | Todd Asset Management Llc | 808.373 | -0,92 | 29.538 | 5,98 | ||||
| 2026-02-13 | 13F | Fiduciary Trust Co | 22.655 | 0,73 | 828 | 7,68 | ||||
| 2026-02-17 | 13F | GCM Grosvenor Holdings, LLC | 0 | -100,00 | 0 | |||||
| 2026-02-09 | 13F | HBK Sorce Advisory LLC | 7.139 | -2,82 | 246 | -6,82 | ||||
| 2026-01-14 | 13F | Donaldson Capital Management, Llc | 231.267 | 29,43 | 8.450 | 38,46 | ||||
| 2026-02-03 | 13F | Sumitomo Mitsui DS Asset Management Company, Ltd | 11.800 | 0,00 | 431 | 6,95 | ||||
| 2025-09-26 | NP | FSST - Fidelity Sustainability U.S. Equity ETF | 1.472 | -4,17 | 113 | 1,80 | ||||
| 2026-02-06 | 13F | Cullen/frost Bankers, Inc. | 2.330 | 19,73 | 85 | 28,79 | ||||
| 2026-02-11 | 13F | Longfellow Investment Management Co Llc | 70.360 | -5,45 | 2.571 | 1,10 | ||||
| 2025-09-23 | NP | MNHCX - Pro-Blend(R) Maximum Term Series Class L | 67.635 | 26,58 | 5.192 | 33,68 | ||||
| 2025-10-15 | 13F | Norden Group Llc | 0 | -100,00 | 0 | -100,00 | ||||
| 2026-02-23 | 13F | Virtu Financial LLC | 0 | -100,00 | 0 | |||||
| 2025-10-31 | 13F | Whittier Trust Co | 0 | -100,00 | 0 | -100,00 | ||||
| 2026-02-02 | 13F | Horizon Investments, LLC | 41 | -50,00 | 1 | -50,00 | ||||
| 2026-02-13 | 13F | Barclays Plc | 117.159 | 30,52 | 4.281 | 39,60 | ||||
| 2026-02-09 | 13F | Leavell Investment Management, Inc. | 14.082 | 32,08 | 515 | 41,21 | ||||
| 2026-01-30 | 13F | Urban Wealth Management, LLC | 0 | -100,00 | 0 | -100,00 | ||||
| 2026-02-11 | 13F | Fca Corp /tx | 16.000 | 0,00 | 585 | 6,96 | ||||
| 2026-02-12 | 13F | Grey Fox Wealth Advisors, LLC | 0 | -100,00 | 0 | |||||
| 2025-09-26 | NP | PCIEX - PACE International Equity Investments Class P | 66.516 | 0,00 | 5.106 | 5,60 | ||||
| 2026-02-12 | 13F | Zevin Asset Management Llc | 326.483 | 3,24 | 11.930 | 119.190,00 | ||||
| 2026-01-29 | 13F | Kestra Private Wealth Services, Llc | 193.626 | -4,69 | 7.075 | 1,96 | ||||
| 2026-01-27 | 13F | Institute for Wealth Management, LLC. | 9.146 | 0,00 | 334 | 7,05 | ||||
| 2026-01-28 | 13F | B. Metzler seel. Sohn & Co. AG | 633.937 | -24,52 | 23.148 | -19,32 | ||||
| 2025-09-24 | NP | DAEMX - Dunham Emerging Markets Stock Fund Class A | 31.489 | 44,44 | 2.417 | 52,59 | ||||
| 2026-01-12 | 13F | E. Ohman J:or Asset Management AB | 216.300 | -2,92 | 7.904 | 3,85 | ||||
| 2025-09-26 | NP | SUNAMERICA SERIES TRUST - SA JPMorgan Diversified Balanced Portfolio Class 1 | 9.548 | -11,71 | 733 | -6,87 | ||||
| 2025-09-29 | NP | MPEMX - MONDRIAN EMERGING MARKETS VALUE EQUITY FUND | 714 | -72,88 | 55 | -71,73 | ||||
| 2026-02-06 | 13F | Intrust Bank Na | 6.619 | 4,57 | 242 | 11,57 | ||||
| 2026-01-23 | 13F | Natural Investments, Llc | 41.237 | 5,90 | 2 | 0,00 | ||||
| 2026-02-03 | 13F | Ethic Inc. | 166.432 | 13,77 | 6.081 | 21,69 | ||||
| 2026-01-22 | 13F | BOCHK Asset Management Ltd | 1.800 | 125,00 | 66 | 140,74 | ||||
| 2026-02-17 | 13F | Amundi | 362.520 | 15,76 | 13.246 | 21,44 | ||||
| 2025-09-26 | NP | OSEA - Harbor International Compounders ETF | 382.143 | 6,53 | 29.337 | 12,51 | ||||
| 2026-02-06 | 13F | Fairtree Asset Management (Pty) Ltd | 0 | -100,00 | 0 | |||||
| 2026-01-30 | 13F | Bogart Wealth, LLC | 140 | 0,00 | 5 | 25,00 | ||||
| 2026-01-14 | 13F | Spire Wealth Management | 7.666 | -3,63 | 280 | 3,32 | ||||
| 2026-02-13 | 13F | Peak6 Llc | Call | 3.200 | 117 | |||||
| 2026-02-13 | 13F | Peak6 Llc | Put | 400.000 | 0,00 | 14.616 | 6,97 | |||
| 2026-03-06 | 13F | Hsbc Holdings Plc | 1.995.133 | -32,79 | 77.940 | -26,22 | ||||
| 2026-02-10 | 13F | Jupiter Asset Management Ltd | 213.887 | -0,81 | 7.815 | 6,10 | ||||
| 2026-02-11 | 13F | IMA Wealth, Inc. | 47 | 2 | ||||||
| 2026-02-17 | 13F | Mpwm Advisory Solutions, Llc | 0 | -100,00 | 0 | |||||
| 2026-01-27 | 13F | Elevated Capital Advisors, LLC | 36 | 1 | ||||||
| 2025-11-10 | 13F | Cary Street Partners Financial Llc | 0 | -100,00 | 0 | |||||
| 2025-11-14 | 13F | Axa S.a. | 0 | -100,00 | 0 | |||||
| 2026-02-12 | 13F | Quadrant Capital Group Llc | 12.556 | -21,46 | 459 | -16,12 | ||||
| 2026-02-03 | 13F | Cabot Wealth Management Inc | 570.998 | -0,83 | 20.864 | 6,08 | ||||
| 2026-02-10 | 13F | Meitav Dash Investments Ltd | 1.150.000 | 0,00 | 42.021 | 7,26 | ||||
| 2026-02-17 | 13F | Wealth Watch Advisors, INC | 126 | 0,00 | 5 | 0,00 | ||||
| 2025-09-24 | NP | ESIGX - Ashmore Emerging Markets Equity ESG Fund Institutional Class | 8.337 | 0,00 | 640 | 5,61 | ||||
| 2026-02-13 | 13F | Peak6 Llc | 69.198 | -42,36 | 2.528 | -38,36 | ||||
| 2026-02-12 | 13F | Burkett Asset Management Ltd | 28.080 | 1.026 | ||||||
| 2026-02-09 | 13F | Employees Retirement System of Texas | 109.672 | -45,92 | 4 | -33,33 | ||||
| 2026-02-17 | 13F | Advisor Group Holdings, Inc. | 30.539 | -14,81 | 1.116 | -18,06 | ||||
| 2026-02-12 | 13F | BRYN MAWR TRUST Co | 0 | -100,00 | 0 | -100,00 | ||||
| 2026-01-09 | 13F | SG Americas Securities, LLC | 27.322 | -20,95 | 1 | -100,00 | ||||
| 2026-02-10 | 13F | Savant Capital, LLC | 0 | -100,00 | 0 | |||||
| 2026-01-21 | 13F | Prime Capital Investment Advisors, LLC | 38.953 | 0,42 | 1.423 | 7,40 | ||||
| 2026-02-17 | 13F | Altrinsic Global Advisors Llc | 5.092.589 | -4,56 | 186.083 | 2,09 | ||||
| 2026-02-12 | 13F | Northwest & Ethical Investments L.P. | 99.602 | 27,48 | 3.639 | 36,34 | ||||
| 2026-02-12 | 13F | Castleark Management Llc | 41.260 | 0,00 | 1.508 | 6,96 | ||||
| 2026-01-21 | 13F | Jacobson & Schmitt Advisors, Llc | 399.271 | 4,21 | 14.589 | 11,48 | ||||
| 2026-02-12 | 13F | Brinker Capital Investments, LLC | 224.652 | 1,70 | 8.209 | 8,77 | ||||
| 2026-01-27 | 13F | Hgk Asset Management Inc | 1.495.000 | -0,74 | 54.627 | 6,17 | ||||
| 2026-02-11 | 13F | Brandes Investment Partners, Lp | 90.397 | -11,77 | 3.303 | -5,63 | ||||
| 2025-11-13 | 13F | Healthcare Of Ontario Pension Plan Trust Fund | 0 | -100,00 | 0 | |||||
| 2026-01-29 | 13F | Teachers Retirement System Of The State Of Kentucky | 511.760 | 0,00 | 19 | 5,88 | ||||
| 2026-02-03 | 13F | We Are One Seven, LLC | 8.261 | 9,65 | 302 | 17,12 | ||||
| 2026-02-12 | 13F | Ci Investments Inc. | 1.474.680 | 143,04 | 53.885 | 269.320,00 | ||||
| 2025-09-25 | NP | DFEM - Dimensional Emerging Markets Core Equity 2 ETF | 409.591 | 6,15 | 31.444 | 12,11 | ||||
| 2025-09-26 | NP | SUNAMERICA SERIES TRUST - SA JPMorgan Emerging Markets Portfolio Class 1 | 65.590 | -5,38 | 5.035 | -0,06 | ||||
| 2026-02-13 | 13F | Boston Partners | 6.520.680 | 60,18 | 238.224 | 71,31 | ||||
| 2026-02-11 | 13F | Marks Group Wealth Management, Inc | 12.798 | -3,81 | 468 | 2,86 | ||||
| 2026-02-05 | 13F | Sapient Capital Llc | 20.880 | 10,72 | 761 | 18,20 | ||||
| 2026-02-03 | 13F | Crestwood Advisors Group LLC | 9.676 | 45,68 | 354 | 56,19 | ||||
| 2026-02-17 | 13F | Wiley Bros.-aintree Capital, Llc | 15.938 | 29,89 | 582 | 40,92 | ||||
| 2026-01-05 | 13F | Miller Global Investments, LLC | 31.294 | 1.143 | ||||||
| 2026-02-17 | 13F | Caisse De Depot Et Placement Du Quebec | 419.200 | 0,00 | 15.318 | 6,97 | ||||
| 2026-02-10 | 13F | Rothschild Investment Llc | 14 | 1 | ||||||
| 2026-02-12 | 13F | Principal Securities, Inc. | 0 | -100,00 | 0 | |||||
| 2025-09-23 | NP | SEKAX - DWS Emerging Markets Equity Fund Class A | 5.000 | -16,67 | 384 | -12,16 | ||||
| 2026-02-06 | 13F | Pnc Financial Services Group, Inc. | 238.353 | 5,27 | 8.709 | 12,61 | ||||
| 2026-02-13 | 13F | Ieq Capital, Llc | 83.698 | 17,66 | 3.058 | 25,90 | ||||
| 2026-02-17 | 13F | Bank Of America Corp /de/ | 7.498.180 | 17,82 | 273.983 | 26,03 | ||||
| 2026-02-06 | 13F | Pzena Investment Management Llc | 838.448 | -2,41 | 30.637 | 4,39 | ||||
| 2026-02-17 | 13F | Silvercrest Asset Management Group Llc | 454.716 | 0,92 | 16.615 | 7,95 | ||||
| 2026-02-11 | 13F | Franklin Resources Inc | 13.295.052 | -4,25 | 485.801 | 2,42 | ||||
| 2026-02-17 | 13F | Captrust Financial Advisors | 176.680 | 72,95 | 6.456 | 85,01 | ||||
| 2025-09-23 | NP | MNECX - Pro-Blend(R) Extended Term Series Class L | 71.578 | 0,00 | 5.495 | 5,61 | ||||
| 2025-09-23 | NP | MYINX - MainStay MacKay International Opportunities Fund Investor Class | 20.913 | -25,91 | 1.605 | -21,75 | ||||
| 2025-10-29 | 13F | Courier Capital Llc | 0 | -100,00 | 0 | |||||
| 2026-01-30 | 13F | North Star Investment Management Corp. | 156 | 30,00 | 6 | 25,00 | ||||
| 2025-11-14 | 13F | Wolverine Trading, Llc | Put | 0 | -100,00 | 0 | -100,00 | |||
| 2026-01-20 | 13F | AdvisorNet Financial, Inc | 3.245 | -0,09 | 119 | 7,27 | ||||
| 2025-11-07 | 13F | Skandinaviska Enskilda Banken AB (publ) | 0 | -100,00 | 0 | -100,00 | ||||
| 2026-02-10 | 13F | Acadian Asset Management Llc | 858.355 | 40,91 | 31 | 55,00 | ||||
| 2026-01-21 | 13F | Westfuller Advisors, LLC | 3.560 | 0,00 | 130 | 7,44 | ||||
| 2025-09-24 | NP | EMXIX - Ashmore Emerging Markets Equity ex China Fund Institutional Class | 5.256 | 0,00 | 404 | 5,50 | ||||
| 2026-02-13 | 13F | Wells Fargo & Company/mn | 532.594 | -0,61 | 19.461 | 6,31 | ||||
| 2026-02-06 | 13F | Evoke Wealth, Llc | 21.068 | 1,33 | 770 | 8,31 | ||||
| 2026-02-13 | 13F | Graney & King, LLC | 1.200 | 0,00 | 44 | 7,50 | ||||
| 2025-09-22 | NP | TGRHX - Transamerica International Growth I2 | 342.673 | -0,62 | 26.307 | 4,96 | ||||
| 2026-02-17 | 13F | Advisory Services Network, LLC | 0 | -100,00 | 0 | |||||
| 2025-11-14 | 13F | Aspen Grove Capital, LLC | 0 | -100,00 | 0 | |||||
| 2026-02-12 | 13F | Wealthspire Advisors, LLC | 7.406 | 310,08 | 271 | 342,62 | ||||
| 2025-09-23 | NP | IIGIX - Voya Multi-Manager International Equity Fund Class I | 53.169 | 4,48 | 4.082 | 10,33 | ||||
| 2026-02-17 | 13F | Qube Research & Technologies Ltd | 0 | -100,00 | 0 | |||||
| 2025-09-23 | NP | LGGAX - ClearBridge International Growth Fund Class A This fund is a listed as child fund of Clearbridge, Llc and if that institution has disclosed ownership in this security, then these positions will not be double counted when calculating total shares and total value | 906.569 | 0,00 | 69.597 | 5,61 | ||||
| 2026-02-09 | 13F | Accent Capital Management, LLC | 918 | 0,00 | 34 | 6,45 | ||||
| 2026-02-17 | 13F | Holocene Advisors, LP | 705.967 | 25.796 | ||||||
| 2026-02-03 | 13F | S-Bank Fund Management Ltd | 107.850 | 0,00 | 3.941 | 6,95 | ||||
| 2026-02-13 | 13F | Ariel Investments, Llc | 13.151 | 42,33 | 481 | 52,38 | ||||
| 2026-01-05 | 13F | Confluence Investment Management Llc | 6.899 | 0,00 | 252 | 7,23 | ||||
| 2026-02-10 | 13F | Belvedere Trading LLC | Call | 5.700 | 1,79 | 417 | 8,88 | |||
| 2026-02-13 | 13F | Fayez Sarofim & Co | 281.100 | 47,58 | 10.271 | 57,87 | ||||
| 2025-11-12 | 13F | CIBC Bancorp USA Inc. | 2.565.879 | 87.650 | ||||||
| 2025-11-12 | 13F | NewSquare Capital LLC | 0 | -100,00 | 0 | -100,00 | ||||
| 2026-02-12 | 13F | Foster Dykema Cabot & Partners, Llc | 554 | 0,00 | 20 | 11,11 | ||||
| 2026-02-03 | 13F | Chesapeake Capital Corp /il/ | 19.782 | 0,00 | 723 | 6,96 | ||||
| 2026-02-13 | 13F | Golden State Wealth Management, LLC | 339 | 0,00 | 12 | 9,09 | ||||
| 2025-11-13 | 13F | Glenmede Investment Management, LP | 12.537 | 100,59 | 428 | -10,65 | ||||
| 2026-01-07 | 13F | Riversedge Advisors, Llc | 7.072 | 13,73 | 258 | 21,70 | ||||
| 2025-09-25 | NP | DEXC - Dimensional Emerging Markets ex China Core Equity ETF | 34.516 | 14,28 | 2.650 | 20,68 | ||||
| 2026-02-13 | 13F | Commerce Bank | 10.822 | 40,60 | 395 | 50,76 | ||||
| 2025-09-26 | NP | EMES - Harbor Emerging Markets Select ETF | 3.970 | 305 | ||||||
| 2026-02-12 | 13F | Stamos Capital Partners, L.p. | 69.270 | -10,55 | 2.531 | -4,31 | ||||
| 2026-02-12 | 13F | Scotia Capital Inc. | 288.184 | 1,79 | 10.530 | 8,88 | ||||
| 2026-01-15 | 13F | Hara Capital LLC | 100 | 0,00 | 4 | 0,00 | ||||
| 2026-01-29 | 13F | Nbc Securities, Inc. | 1.708 | 3,52 | 62 | 10,71 | ||||
| 2026-02-10 | 13F | Root Financial Partners, LLC | 113 | 31,40 | 4 | 100,00 | ||||
| 2026-02-13 | 13F | Vontobel Holding Ltd. | 376.504 | 17,55 | 13.757 | 25,75 | ||||
| 2025-09-26 | NP | FSYNX - Fidelity Sustainable Emerging Markets Equity Fund Fidelity Advisor Sustainable Emerging Markets Equity Fund: Class M | 625 | 0,00 | 48 | 4,44 |