Grundlæggende statistik
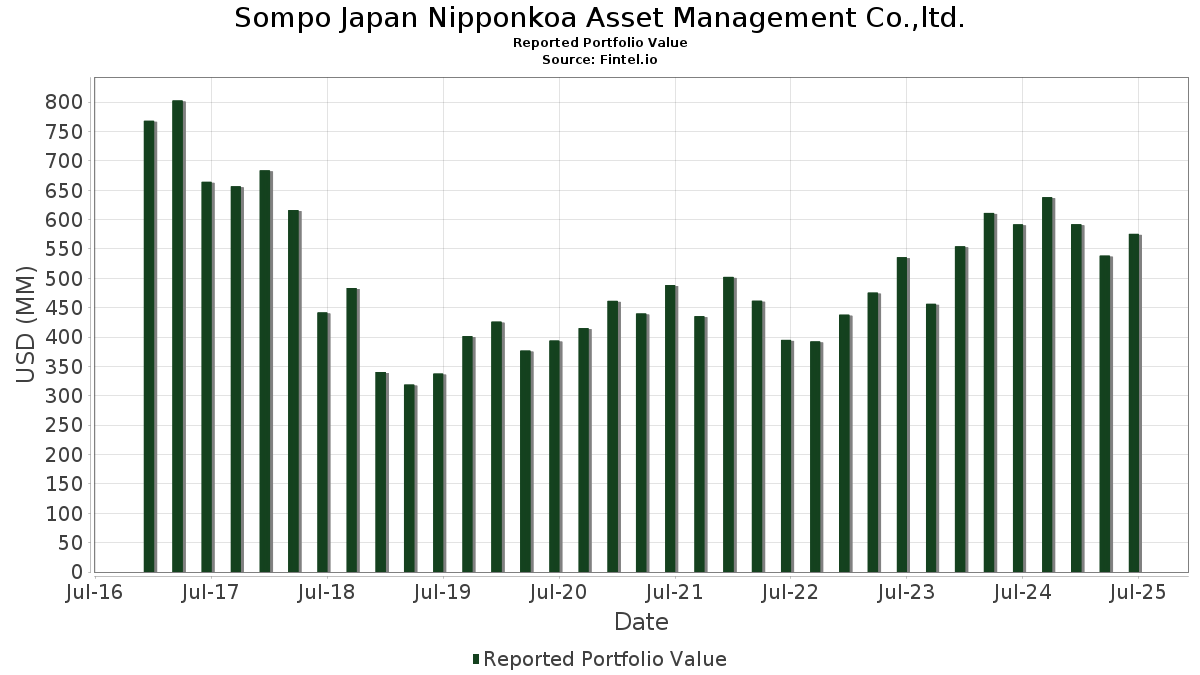
| Porteføljeværdi | $ 575.638.644 |
| Nuværende stillinger | 185 |
Seneste beholdninger, ydeevne, AUM (fra 13F, 13D)
Sompo Japan Nipponkoa Asset Management Co.,ltd. har afsløret 185 samlede besiddelser i deres seneste SEC-arkivering. Den seneste porteføljeværdi er beregnet til at være $ 575.638.644 USD. Faktiske aktiver under forvaltning (AUM) er denne værdi plus kontanter (som ikke er oplyst). Sompo Japan Nipponkoa Asset Management Co.,ltd.s største beholdninger er Vanguard Index Funds - Vanguard S&P 500 ETF (US:VOO) , iShares, Inc. - iShares Core MSCI Emerging Markets ETF (US:IEMG) , iShares Trust - iShares 7-10 Year Treasury Bond ETF (US:IEF) , Microsoft Corporation (US:MSFT) , and NVIDIA Corporation (US:NVDA) .
Top øger dette kvartal
Vi bruger ændringen i porteføljeallokeringen, fordi dette er den mest meningsfulde metrik. Ændringer kan skyldes handler eller ændringer i aktiekurser.
| Sikkerhed | Aktier (MM) |
Værdi (MM$) |
Portefølje % | ΔPortefølje % |
|---|---|---|---|---|
| 0,16 | 25,13 | 4,3658 | 1,2834 | |
| 0,06 | 29,46 | 5,1186 | 1,0491 | |
| 0,02 | 6,33 | 1,0990 | 0,5453 | |
| 0,11 | 19,22 | 3,3395 | 0,4104 | |
| 0,08 | 47,92 | 8,3252 | 0,3824 | |
| 0,01 | 2,37 | 0,4115 | 0,3266 | |
| 0,03 | 10,04 | 1,7447 | 0,3174 | |
| 0,01 | 10,53 | 1,8298 | 0,2914 | |
| 0,02 | 7,77 | 1,3490 | 0,2692 | |
| 0,67 | 40,41 | 7,0200 | 0,2309 |
Top falder i dette kvartal
Vi bruger ændringen i porteføljeallokeringen, fordi dette er den mest meningsfulde metrik. Ændringer kan skyldes handler eller ændringer i aktiekurser.
| Sikkerhed | Aktier (MM) |
Værdi (MM$) |
Portefølje % | ΔPortefølje % |
|---|---|---|---|---|
| 0,10 | 20,97 | 3,6433 | -0,9566 | |
| 0,01 | 1,51 | 0,2622 | -0,4523 | |
| 0,05 | 7,06 | 1,2262 | -0,2360 | |
| 0,39 | 37,48 | 6,5111 | -0,2254 | |
| 0,04 | 14,58 | 2,5324 | -0,2070 | |
| 0,09 | 7,78 | 1,3523 | -0,1802 | |
| 0,00 | 1,04 | 0,1812 | -0,1732 | |
| 0,05 | 2,19 | 0,3804 | -0,1711 | |
| 0,01 | 2,15 | 0,3737 | -0,1664 | |
| 0,05 | 5,28 | 0,9167 | -0,1578 |
13F og Fondsarkivering
Denne formular blev indsendt den 2025-08-14 for rapporteringsperioden 2025-06-30. Klik på linkikonet for at se den fulde transaktionshistorik.
Opgrader for at låse op for premium-data og eksportere til Excel ![]() .
.
| Sikkerhed | Type | Gennemsnitlig aktiekurs | Aktier (MM) |
Δ Aktier (%) |
Δ Aktier (%) |
Værdi ($MM) |
Portefølje (%) |
ΔPortefølje (%) |
|
|---|---|---|---|---|---|---|---|---|---|
| VOO / Vanguard Index Funds - Vanguard S&P 500 ETF | 0,08 | 1,36 | 47,92 | 12,04 | 8,3252 | 0,3824 | |||
| IEMG / iShares, Inc. - iShares Core MSCI Emerging Markets ETF | 0,67 | -0,63 | 40,41 | 10,53 | 7,0200 | 0,2309 | |||
| IEF / iShares Trust - iShares 7-10 Year Treasury Bond ETF | 0,39 | 2,88 | 37,48 | 3,32 | 6,5111 | -0,2254 | |||
| MSFT / Microsoft Corporation | 0,06 | 1,47 | 29,46 | 34,45 | 5,1186 | 1,0491 | |||
| NVDA / NVIDIA Corporation | 0,16 | 3,86 | 25,13 | 51,40 | 4,3658 | 1,2834 | |||
| AAPL / Apple Inc. | 0,10 | -8,34 | 20,97 | -15,34 | 3,6433 | -0,9566 | |||
| GOOGL / Alphabet Inc. | 0,11 | 6,94 | 19,22 | 21,87 | 3,3395 | 0,4104 | |||
| V / Visa Inc. | 0,04 | -2,46 | 14,58 | -1,19 | 2,5324 | -0,2070 | |||
| AMZN / Amazon.com, Inc. | 0,06 | -9,43 | 13,57 | 4,44 | 2,3582 | -0,0554 | |||
| META / Meta Platforms, Inc. | 0,01 | -0,72 | 10,53 | 27,15 | 1,8298 | 0,2914 | |||
| ROK / Rockwell Automation, Inc. | 0,03 | 1,64 | 10,04 | 30,67 | 1,7447 | 0,3174 | |||
| ADBE / Adobe Inc. | 0,02 | 7,77 | 9,39 | 8,72 | 1,6318 | 0,0273 | |||
| JPM / JPMorgan Chase & Co. | 0,03 | -1,13 | 8,99 | 16,85 | 1,5623 | 0,1331 | |||
| KO / The Coca-Cola Company | 0,12 | -1,20 | 8,76 | -2,40 | 1,5212 | -0,1448 | |||
| CRM / Salesforce, Inc. | 0,03 | 6,69 | 8,31 | 8,42 | 1,4436 | 0,0202 | |||
| DIS / The Walt Disney Company | 0,06 | -2,76 | 7,98 | 22,18 | 1,3865 | 0,1734 | |||
| CVS / CVS Health Corporation | 0,11 | -3,31 | 7,93 | -1,56 | 1,3775 | -0,1183 | |||
| MDT / Medtronic plc | 0,09 | -2,77 | 7,78 | -5,68 | 1,3523 | -0,1802 | |||
| ULTA / Ulta Beauty, Inc. | 0,02 | 4,63 | 7,77 | 33,56 | 1,3490 | 0,2692 | |||
| JNJ / Johnson & Johnson | 0,05 | -2,67 | 7,06 | -10,35 | 1,2262 | -0,2360 | |||
| CSCO / Cisco Systems, Inc. | 0,10 | -1,49 | 6,62 | 10,77 | 1,1492 | 0,0401 | |||
| INTC / Intel Corporation | 0,29 | -4,84 | 6,51 | -6,14 | 1,1317 | -0,1572 | |||
| AVGO / Broadcom Inc. | 0,02 | 28,86 | 6,33 | 112,21 | 1,0990 | 0,5453 | |||
| C / Citigroup Inc. | 0,07 | -12,58 | 5,84 | 4,83 | 1,0149 | -0,0201 | |||
| SYY / Sysco Corporation | 0,08 | -3,12 | 5,82 | -2,22 | 1,0106 | -0,0941 | |||
| QCOM / QUALCOMM Incorporated | 0,04 | -2,12 | 5,67 | 1,49 | 0,9849 | -0,0525 | |||
| UNP / Union Pacific Corporation | 0,02 | 5,84 | 5,56 | 3,08 | 0,9667 | -0,0358 | |||
| UPS / United Parcel Service, Inc. | 0,05 | -0,63 | 5,28 | -8,81 | 0,9167 | -0,1578 | |||
| SPGI / S&P Global Inc. | 0,01 | 0,10 | 5,04 | 3,90 | 0,8751 | -0,0253 | |||
| SWK / Stanley Black & Decker, Inc. | 0,07 | 4,40 | 5,00 | -8,01 | 0,8680 | -0,1405 | |||
| AMCR / Amcor plc | 0,53 | 1,63 | 4,92 | -3,70 | 0,8538 | -0,0940 | |||
| BAC / Bank of America Corporation | 0,10 | -1,68 | 4,62 | 11,50 | 0,8034 | 0,0331 | |||
| TFC / Truist Financial Corporation | 0,10 | -3,97 | 4,40 | 0,32 | 0,7637 | -0,0500 | |||
| NKE / NIKE, Inc. | 0,06 | 8,40 | 4,36 | 21,30 | 0,7568 | 0,0899 | |||
| HD / The Home Depot, Inc. | 0,01 | -0,26 | 4,14 | -0,24 | 0,7195 | -0,0513 | |||
| ACN / Accenture plc | 0,01 | 0,59 | 4,11 | -3,66 | 0,7134 | -0,0781 | |||
| WMT / Walmart Inc. | 0,04 | -14,53 | 3,78 | -4,79 | 0,6567 | -0,0807 | |||
| VZ / Verizon Communications Inc. | 0,09 | -1,53 | 3,77 | -6,06 | 0,6548 | -0,0903 | |||
| CL / Colgate-Palmolive Company | 0,04 | -1,55 | 3,68 | -4,51 | 0,6401 | -0,0763 | |||
| TXN / Texas Instruments Incorporated | 0,02 | 5,09 | 3,60 | 21,42 | 0,6254 | 0,0748 | |||
| MRK / Merck & Co., Inc. | 0,04 | -4,44 | 3,34 | -15,73 | 0,5800 | -0,1557 | |||
| LYB / LyondellBasell Industries N.V. | 0,06 | 5,35 | 3,20 | -13,40 | 0,5558 | -0,1303 | |||
| COP / ConocoPhillips | 0,03 | -1,02 | 2,87 | -15,43 | 0,4991 | -0,1317 | |||
| LLY / Eli Lilly and Company | 0,00 | 1,71 | 2,78 | -4,00 | 0,4834 | -0,0549 | |||
| AKAM / Akamai Technologies, Inc. | 0,03 | 9,50 | 2,41 | 8,46 | 0,4186 | 0,0062 | |||
| IBM / International Business Machines Corporation | 0,01 | 2,15 | 2,38 | 21,10 | 0,4129 | 0,0484 | |||
| AMAT / Applied Materials, Inc. | 0,01 | 310,79 | 2,37 | 418,16 | 0,4115 | 0,3266 | |||
| ALL / The Allstate Corporation | 0,01 | -2,78 | 2,25 | -5,50 | 0,3913 | -0,0512 | |||
| BMY / Bristol-Myers Squibb Company | 0,05 | -2,85 | 2,19 | -26,27 | 0,3804 | -0,1711 | |||
| INTU / Intuit Inc. | 0,00 | -21,31 | 2,18 | 0,93 | 0,3790 | -0,0223 | |||
| MMC / Marsh & McLennan Companies, Inc. | 0,01 | -17,45 | 2,15 | -26,03 | 0,3737 | -0,1664 | |||
| KLAC / KLA Corporation | 0,00 | 10,47 | 2,15 | 45,59 | 0,3728 | 0,0990 | |||
| AVY / Avery Dennison Corporation | 0,01 | -1,52 | 2,11 | -2,91 | 0,3658 | -0,0369 | |||
| ROST / Ross Stores, Inc. | 0,02 | 11,47 | 2,02 | 11,34 | 0,3514 | 0,0139 | |||
| NFLX / Netflix, Inc. | 0,00 | 1,35 | 2,01 | 45,51 | 0,3490 | 0,0927 | |||
| D / Dominion Energy, Inc. | 0,03 | -2,97 | 1,83 | -2,20 | 0,3171 | -0,0295 | |||
| EXC / Exelon Corporation | 0,04 | 1,23 | 1,82 | -4,60 | 0,3170 | -0,0382 | |||
| SHW / The Sherwin-Williams Company | 0,01 | -4,20 | 1,80 | -5,80 | 0,3132 | -0,0422 | |||
| BKNG / Booking Holdings Inc. | 0,00 | -3,12 | 1,79 | 21,71 | 0,3118 | 0,0380 | |||
| NEE / NextEra Energy, Inc. | 0,03 | 14,67 | 1,74 | 12,27 | 0,3020 | 0,0145 | |||
| GS / The Goldman Sachs Group, Inc. | 0,00 | 0,00 | 1,67 | 29,56 | 0,2902 | 0,0508 | |||
| PM / Philip Morris International Inc. | 0,01 | 9,84 | 1,61 | 26,06 | 0,2791 | 0,0424 | |||
| COST / Costco Wholesale Corporation | 0,00 | 0,00 | 1,54 | 4,68 | 0,2683 | -0,0057 | |||
| AXP / American Express Company | 0,00 | 10,50 | 1,54 | 30,98 | 0,2682 | 0,0494 | |||
| ORCL / Oracle Corporation | 0,01 | 2,80 | 1,52 | 60,82 | 0,2647 | 0,0887 | |||
| KMX / CarMax, Inc. | 0,02 | -6,07 | 1,52 | -19,00 | 0,2638 | -0,0842 | |||
| MMM / 3M Company | 0,01 | -62,16 | 1,51 | -60,77 | 0,2622 | -0,4523 | |||
| TJX / The TJX Companies, Inc. | 0,01 | 0,42 | 1,49 | 1,85 | 0,2585 | -0,0129 | |||
| AON / Aon plc | 0,00 | 2,21 | 1,48 | -8,62 | 0,2578 | -0,0438 | |||
| GD / General Dynamics Corporation | 0,00 | 4,20 | 1,45 | 11,49 | 0,2513 | 0,0104 | |||
| ABT / Abbott Laboratories | 0,01 | 4,40 | 1,36 | 7,11 | 0,2356 | 0,0003 | |||
| LRCX / Lam Research Corporation | 0,01 | 222,25 | 1,34 | 331,94 | 0,2327 | 0,1750 | |||
| CCI / Crown Castle Inc. | 0,01 | 14,18 | 1,27 | 12,56 | 0,2213 | 0,0111 | |||
| MS / Morgan Stanley | 0,01 | 0,00 | 1,15 | 20,67 | 0,1999 | 0,0229 | |||
| SPY / SPDR S&P 500 ETF | 0,00 | 47,20 | 1,14 | 62,52 | 0,1975 | 0,0676 | |||
| APH / Amphenol Corporation | 0,01 | -14,84 | 1,13 | 28,17 | 0,1969 | 0,0328 | |||
| WFC / Wells Fargo & Company | 0,01 | -23,21 | 1,13 | -14,31 | 0,1957 | -0,0484 | |||
| ABBV / AbbVie Inc. | 0,01 | 0,00 | 1,10 | -11,43 | 0,1912 | -0,0395 | |||
| CAG / Conagra Brands, Inc. | 0,05 | 1,07 | 0,1866 | 0,1866 | |||||
| PRU / Prudential Financial, Inc. | 0,01 | 1,94 | 1,07 | -1,92 | 0,1861 | -0,0167 | |||
| STT / State Street Corporation | 0,01 | -41,12 | 1,07 | -30,08 | 0,1854 | -0,0980 | |||
| IVV / iShares Trust - iShares Core S&P 500 ETF | 0,00 | -50,54 | 1,04 | -45,34 | 0,1812 | -0,1732 | |||
| QFIN / Qfin Holdings, Inc. - Depositary Receipt (Common Stock) | 0,02 | 15,52 | 1,03 | 11,45 | 0,1794 | 0,0075 | |||
| RTX / RTX Corporation | 0,01 | 6,04 | 1,03 | 17,01 | 0,1781 | 0,0152 | |||
| T / AT&T Inc. | 0,04 | 26,17 | 1,02 | 29,04 | 0,1777 | 0,0306 | |||
| IBN / ICICI Bank Limited - Depositary Receipt (Common Stock) | 0,03 | -18,26 | 1,01 | -12,77 | 0,1758 | -0,0396 | |||
| ADP / Automatic Data Processing, Inc. | 0,00 | 13,83 | 0,99 | 14,87 | 0,1720 | 0,0120 | |||
| KKR / KKR & Co. Inc. | 0,01 | -3,59 | 0,96 | 10,93 | 0,1675 | 0,0061 | |||
| CAT / Caterpillar Inc. | 0,00 | 1,24 | 0,95 | 19,17 | 0,1652 | 0,0170 | |||
| FICO / Fair Isaac Corporation | 0,00 | 8,33 | 0,95 | 7,34 | 0,1651 | 0,0008 | |||
| SYK / Stryker Corporation | 0,00 | 1,27 | 0,95 | 7,63 | 0,1643 | 0,0011 | |||
| FI / Fiserv, Inc. | 0,01 | 38,83 | 0,94 | 8,39 | 0,1638 | 0,0023 | |||
| XYZ / Block, Inc. | 0,01 | -4,01 | 0,93 | 19,92 | 0,1612 | 0,0176 | |||
| NDAQ / Nasdaq, Inc. | 0,01 | 175,53 | 0,93 | 224,91 | 0,1609 | 0,1080 | |||
| ETN / Eaton Corporation plc | 0,00 | 0,00 | 0,91 | 31,30 | 0,1575 | 0,0293 | |||
| MSCI / MSCI Inc. | 0,00 | 0,00 | 0,89 | 1,94 | 0,1553 | -0,0075 | |||
| BK / The Bank of New York Mellon Corporation | 0,01 | -35,77 | 0,87 | -30,27 | 0,1518 | -0,0807 | |||
| PLD / Prologis, Inc. | 0,01 | -8,86 | 0,87 | -14,27 | 0,1503 | -0,0372 | |||
| FUTU / Futu Holdings Limited - Depositary Receipt (Common Stock) | 0,01 | 0,00 | 0,86 | 20,70 | 0,1501 | 0,0172 | |||
| SLB / Schlumberger Limited | 0,02 | 73,94 | 0,83 | 40,64 | 0,1450 | 0,0348 | |||
| VRSK / Verisk Analytics, Inc. | 0,00 | 0,00 | 0,80 | 4,73 | 0,1385 | -0,0030 | |||
| UNH / UnitedHealth Group Incorporated | 0,00 | -0,40 | 0,78 | -40,64 | 0,1360 | -0,1091 | |||
| PG / The Procter & Gamble Company | 0,00 | 1,03 | 0,78 | -5,46 | 0,1353 | -0,0178 | |||
| PH / Parker-Hannifin Corporation | 0,00 | 0,00 | 0,78 | 14,99 | 0,1347 | 0,0094 | |||
| EPAM / EPAM Systems, Inc. | 0,00 | 0,00 | 0,77 | 4,77 | 0,1336 | -0,0028 | |||
| GILD / Gilead Sciences, Inc. | 0,01 | 1,19 | 0,76 | 0,13 | 0,1314 | -0,0089 | |||
| EMR / Emerson Electric Co. | 0,01 | 14,11 | 0,75 | 38,86 | 0,1311 | 0,0301 | |||
| TRU / TransUnion | 0,01 | 0,00 | 0,75 | 6,06 | 0,1307 | -0,0011 | |||
| SRE / Sempra | 0,01 | 0,00 | 0,74 | 6,16 | 0,1289 | -0,0009 | |||
| CDNS / Cadence Design Systems, Inc. | 0,00 | -47,87 | 0,72 | -36,88 | 0,1247 | -0,0864 | |||
| LMT / Lockheed Martin Corporation | 0,00 | 4,05 | 0,71 | 7,87 | 0,1239 | 0,0011 | |||
| DE / Deere & Company | 0,00 | 1,46 | 0,71 | 9,80 | 0,1228 | 0,0034 | |||
| SCHW / The Charles Schwab Corporation | 0,01 | 0,00 | 0,70 | 16,56 | 0,1224 | 0,0101 | |||
| BLK / BlackRock, Inc. | 0,00 | 0,00 | 0,69 | 10,90 | 0,1203 | 0,0043 | |||
| CME / CME Group Inc. | 0,00 | 5,51 | 0,69 | 9,58 | 0,1192 | 0,0030 | |||
| MCD / McDonald's Corporation | 0,00 | 5,45 | 0,68 | -1,46 | 0,1178 | -0,0099 | |||
| VGK / Vanguard International Equity Index Funds - Vanguard FTSE Europe ETF | 0,01 | -54,51 | 0,67 | -49,81 | 0,1165 | -0,1315 | |||
| LOW / Lowe's Companies, Inc. | 0,00 | 87,58 | 0,67 | 78,67 | 0,1164 | 0,0467 | |||
| CEG / Constellation Energy Corporation | 0,00 | 0,00 | 0,66 | 60,05 | 0,1149 | 0,0382 | |||
| CTVA / Corteva, Inc. | 0,01 | 0,00 | 0,66 | 18,46 | 0,1148 | 0,0112 | |||
| HON / Honeywell International Inc. | 0,00 | 5,62 | 0,66 | 16,11 | 0,1141 | 0,0091 | |||
| WM / Waste Management, Inc. | 0,00 | 0,00 | 0,65 | -1,22 | 0,1125 | -0,0092 | |||
| ZTS / Zoetis Inc. | 0,00 | -0,73 | 0,64 | -5,92 | 0,1105 | -0,0151 | |||
| CVX / Chevron Corporation | 0,00 | -9,78 | 0,63 | -22,80 | 0,1101 | -0,0423 | |||
| ALKT / Alkami Technology, Inc. | 0,02 | 0,00 | 0,63 | 14,84 | 0,1091 | 0,0075 | |||
| PSA / Public Storage | 0,00 | -15,81 | 0,62 | -17,57 | 0,1086 | -0,0320 | |||
| EL / The Estée Lauder Companies Inc. | 0,01 | 23,67 | 0,62 | 51,59 | 0,1078 | 0,0317 | |||
| FIS / Fidelity National Information Services, Inc. | 0,01 | 0,00 | 0,62 | 8,99 | 0,1075 | 0,0021 | |||
| MA / Mastercard Incorporated | 0,00 | 0,00 | 0,62 | 2,66 | 0,1074 | -0,0046 | |||
| TT / Trane Technologies plc | 0,00 | 0,00 | 0,62 | 29,68 | 0,1071 | 0,0189 | |||
| BR / Broadridge Financial Solutions, Inc. | 0,00 | 0,00 | 0,60 | 0,17 | 0,1039 | -0,0069 | |||
| SBUX / Starbucks Corporation | 0,01 | 0,00 | 0,59 | -6,64 | 0,1028 | -0,0148 | |||
| AMGN / Amgen Inc. | 0,00 | -48,59 | 0,58 | -53,97 | 0,1009 | -0,1332 | |||
| ED / Consolidated Edison, Inc. | 0,01 | 39,51 | 0,57 | 26,62 | 0,0985 | 0,0153 | |||
| MCK / McKesson Corporation | 0,00 | -20,21 | 0,55 | -13,13 | 0,0955 | -0,0220 | |||
| CTSH / Cognizant Technology Solutions Corporation | 0,01 | 16,98 | 0,54 | 19,33 | 0,0934 | 0,0097 | |||
| JCI / Johnson Controls International plc | 0,01 | 0,00 | 0,53 | 32,00 | 0,0917 | 0,0174 | |||
| TEL / TE Connectivity plc | 0,00 | 81,87 | 0,52 | 117,43 | 0,0911 | 0,0463 | |||
| CPAY / Corpay, Inc. | 0,00 | 0,00 | 0,52 | -4,96 | 0,0899 | -0,0111 | |||
| AVB / AvalonBay Communities, Inc. | 0,00 | 0,00 | 0,51 | -5,17 | 0,0894 | -0,0114 | |||
| PCAR / PACCAR Inc | 0,01 | -11,71 | 0,50 | -13,92 | 0,0872 | -0,0209 | |||
| ELV / Elevance Health, Inc. | 0,00 | 5,74 | 0,50 | -5,47 | 0,0872 | -0,0114 | |||
| CAH / Cardinal Health, Inc. | 0,00 | 0,00 | 0,49 | 21,73 | 0,0858 | 0,0106 | |||
| PNC / The PNC Financial Services Group, Inc. | 0,00 | -12,58 | 0,49 | -7,17 | 0,0855 | -0,0131 | |||
| PGR / The Progressive Corporation | 0,00 | 0,00 | 0,47 | -5,66 | 0,0811 | -0,0108 | |||
| IT / Gartner, Inc. | 0,00 | 0,00 | 0,45 | -3,83 | 0,0786 | -0,0086 | |||
| EQIX / Equinix, Inc. | 0,00 | 0,00 | 0,43 | -2,50 | 0,0746 | -0,0071 | |||
| BXP / Boston Properties, Inc. | 0,01 | 0,00 | 0,43 | 0,47 | 0,0742 | -0,0048 | |||
| VMC / Vulcan Materials Company | 0,00 | -23,47 | 0,43 | -14,31 | 0,0739 | -0,0184 | |||
| USB / U.S. Bancorp | 0,01 | 0,00 | 0,42 | 7,38 | 0,0733 | 0,0002 | |||
| GM / General Motors Company | 0,01 | -26,06 | 0,42 | -22,74 | 0,0727 | -0,0278 | |||
| CPRT / Copart, Inc. | 0,01 | -23,02 | 0,41 | -33,22 | 0,0713 | -0,0429 | |||
| SPG / Simon Property Group, Inc. | 0,00 | 0,00 | 0,40 | -3,17 | 0,0690 | -0,0072 | |||
| COR / Cencora, Inc. | 0,00 | 0,00 | 0,38 | 7,65 | 0,0662 | 0,0006 | |||
| ICE / Intercontinental Exchange, Inc. | 0,00 | -45,07 | 0,38 | -41,64 | 0,0657 | -0,0545 | |||
| APTV / Aptiv PLC | 0,01 | -14,37 | 0,38 | -1,82 | 0,0657 | -0,0058 | |||
| CMCSA / Comcast Corporation | 0,01 | -15,73 | 0,38 | -18,44 | 0,0654 | -0,0204 | |||
| MDLZ / Mondelez International, Inc. | 0,01 | 13,99 | 0,37 | 13,37 | 0,0649 | 0,0037 | |||
| EA / Electronic Arts Inc. | 0,00 | 0,00 | 0,37 | 10,61 | 0,0635 | 0,0021 | |||
| PYPL / PayPal Holdings, Inc. | 0,00 | 0,00 | 0,36 | 14,06 | 0,0621 | 0,0038 | |||
| G / Genpact Limited | 0,01 | 0,00 | 0,35 | -12,81 | 0,0604 | -0,0135 | |||
| PFE / Pfizer Inc. | 0,01 | -34,40 | 0,34 | -37,25 | 0,0594 | -0,0418 | |||
| BRK.B / Berkshire Hathaway Inc. | 0,00 | 0,00 | 0,34 | -8,60 | 0,0591 | -0,0102 | |||
| LC / LendingClub Corporation | 0,03 | -44,47 | 0,34 | -35,25 | 0,0588 | -0,0383 | |||
| DHI / D.R. Horton, Inc. | 0,00 | 0,78 | 0,33 | 2,16 | 0,0576 | -0,0026 | |||
| EMN / Eastman Chemical Company | 0,00 | 2,39 | 0,32 | -13,32 | 0,0555 | -0,0129 | |||
| DAVA / Endava plc - Depositary Receipt (Common Stock) | 0,02 | 54,15 | 0,32 | 21,37 | 0,0553 | 0,0065 | |||
| CB / Chubb Limited | 0,00 | 26,74 | 0,32 | 21,62 | 0,0549 | 0,0066 | |||
| TW / Tradeweb Markets Inc. | 0,00 | 0,00 | 0,31 | -1,27 | 0,0539 | -0,0045 | |||
| BEKE / KE Holdings Inc. - Depositary Receipt (Common Stock) | 0,02 | 0,00 | 0,31 | -11,68 | 0,0539 | -0,0113 | |||
| BABA / Alibaba Group Holding Limited - Depositary Receipt (Common Stock) | 0,00 | 0,00 | 0,31 | -14,17 | 0,0538 | -0,0132 | |||
| TGT / Target Corporation | 0,00 | -10,91 | 0,30 | -15,86 | 0,0518 | -0,0139 | |||
| AZO / AutoZone, Inc. | 0,00 | 33,33 | 0,30 | 29,82 | 0,0516 | 0,0091 | |||
| HDB / HDFC Bank Limited - Depositary Receipt (Common Stock) | 0,00 | 0,00 | 0,29 | 15,42 | 0,0507 | 0,0037 | |||
| PFG / Principal Financial Group, Inc. | 0,00 | 0,00 | 0,29 | -5,63 | 0,0495 | -0,0067 | |||
| PEP / PepsiCo, Inc. | 0,00 | -8,21 | 0,25 | -19,35 | 0,0436 | -0,0141 | |||
| OMC / Omnicom Group Inc. | 0,00 | 0,58 | 0,25 | -12,94 | 0,0434 | -0,0098 | |||
| STZ / Constellation Brands, Inc. | 0,00 | -33,92 | 0,24 | -41,35 | 0,0424 | -0,0350 | |||
| SO / The Southern Company | 0,00 | -5,68 | 0,23 | -5,79 | 0,0397 | -0,0054 | |||
| MET / MetLife, Inc. | 0,00 | -33,72 | 0,23 | -33,63 | 0,0395 | -0,0241 | |||
| AFL / Aflac Incorporated | 0,00 | 0,00 | 0,23 | -5,44 | 0,0394 | -0,0050 | |||
| ITUB / Itaú Unibanco Holding S.A. - Depositary Receipt (Common Stock) | 0,03 | -19,29 | 0,22 | -0,45 | 0,0381 | -0,0028 | |||
| VALE / Vale S.A. - Depositary Receipt (Common Stock) | 0,02 | -18,68 | 0,22 | -20,66 | 0,0374 | -0,0131 | |||
| ZBH / Zimmer Biomet Holdings, Inc. | 0,00 | -16,96 | 0,21 | -33,12 | 0,0372 | -0,0222 | |||
| XOM / Exxon Mobil Corporation | 0,00 | -12,62 | 0,20 | -20,87 | 0,0350 | -0,0122 | |||
| CPB / The Campbell's Company | 0,00 | -100,00 | 0,00 | 0,0000 | |||||
| WMB / The Williams Companies, Inc. | 0,00 | -100,00 | 0,00 | 0,0000 | |||||
| BDX / Becton, Dickinson and Company | 0,00 | -100,00 | 0,00 | 0,0000 | |||||
| PBR.A / Petróleo Brasileiro S.A. - Petrobras - Depositary Receipt (Common Stock) | 0,00 | -100,00 | 0,00 | 0,0000 | |||||
| FDX / FedEx Corporation | 0,00 | -100,00 | 0,00 | 0,0000 | |||||
| KNX / Knight-Swift Transportation Holdings Inc. | 0,00 | -100,00 | 0,00 | 0,0000 | |||||
| RPAY / Repay Holdings Corporation | 0,00 | -100,00 | 0,00 | 0,0000 | |||||
| EOG / EOG Resources, Inc. | 0,00 | -100,00 | 0,00 | 0,0000 | |||||
| AMT / American Tower Corporation | 0,00 | -100,00 | 0,00 | 0,0000 |