Grundlæggende statistik
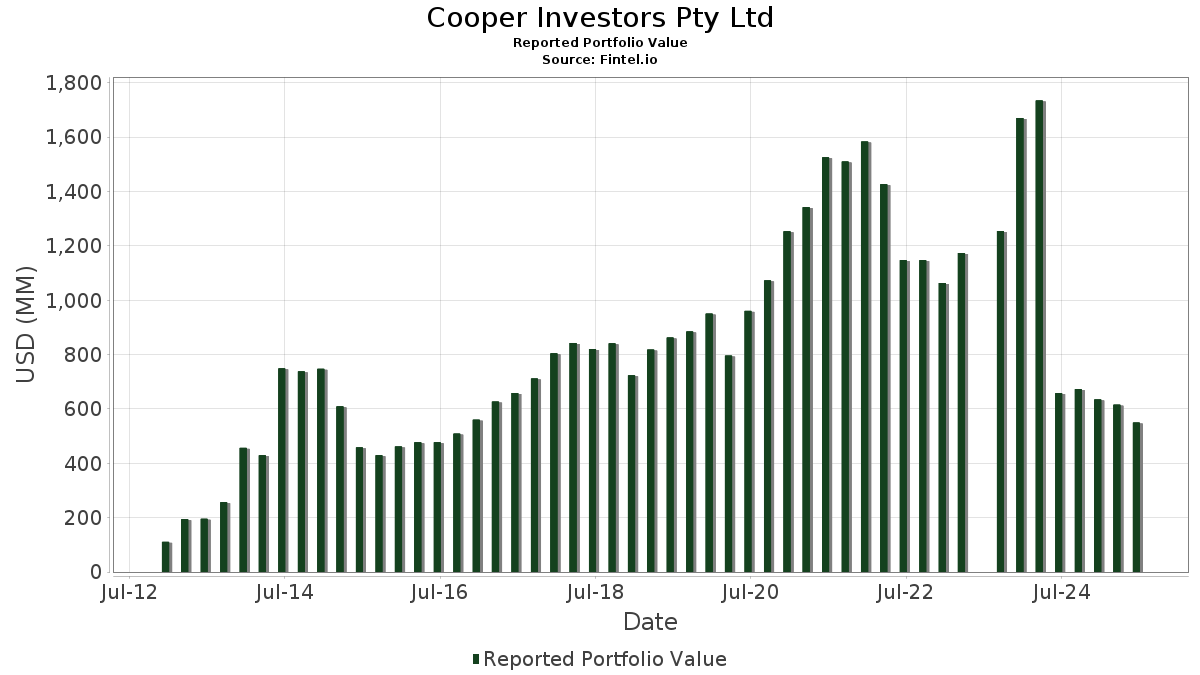
| Porteføljeværdi | $ 549.658.745 |
| Nuværende stillinger | 46 |
Seneste beholdninger, ydeevne, AUM (fra 13F, 13D)
Cooper Investors Pty Ltd har afsløret 46 samlede besiddelser i deres seneste SEC-arkivering. Den seneste porteføljeværdi er beregnet til at være $ 549.658.745 USD. Faktiske aktiver under forvaltning (AUM) er denne værdi plus kontanter (som ikke er oplyst). Cooper Investors Pty Ltds største beholdninger er News Corporation (US:NWSA) , Microsoft Corporation (US:MSFT) , CME Group Inc. (US:CME) , Visa Inc. (US:V) , and TKO Group Holdings, Inc. (US:TKO) . Cooper Investors Pty Ltds nye stillinger omfatter Reliance Industries Ltd. - GDR - 144A (US:RLNIY) , The Ensign Group, Inc. (US:ENSG) , .
Top øger dette kvartal
Vi bruger ændringen i porteføljeallokeringen, fordi dette er den mest meningsfulde metrik. Ændringer kan skyldes handler eller ændringer i aktiekurser.
| Sikkerhed | Aktier (MM) |
Værdi (MM$) |
Portefølje % | ΔPortefølje % |
|---|---|---|---|---|
| 0,37 | 19,84 | 3,6088 | 2,8346 | |
| 0,09 | 12,58 | 2,2895 | 2,2823 | |
| 0,14 | 26,18 | 4,7626 | 1,5376 | |
| 1,52 | 45,24 | 8,2313 | 1,4989 | |
| 0,20 | 21,17 | 3,8506 | 1,0727 | |
| 0,06 | 31,99 | 5,8193 | 0,9813 | |
| 0,06 | 5,24 | 0,9536 | 0,9536 | |
| 0,07 | 5,03 | 0,9151 | 0,9151 | |
| 0,06 | 4,37 | 0,7951 | 0,7951 | |
| 0,02 | 3,69 | 0,6720 | 0,6720 |
Top falder i dette kvartal
Vi bruger ændringen i porteføljeallokeringen, fordi dette er den mest meningsfulde metrik. Ændringer kan skyldes handler eller ændringer i aktiekurser.
| Sikkerhed | Aktier (MM) |
Værdi (MM$) |
Portefølje % | ΔPortefølje % |
|---|---|---|---|---|
| 0,25 | 9,03 | 1,6420 | -3,5631 | |
| 0,08 | 5,83 | 1,0598 | -1,7706 | |
| 0,03 | 4,67 | 0,8498 | -1,4173 | |
| 0,03 | 10,85 | 1,9734 | -0,8373 | |
| 0,07 | 12,64 | 2,2992 | -0,5456 | |
| 0,03 | 9,23 | 1,6786 | -0,4888 | |
| 0,05 | 6,57 | 1,1945 | -0,4333 | |
| 0,01 | 7,96 | 1,4487 | -0,3080 | |
| 0,08 | 28,76 | 5,2324 | -0,3068 | |
| 0,09 | 10,26 | 1,8666 | -0,2461 |
13F og Fondsarkivering
Denne formular blev indsendt den 2025-07-11 for rapporteringsperioden 2025-06-30. Klik på linkikonet for at se den fulde transaktionshistorik.
Opgrader for at låse op for premium-data og eksportere til Excel ![]() .
.
| Sikkerhed | Type | Gennemsnitlig aktiekurs | Aktier (MM) |
Δ Aktier (%) |
Δ Aktier (%) |
Værdi ($MM) |
Portefølje (%) |
ΔPortefølje (%) |
|
|---|---|---|---|---|---|---|---|---|---|
| NWSA / News Corporation | 1,52 | 0,00 | 45,24 | 9,18 | 8,2313 | 1,4989 | |||
| MSFT / Microsoft Corporation | 0,06 | -18,94 | 31,99 | 7,41 | 5,8193 | 0,9813 | |||
| CME / CME Group Inc. | 0,11 | -16,89 | 29,16 | -13,66 | 5,3055 | -0,1818 | |||
| V / Visa Inc. | 0,08 | -16,74 | 28,76 | -15,64 | 5,2324 | -0,3068 | |||
| TKO / TKO Group Holdings, Inc. | 0,14 | 10,76 | 26,18 | 31,88 | 4,7626 | 1,5376 | |||
| RYAN / Ryan Specialty Holdings, Inc. | 0,38 | 5,17 | 25,66 | -3,20 | 4,6693 | 0,3616 | |||
| FWONA / Formula One Group | 0,20 | 6,62 | 21,17 | 23,79 | 3,8506 | 1,0727 | |||
| WTW / Willis Towers Watson Public Limited Company | 0,07 | -5,21 | 20,83 | -14,03 | 3,7899 | -0,1468 | |||
| BSY / Bentley Systems, Incorporated | 0,37 | 203,43 | 19,84 | 316,26 | 3,6088 | 2,8346 | |||
| UNP / Union Pacific Corporation | 0,09 | -7,66 | 19,74 | -10,07 | 3,5906 | 0,0251 | |||
| SSNC / SS&C Technologies Holdings, Inc. | 0,21 | -13,44 | 17,59 | -14,20 | 3,1995 | -0,1306 | |||
| RPRX / Royalty Pharma plc | 0,41 | -0,57 | 14,92 | 15,09 | 2,7148 | 0,6081 | |||
| AMZN / Amazon.com, Inc. | 0,06 | -21,14 | 14,24 | -9,06 | 2,5904 | 0,0466 | |||
| GOOGL / Alphabet Inc. | 0,07 | -36,67 | 12,64 | -27,83 | 2,2992 | -0,5456 | |||
| SHAK / Shake Shack Inc. | 0,09 | 17.729,88 | 12,58 | 28.500,00 | 2,2895 | 2,2823 | |||
| HESM / Hess Midstream LP | 0,32 | -1,59 | 12,35 | -10,39 | 2,2472 | 0,0079 | |||
| AER / AerCap Holdings N.V. | 0,11 | -0,69 | 12,33 | 13,72 | 2,2433 | 0,4817 | |||
| AJG / Arthur J. Gallagher & Co. | 0,03 | -32,38 | 10,85 | -37,31 | 1,9734 | -0,8373 | |||
| BKNG / Booking Holdings Inc. | 0,00 | -30,61 | 10,29 | -12,81 | 1,8716 | -0,0452 | |||
| BRO / Brown & Brown, Inc. | 0,09 | -11,47 | 10,26 | -21,10 | 1,8666 | -0,2461 | |||
| MORN / Morningstar, Inc. | 0,03 | 27,06 | 9,73 | 33,03 | 1,7697 | 0,5816 | |||
| NWS / News Corporation | 0,28 | 18,97 | 9,62 | 34,40 | 1,7496 | 0,5871 | |||
| HDB / HDFC Bank Limited - Depositary Receipt (Common Stock) | 0,12 | -11,41 | 9,33 | 2,22 | 1,6976 | 0,2146 | |||
| ACN / Accenture plc | 0,03 | -27,80 | 9,23 | -30,84 | 1,6786 | -0,4888 | |||
| FYBR / Frontier Communications Parent, Inc. | 0,25 | -72,25 | 9,03 | -71,83 | 1,6420 | -3,5631 | |||
| ROP / Roper Technologies, Inc. | 0,01 | -23,40 | 7,96 | -26,36 | 1,4487 | -0,3080 | |||
| TXRH / Texas Roadhouse, Inc. | 0,04 | -8,92 | 7,69 | 2,44 | 1,3992 | 0,1795 | |||
| DHR / Danaher Corporation | 0,04 | 4,86 | 7,39 | 1,04 | 1,3454 | 0,1564 | |||
| CIGI / Colliers International Group Inc. | 0,05 | -39,11 | 6,57 | -34,47 | 1,1945 | -0,4333 | |||
| CLH / Clean Harbors, Inc. | 0,03 | 12,34 | 6,36 | 31,77 | 1,1575 | 0,3730 | |||
| PCTY / Paylocity Holding Corporation | 0,03 | -6,54 | 6,31 | -9,61 | 1,1483 | 0,0138 | |||
| WDAY / Workday, Inc. | 0,03 | 84,05 | 6,11 | 89,16 | 1,1110 | 0,5865 | |||
| GEHC / GE HealthCare Technologies Inc. | 0,08 | -63,56 | 5,83 | -66,56 | 1,0598 | -1,7706 | |||
| ADBE / Adobe Inc. | 0,01 | -23,20 | 5,51 | -22,52 | 1,0032 | -0,1532 | |||
| SBUX / Starbucks Corporation | 0,06 | 5,24 | 0,9536 | 0,9536 | |||||
| EFX / Equifax Inc. | 0,02 | -4,43 | 5,03 | 1,78 | 0,9160 | 0,1123 | |||
| PCOR / Procore Technologies, Inc. | 0,07 | 5,03 | 0,9151 | 0,9151 | |||||
| FWONA / Formula One Group | 0,05 | 14,02 | 4,94 | 32,91 | 0,8979 | 0,2945 | |||
| CDW / CDW Corporation | 0,03 | -69,96 | 4,67 | -66,53 | 0,8498 | -1,4173 | |||
| RLNIY / Reliance Industries Ltd. - GDR - 144A | 0,06 | 4,37 | 0,7951 | 0,7951 | |||||
| STVN / Stevanato Group S.p.A. | 0,17 | 21,97 | 4,10 | 45,96 | 0,7459 | 0,2894 | |||
| ENSG / The Ensign Group, Inc. | 0,02 | 3,69 | 0,6720 | 0,6720 | |||||
| PTLO / Portillo's Inc. | 0,31 | 34,19 | 3,64 | 31,70 | 0,6615 | 0,2130 | |||
| IBP / Installed Building Products, Inc. | 0,02 | -22,25 | 3,51 | -18,22 | 0,6384 | -0,0588 | |||
| AWK / American Water Works Company, Inc. | 0,01 | -15,37 | 1,15 | -20,15 | 0,2098 | -0,0250 | |||
| REXR / Rexford Industrial Realty, Inc. | 0,03 | 0,00 | 1,01 | -9,16 | 0,1840 | 0,0031 | |||
| CDRE / Cadre Holdings, Inc. | 0,00 | -100,00 | 0,00 | 0,0000 | |||||
| RXO / RXO, Inc. | 0,00 | -100,00 | 0,00 | 0,0000 | |||||
| NKE / NIKE, Inc. | 0,00 | -100,00 | 0,00 | 0,0000 | |||||
| KVUE / Kenvue Inc. | 0,00 | -100,00 | 0,00 | 0,0000 | |||||
| CPAY / Corpay, Inc. | 0,00 | -100,00 | 0,00 | 0,0000 |