Grundlæggende statistik
| Institutionelle ejere | 1642 total, 1636 long only, 0 short only, 6 long/short - change of 3,26% MRQ |
| Gennemsnitlig porteføljeallokering | 0.5355 % - change of -11,70% MRQ |
| Institutionelle aktier (lange) | 337.230.994 (ex 13D/G) - change of 7,78MM shares 2,36% MRQ |
| Institutionel værdi (lang) | $ 33.478.169 USD ($1000) |
Institutionelt ejerskab og aktionærer
iShares Trust - iShares National Muni Bond ETF (US:MUB) har 1642 institutionelle ejere og aktionærer, der har indsendt 13D/G- eller 13F-formularer til Securities Exchange Commission (SEC). Disse institutioner har i alt 337,230,994 aktier. Største aktionærer omfatter Bank Of America Corp /de/, Fmr Llc, Betterment LLC, Envestnet Asset Management Inc, Creative Planning, LPL Financial LLC, Fisher Asset Management, LLC, Wells Fargo & Company/mn, Morgan Stanley, and Mercer Global Advisors Inc /adv .
iShares Trust - iShares National Muni Bond ETF (ARCA:MUB) institutionel ejerskabsstruktur viser aktuelle positioner i virksomheden efter institutioner og fonde, samt seneste ændringer i positionsstørrelse. Større aktionærer kan omfatte individuelle investorer, investeringsforeninger, hedgefonde eller institutioner. Skema 13D angiver, at investoren besidder (eller besidder) mere end 5 % af virksomheden og har til hensigt (eller har til hensigt at) aktivt at forfølge en ændring i forretningsstrategi. Skema 13G indikerer en passiv investering på over 5%.
The share price as of April 23, 2026 is 107,33 / share. Previously, on April 24, 2025, the share price was 103,89 / share. This represents an increase of 3,31% over that period.

Fondens stemningsscore
Fund Sentiment Score (fka Ownership Accumulation Score) finder de aktier, der bliver mest købt af fonde. Det er resultatet af en sofistikeret, multi-faktor kvantitativ model, der identificerer virksomheder med de højeste niveauer af institutionel akkumulering. Scoringsmodellen bruger en kombination af den samlede stigning i oplyste ejere, ændringerne i porteføljeallokeringer i disse ejere og andre målinger. Tallet går fra 0 til 100, hvor højere tal indikerer et højere niveau af akkumulering for sine jævnaldrende, og 50 er gennemsnittet.
Opdateringsfrekvens: Dagligt
Se Ownership Explorer, som giver en liste over højest rangerende virksomheder.
AI+ Ask Fintel’s AI assistant about iShares Trust - iShares National Muni Bond ETF.
Select a question to share a public post with an AI-crafted answer.
Thinking of good questions…
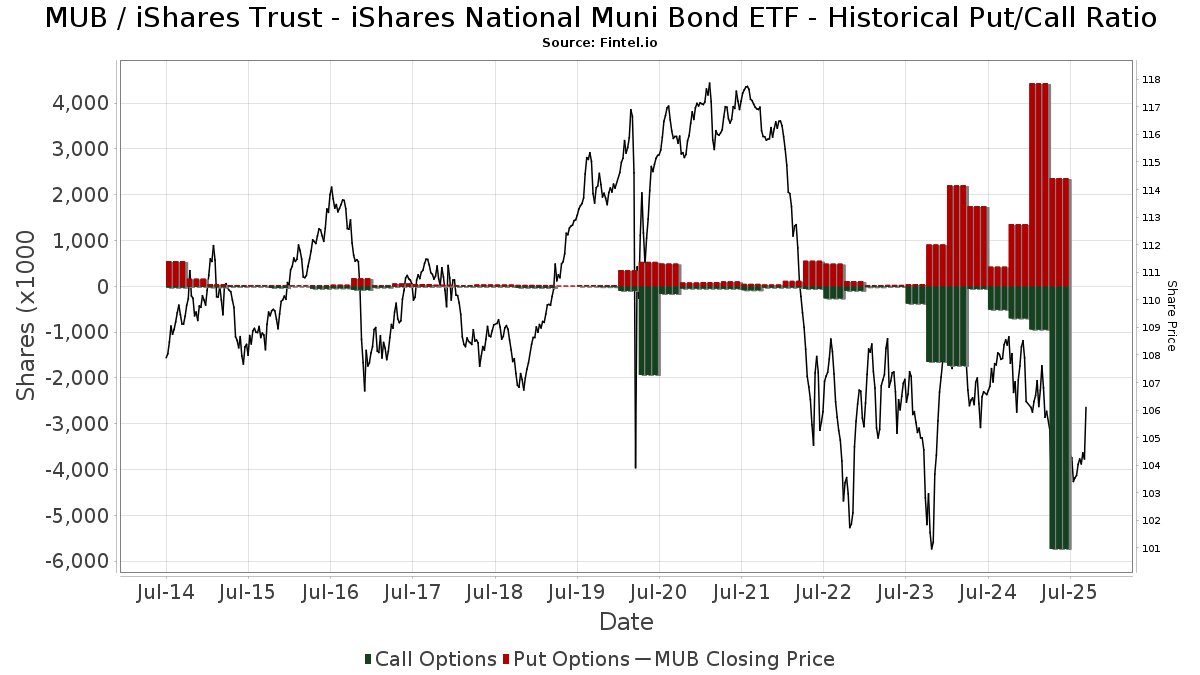
Institutionel Put/Call-forhold
Ud over at indberette standardaktie- og gældsudstedelser skal institutter med mere end 100 mill. aktiver under forvaltning også oplyse deres put- og call-optionsbeholdninger. Da salgsoptioner generelt indikerer negativ stemning, og købsoptioner indikerer positiv stemning, kan vi få en fornemmelse af den overordnede institutionelle stemning ved at plotte forholdet mellem put og kald. Diagrammet til højre viser det historiske put/call-forhold for dette instrument.
Brug af Put/Call Ratio som en indikator for investorernes stemning overvinder en af de vigtigste mangler ved at bruge totalt institutionelt ejerskab, som er, at en betydelig mængde af aktiver under forvaltning investeres passivt for at spore indekser. Passivt forvaltede fonde køber typisk ikke optioner, så indikatoren for put/call-forholdet følger mere nøje følelsen af aktivt forvaltede fonde.
13D/G-arkivering
Vi præsenterer 13D/G ansøgninger separat fra 13F ansøgninger på grund af den forskellige behandling af SEC. 13D/G-ansøgninger kan indgives af grupper af investorer (med én ledende), hvorimod 13F-ansøgninger ikke kan. Dette resulterer i situationer, hvor en investor kan indsende en 13D/G, der rapporterer én værdi for de samlede aktier (der repræsenterer alle de aktier, der ejes af investorgruppen), men derefter indsender en 13F, der rapporterer en anden værdi for de samlede aktier (der udelukkende repræsenterer deres egne) ejendomsret). Det betyder, at aktieejerskab af 13D/G-arkiver og 13F-arkiveringer ofte ikke er direkte sammenlignelige, så vi præsenterer dem separat.
Bemærk: Fra den 16. maj 2021 viser vi ikke længere ejere, der ikke har indsendt en 13D/G inden for det seneste år. Tidligere viste vi den fulde historie af 13D/G-arkiver. Generelt skal enheder, der er forpligtet til at indgive 13D/G-ansøgninger, indgive mindst årligt, før de indsender en afsluttende ansøgning. Dog forlader fonde nogle gange positioner uden at indsende en afsluttende ansøgning (dvs. de afvikler), så visning af den fulde historie resulterede nogle gange i forvirring om det nuværende ejerskab. For at undgå forvirring viser vi nu kun 'aktuelle' ejere - det vil sige - ejere, der har anmeldt inden for det seneste år.
Upgrade to unlock premium data.
13F og NPORT arkivering
Detaljer om 13F-arkivering er gratis. Detaljer om NP-ansøgninger kræver et premium-medlemskab. Grønne rækker angiver nye positioner. Røde rækker angiver lukkede positioner. Klik på linket ikon for at se den fulde transaktionshistorik.
Opgrader
for at låse premium-data op og eksportere til Excel ![]() .
.
Important Note
In an effort to reduce load times for our mobile users, we are testing some ways to deliver lighter pages.
In this first test, we will deliver only the most recent 750 transactions (out of 1852 for this stock). If you are interested in loading *all* the transactions for this company, click the "load all" button below. This is just a test and if you don't like it, please let us know by submitting some gentle feedback via the link at the bottom of this page.
Load All| Fil dato | Kilde | Investor | Type | Gennemsnitlig pris (Øst) |
Aktier | Δ Aktier (%) |
Rapporteret Værdi ($1000) |
Δ Værdi (%) |
Port Alloc (%) |
|
|---|---|---|---|---|---|---|---|---|---|---|
| 2026-04-22 | 13F | Romano Brothers And Company | 7.466 | 0,00 | 793 | -0,88 | ||||
| 2026-02-03 | 13F | Ballast Advisors Llc | 3.075 | 0,00 | 329 | 0,61 | ||||
| 2026-04-09 | 13F | Avenue 1 Advisors, LLC | 108.068 | -3,93 | 11.471 | -4,79 | ||||
| 2026-04-10 | 13F | Centurion Wealth Management LLC | 9.266 | 0,27 | 984 | -0,61 | ||||
| 2026-01-30 | 13F | Sofi Wealth, Llc | 631.789 | 9,35 | 67.671 | 9,98 | ||||
| 2026-04-22 | 13F | Atwater Malick LLC | 2.094 | 0,00 | 222 | -0,89 | ||||
| 2026-04-21 | 13F | Financial Consulate, Inc | 1.275 | 5.971,43 | 135 | 6.650,00 | ||||
| 2026-02-13 | 13F | Archetype Wealth Partners | 467.492 | -4,14 | 50 | -1,96 | ||||
| 2026-04-13 | 13F | 5T Wealth, LLC | 5.357 | 82,65 | 569 | 80,89 | ||||
| 2026-01-30 | 13F | Axis Wealth Partners, LLC | 2.745 | 2,73 | 294 | 3,52 | ||||
| 2026-04-20 | 13F | 25 Llc | 76.870 | 8,75 | 8.160 | 7,77 | ||||
| 2026-01-07 | 13F | IMPACTfolio, LLC | 80.456 | 6,59 | 8.618 | 7,20 | ||||
| 2026-02-13 | 13F | AlTi Global, Inc. | 109.490 | -21,91 | 11.728 | -21,46 | ||||
| 2026-02-17 | 13F | Cahill Financial Advisors Inc | 24.500 | 14,78 | 2.624 | 15,44 | ||||
| 2026-02-13 | 13F | Smartleaf Asset Management LLC | 43.466 | 46,73 | 4.655 | 47,68 | ||||
| 2026-02-13 | 13F | Soros Fund Management Llc | 241.400 | 0,00 | 25.856 | 0,58 | ||||
| 2026-02-10 | 13F | IFG Advisory, LLC | 35.139 | 39,00 | 3.764 | 39,84 | ||||
| 2026-02-28 | 13F | NCM Capital Management, LLC | 3.669 | -9,70 | 393 | -9,26 | ||||
| 2026-02-02 | 13F | Broussard Financial Group LLC | 2.615 | 280 | ||||||
| 2026-02-13 | 13F | Wells Fargo & Company/mn | 9.936.446 | -0,51 | 1.064.293 | 0,07 | ||||
| 2025-11-07 | 13F | Synovus Financial Corp | 41.166 | -1,52 | 4.384 | 0,37 | ||||
| 2026-04-08 | 13F | Miracle Mile Advisors, LLC | 57.214 | -63,35 | 6.073 | -63,67 | ||||
| 2026-02-13 | 13F | Manufacturers Life Insurance Company, The | 0 | -100,00 | 0 | |||||
| 2026-02-13 | 13F | Karpus Management, Inc. | 233 | 25 | ||||||
| 2026-01-26 | 13F | Slow Capital, Inc. | 202.919 | 9,71 | 21.735 | 10,35 | ||||
| 2026-02-02 | 13F | Ellis Investment Partners, LLC | 3.913 | -20,45 | 419 | -19,89 | ||||
| 2026-04-20 | 13F | Friedenthal Financial | 429 | 0,00 | 46 | 0,00 | ||||
| 2026-02-10 | 13F | Ellevest, Inc. | 110.702 | 2,88 | 11.857 | 3,48 | ||||
| 2026-04-17 | 13F/A | Founders Financial Securities Llc | 85.564 | 18,95 | 9.155 | 18,83 | ||||
| 2026-04-08 | 13F | Red Reef Advisors Llc | 147 | 16 | ||||||
| 2026-01-20 | 13F | Partners Wealth Management, Llc | 1.953 | 0,00 | 209 | 0,97 | ||||
| 2026-01-29 | 13F | Spurstone Advisory Services, LLC | 46 | 0,00 | 5 | 0,00 | ||||
| 2026-04-16 | 13F | Triad Wealth Partners, LLC | 100.580 | 43,98 | 10.677 | 42,69 | ||||
| 2026-01-16 | 13F | Verus Wealth Management, Llc | 117.216 | 1,46 | 12.555 | 2,05 | ||||
| 2026-02-05 | 13F | RiverFront Investment Group, LLC | 13.778 | 0,00 | 1.476 | 0,55 | ||||
| 2026-02-06 | 13F | Envestnet Portfolio Solutions, Inc. | 1.753.361 | 5,73 | 187.802 | 6,34 | ||||
| 2026-02-06 | 13F | Pnc Financial Services Group, Inc. | 7.336.158 | 1,08 | 785.776 | 1,67 | ||||
| 2026-02-09 | 13F | Carl P. Sherr & Co., LLC | 20.637 | 0,00 | 2.226 | 1,27 | ||||
| 2026-01-30 | 13F | Oakworth Capital, Inc. | 2.969 | -36,57 | 318 | -36,14 | ||||
| 2026-01-28 | 13F | Proathlete Wealth Management Llc | 63.461 | 9,64 | 6.812 | 10,50 | ||||
| 2026-01-29 | 13F | Quest 10 Wealth Builders, Inc. | 1.560 | 1,36 | 167 | 2,45 | ||||
| 2026-02-03 | 13F | Sequoia Financial Advisors, LLC | 1.766.391 | 3,61 | 189.198 | 4,22 | ||||
| 2026-04-22 | 13F | Aspire Private Capital, LLC | 29.949 | 3,27 | 3.179 | 2,35 | ||||
| 2026-01-27 | 13F | Regions Financial Corp | 178.770 | -1,60 | 19.148 | -1,02 | ||||
| 2026-04-22 | 13F | JNBA Financial Advisors | 8.170 | 0,00 | 867 | -0,91 | ||||
| 2026-02-09 | 13F | Interactive Financial Advisors | 3.351 | -0,92 | 359 | -0,56 | ||||
| 2026-04-23 | 13F | Kohmann Bosshard Financial Services, LLC | 6.205 | -3,62 | 659 | -4,50 | ||||
| 2026-01-26 | 13F | Key Capital Management, INC | 9.953 | 1.066 | ||||||
| 2026-01-30 | 13F | Sigma Planning Corp | 90.725 | -4,02 | 9.718 | -3,46 | ||||
| 2026-04-01 | 13F | Bangor Savings Bank | 9.970 | 0,00 | 1.058 | -0,84 | ||||
| 2026-04-15 | 13F | Founders Grove Wealth Partners, Llc | 10.299 | 2,45 | 1.093 | 1,58 | ||||
| 2025-11-14 | 13F | Binnacle Investments Inc | 3.569 | -2,81 | 380 | -0,78 | ||||
| 2026-04-08 | 13F | Cadent Capital Advisors, LLC | 5.443 | 0,52 | 578 | -0,35 | ||||
| 2026-01-20 | 13F | Nvwm, Llc | 4.568 | -0,50 | 489 | 0,20 | ||||
| 2026-02-17 | 13F | Russell Investments Group, Ltd. | 123.212 | 40,00 | 13.197 | 40,81 | ||||
| 2026-02-12 | 13F | von Borstel & Associates, Inc. | 0 | -100,00 | 0 | |||||
| 2026-01-30 | 13F | Activest Wealth Management | 0 | -100,00 | 0 | |||||
| 2026-02-12 | 13F | Strive Asset Management, LLC | 0 | -100,00 | 0 | |||||
| 2026-02-11 | 13F | MCF Advisors LLC | 24.241 | 2,28 | 2.596 | 2,89 | ||||
| 2026-04-09 | 13F | VERITY Wealth Advisors | 1.893 | 0,53 | 201 | -0,50 | ||||
| 2026-04-21 | 13F | Yardley Wealth Management LLC | 12.116 | -1,16 | 1.286 | -1,98 | ||||
| 2026-02-02 | 13F | GenTrust, LLC | 45.849 | -11,62 | 4.911 | -11,12 | ||||
| 2026-01-27 | 13F | Duncker Streett & Co Inc | 7.595 | 0,00 | 814 | 0,62 | ||||
| 2026-02-13 | 13F | United Bank | 11.012 | -30,88 | 1.179 | -30,48 | ||||
| 2026-02-02 | 13F | Ashton Thomas Securities, Llc | 0 | -100,00 | 0 | |||||
| 2026-02-06 | 13F | Addison Advisors LLC | 3 | 0,00 | 0 | |||||
| 2026-02-11 | 13F | MidWestOne Financial Group, Inc. | 227.052 | 394,35 | 24.320 | 397,32 | ||||
| 2026-01-27 | 13F | WealthCollab, LLC | 93.395 | 12,51 | 10.004 | 13,16 | ||||
| 2026-01-23 | 13F | Guidance Capital, Inc | 10.847 | -48,54 | 1.166 | -48,63 | ||||
| 2026-02-14 | 13F | Silver Grove Financial Group, Inc. | 15.447 | 4,06 | 1.655 | 4,68 | ||||
| 2026-04-23 | 13F | SevenBridge Financial Group, LLC | 32.074 | -7,03 | 3.442 | -7,35 | ||||
| 2026-01-23 | 13F | Diversify Advisory Services, LLC | 25.552 | -3,92 | 2.750 | -3,44 | ||||
| 2026-02-12 | 13F | StoneX Group Inc. | 19.213 | 58,97 | 2.057 | 59,75 | ||||
| 2026-04-16 | 13F | Rockland Trust Co | 0 | -100,00 | 0 | |||||
| 2026-02-03 | 13F | Smith & Howard Wealth Management, LLC | 92.350 | 2,82 | 9.892 | 3,41 | ||||
| 2026-04-07 | 13F | Hobart Private Capital, LLC | 52.349 | 14,62 | 5.557 | 13,60 | ||||
| 2026-01-27 | 13F | Berger Financial Group, Inc | 2.949 | -22,21 | 316 | -21,84 | ||||
| 2026-02-13 | 13F | SYM FINANCIAL Corp | 25 | 0,00 | 3 | 0,00 | ||||
| 2026-04-20 | 13F | Inscription Capital, LLC | 10.336 | -2,15 | 1.097 | -3,01 | ||||
| 2026-01-21 | 13F | Westfuller Advisors, LLC | 125 | 1,63 | 13 | 0,00 | ||||
| 2026-02-05 | 13F | Thrivent Financial For Lutherans | 360.674 | 2,11 | 39 | 2,70 | ||||
| 2026-02-09 | 13F | Integrity Alliance, Llc. | 5.986 | 85,90 | 641 | 87,43 | ||||
| 2026-02-17 | 13F | Modern Wealth Management, LLC | 23.243 | 27,79 | 2.490 | 28,56 | ||||
| 2026-02-12 | 13F | Litman Gregory Asset Management LLC | 800 | 86 | ||||||
| 2026-02-12 | 13F | Leigh Baldwin & Co., Llc | 0 | -100,00 | 0 | |||||
| 2026-02-13 | 13F | Capital Financial Group Inc\co\ /adv | 15.882 | 1.701 | ||||||
| 2026-02-17 | 13F | Warren Averett Asset Management, LLC | 117.485 | -5,75 | 12.584 | -5,21 | ||||
| 2026-02-12 | 13F | Keystone Financial Services | 12.344 | 1,89 | 1.322 | 2,48 | ||||
| 2025-11-05 | 13F | Lokken Investment Group LLC | 2.571 | -25,02 | 274 | -23,74 | ||||
| 2026-04-22 | 13F | Shotwell Rutter Baer Inc | 5.627 | -5,33 | 597 | -6,57 | ||||
| 2026-03-04 | 13F | Rehmann Capital Advisory Group | 15.241 | -17,73 | 1.632 | -17,24 | ||||
| 2026-02-09 | 13F | Fisher Asset Management, LLC | 10.713.817 | 10,16 | 1.147.557 | 10,80 | ||||
| 2026-02-17 | 13F | Captrust Financial Advisors | 1.217.656 | 1,13 | 130.423 | 1,72 | ||||
| 2026-01-07 | 13F | Sagespring Wealth Partners, Llc | 244.854 | 14,10 | 26.226 | 14,76 | ||||
| 2026-02-12 | 13F | Adviser Investments LLC | 2.366.971 | -1,19 | 253.526 | -0,61 | ||||
| 2026-01-26 | 13F | Thomasville National Bank | 2.322 | 249 | ||||||
| 2026-02-18 | 13F | Caitlin John, LLC | 338 | -10,58 | 36 | -10,00 | ||||
| 2025-11-14 | 13F | Wetherby Asset Management Inc | 8.394 | 1,60 | 894 | 3,48 | ||||
| 2026-03-11 | 13F | Downshift Financial, LLC | 2.854 | 308 | ||||||
| 2025-11-14 | 13F | Elequin Capital Lp | 0 | -100,00 | 0 | |||||
| 2026-04-06 | 13F | CX Institutional | 249.006 | 3,61 | 26 | 4,00 | ||||
| 2026-04-20 | 13F | CWA Asset Management Group, LLC | 88.144 | 5,87 | 9.356 | 4,92 | ||||
| 2026-02-11 | 13F | Shared Vision Wealth Group LLC | 12.559 | 14,15 | 1.352 | 14,29 | ||||
| 2026-04-16 | 13F | Capital Advisors, Ltd. LLC | 11.020 | 14,34 | 1 | 0,00 | ||||
| 2026-02-04 | 13F | AIFG Consultants Ltd. | 3.722 | -4,24 | 399 | -3,63 | ||||
| 2026-02-04 | 13F | Pandora Wealth, Inc. | 1.000 | 0,00 | 107 | 0,94 | ||||
| 2026-02-12 | 13F | Summit Financial, LLC | 81.508 | 7,98 | 8.730 | 8,61 | ||||
| 2025-12-08 | 13F | Tull Financial Group, Inc. | 0 | -100,00 | 0 | -100,00 | ||||
| 2026-04-08 | 13F | Exchange Bank | 51.505 | 0,25 | 5.467 | -0,64 | ||||
| 2026-01-20 | 13F | Austin Private Wealth, LLC | 35.051 | -30,99 | 3.754 | -30,58 | ||||
| 2026-02-13 | 13F | Sei Investments Co | 5.268.267 | 12,28 | 564.285 | 12,93 | ||||
| 2026-01-26 | 13F | PFG Investments, LLC | 7.668 | -3,66 | 821 | -3,07 | ||||
| 2026-02-17 | 13F | Stokes Family Office, LLC | 28.531 | 5,90 | 3.056 | 6,52 | ||||
| 2026-01-23 | 13F | Smith, Moore & Co. | 6.574 | 0,66 | 704 | 1,29 | ||||
| 2026-02-17 | 13F | Per Stirling Capital Management, LLC. | 21.096 | 0,99 | 2.260 | 1,57 | ||||
| 2026-01-20 | 13F | Savvy Advisors, Inc. | 272.482 | 36,95 | 29.186 | 37,75 | ||||
| 2026-04-14 | 13F | Prospera Financial Services Inc | 57.691 | 3,91 | 6.124 | 2,98 | ||||
| 2026-04-21 | 13F | Sage Financial Management Group, Inc. | 12.777 | -0,58 | 1.356 | -1,45 | ||||
| 2026-02-03 | 13F | NewEdge Wealth, LLC | 94.333 | -27,94 | 10.104 | -27,85 | ||||
| 2026-02-13 | 13F | Meridian Wealth Partners, LLC | 172.905 | -13,59 | 18.520 | -13,09 | ||||
| 2026-04-15 | 13F | Nations Financial Group Inc, /ia/ /adv | 8.182 | 13,07 | 869 | 12,00 | ||||
| 2026-02-09 | 13F | Allen Capital Group, LLC | 11.002 | -3,60 | 1.178 | -3,05 | ||||
| 2026-04-15 | 13F | Merit Financial Group, LLC | 255.935 | 11,84 | 27.167 | 10,84 | ||||
| 2026-02-11 | 13F | Sunrise Financial Services, LLC | 45 | 5 | ||||||
| 2026-02-17 | 13F | Bank Of America Corp /de/ | 37.349.821 | 11,26 | 4.000.539 | 11,91 | ||||
| 2026-04-20 | 13F | Focused Wealth Management, Inc | 2.318 | 0,26 | 246 | -0,40 | ||||
| 2026-02-13 | 13F | MAI Capital Management | 34.226 | 69,52 | 3.666 | 70,54 | ||||
| 2026-02-06 | 13F | Eqis Capital Management, Inc. | 0 | -100,00 | 0 | |||||
| 2026-02-12 | 13F | Keel Point, LLC | 9.492 | 2,31 | 1.017 | 2,83 | ||||
| 2026-04-20 | 13F | Greenup Street Wealth Management Llc | 10.734 | -15,81 | 1.139 | -16,56 | ||||
| 2026-02-12 | 13F | SWAN Capital LLC | 154 | 0,00 | 16 | 0,00 | ||||
| 2026-02-05 | 13F | Paulson Wealth Management Inc. | 4.485 | -26,00 | 480 | -25,58 | ||||
| 2026-01-23 | 13F | FSM Wealth Advisors, LLC | 17.575 | -17,15 | 1.883 | -16,65 | ||||
| 2026-04-13 | 13F | Physician Wealth Solutions Inc. | 25.069 | -0,04 | 2.661 | -0,93 | ||||
| 2026-02-10 | 13F | Peapack Gladstone Financial Corp | 243.190 | 12,02 | 26 | 13,04 | ||||
| 2026-04-08 | 13F | Erickson Financial Group, LLC | 4.322 | -1,05 | 459 | -1,93 | ||||
| 2026-01-30 | 13F | Simplicity Wealth,LLC | 78.413 | -12,63 | 8.399 | -12,13 | ||||
| 2026-02-13 | 13F | Kilter Group LLC | 11 | 1 | ||||||
| 2026-02-06 | 13F | Forum Private Client Group LLC | 3.339 | 7,54 | 358 | 8,18 | ||||
| 2025-11-13 | 13F | Wells Fargo & Company/mn | Call | 0 | -100,00 | 0 | -100,00 | |||
| 2026-01-22 | 13F | Castle Wealth Management Llc | 2.916 | 0,00 | 312 | 0,65 | ||||
| 2026-02-13 | 13F | Police & Firemen's Retirement System of New Jersey | 0 | -100,00 | 0 | |||||
| 2026-02-10 | 13F | COFG Advisors, LLC | 28.249 | 3.026 | ||||||
| 2026-04-16 | 13F | Paladin Wealth, LLC | 20.414 | 28,12 | 2.167 | 26,96 | ||||
| 2026-04-08 | 13F | Heritage Family Offices, LLP | 4.864 | 72,42 | 516 | 70,86 | ||||
| 2026-04-22 | 13F | Fearless Solutions, LLC dba Best Invest | 2.161 | 0,00 | 229 | -0,87 | ||||
| 2026-02-09 | 13F | Frazier Financial Advisors, LLC | 0 | 0 | ||||||
| 2026-02-02 | 13F | Legacy Edge Advisors, LLC | 237.517 | 25.440 | ||||||
| 2026-02-10 | 13F | Argent Trust Co | 2.997 | -26,67 | 321 | -26,21 | ||||
| 2026-04-15 | 13F | NorthAvenue LLC | 295 | -69,93 | 31 | -70,48 | ||||
| 2026-01-27 | 13F | Leisure Capital Management | 4.838 | 55,51 | 518 | 56,50 | ||||
| 2026-02-17 | 13F | Integrated Advisors Network LLC | 172.613 | 5,57 | 18.489 | 6,18 | ||||
| 2026-01-23 | 13F | Bowman & Co S.C. | 11.090 | -5,05 | 1.188 | -4,51 | ||||
| 2026-04-16 | 13F | Strategic Advisory Partners, Llc | 709 | 75 | ||||||
| 2026-04-22 | 13F | Clarity Wealth Development LLC | 2.143 | -1,24 | 227 | -2,16 | ||||
| 2026-04-15 | 13F | Cranbrook Wealth Management, LLC | 14.819 | 0,00 | 1.573 | -0,88 | ||||
| 2025-10-24 | 13F | Hemington Wealth Management | 10 | 0,00 | 0 | |||||
| 2026-02-05 | 13F | Lynx Investment Advisory | 2.064 | 221 | ||||||
| 2026-04-23 | 13F | Wheelhouse Advisory Group LLC | 1.996 | -9,52 | 212 | -10,59 | ||||
| 2026-04-10 | 13F | Impact Capital Partners LLC | 3.256 | 3,79 | 346 | 2,68 | ||||
| 2026-01-26 | 13F | Quadrant Private Wealth Management, LLC | 5.696 | 610 | ||||||
| 2026-02-03 | 13F | Vantage Financial Partners, LLC | 5.366 | 5,90 | 575 | 6,49 | ||||
| 2026-04-10 | 13F | Armstrong Advisory Group, Inc | 5.680 | -21,31 | 603 | -22,12 | ||||
| 2026-01-21 | 13F | Raleigh Capital Management Inc. | 1.991 | 1.363,97 | 213 | 1.421,43 | ||||
| 2026-04-21 | 13F | Red Tortoise LLC | 679 | 0,44 | 72 | 0,00 | ||||
| 2026-04-13 | 13F | Cogent Private Wealth, Inc. | 6.900 | 0,00 | 732 | -0,95 | ||||
| 2026-04-14 | 13F | LifeGoal Wealth Advisors | 4.706 | -27,14 | 500 | -27,64 | ||||
| 2026-02-11 | 13F | Rise Advisors, LLC | 0 | -100,00 | 0 | |||||
| 2026-01-30 | 13F | W.G. Shaheen & Associates DBA Whitney & Co | 0 | -100,00 | 0 | -100,00 | ||||
| 2026-02-05 | 13F | Clarion Wealth Managment Partners, LLC | 5.590 | -0,05 | 599 | 0,50 | ||||
| 2026-02-17 | 13F | High Falls Advisors, Inc | 66.390 | 7,77 | 7.111 | 8,42 | ||||
| 2026-04-13 | 13F | Bouchey Financial Group Ltd | 4.263 | 0,00 | 456 | 0,00 | ||||
| 2026-01-23 | 13F | Legacy Financial Strategies, LLC | 74.929 | 2,93 | 8.026 | 3,52 | ||||
| 2026-04-09 | 13F | C2P Capital Advisory Group, LLC d.b.a. Prosperity Capital Advisors | 25.168 | 54,34 | 2.672 | 52,98 | ||||
| 2026-01-29 | 13F | Dunhill Financial, LLC | 27 | 1.250,00 | ||||||
| 2026-01-22 | 13F | Vavra Capital Management, LLC | 6.517 | 698 | ||||||
| 2026-02-13 | 13F | Partners Capital Investment Group, Llp | 30.959 | 1,07 | 3.316 | 1,66 | ||||
| 2026-02-13 | 13F | Level Four Advisory Services, Llc | 28.149 | 1,19 | 3.015 | 1,79 | ||||
| 2026-02-17 | 13F | Cardiff Park Advisors, Llc | 2.551 | 0,63 | 273 | 1,49 | ||||
| 2026-02-17 | 13F | NewSquare Capital LLC | 5.804 | -89,73 | 622 | -89,68 | ||||
| 2026-02-06 | 13F | Cullen/frost Bankers, Inc. | 55.359 | 1.674,33 | 5.929 | 1.685,84 | ||||
| 2026-02-24 | 13F | MidFirst Bank | 33.282 | 3.565 | ||||||
| 2026-04-22 | 13F | Patriot Financial Group Insurance Agency, LLC | 7.652 | 97,68 | 812 | 96,14 | ||||
| 2026-04-23 | 13F | Farmers & Merchants Investments Inc | 1.489 | 77,90 | 158 | 77,53 | ||||
| 2026-04-21 | 13F | Wesbanco Bank Inc | 260.726 | 10,27 | 27.676 | 9,29 | ||||
| 2026-01-20 | 13F | Ethos Financial Group, LLC | 25.241 | -0,21 | 2.704 | 0,37 | ||||
| 2026-02-03 | 13F | Baker Boyer National Bank | 2.560 | 0,00 | 274 | 0,74 | ||||
| 2026-04-22 | 13F | Evensky & Katz LLC | 4.972 | 41,37 | 1 | |||||
| 2026-02-02 | 13F | Blalock Williams, Llc | 2.239 | 13,71 | 240 | 14,35 | ||||
| 2026-01-08 | 13F | Signet Financial Management, Llc | 7.252 | 34,15 | 777 | 34,96 | ||||
| 2026-02-09 | 13F | V. M. Manning & Co., Inc. | 2.500 | 268 | ||||||
| 2026-02-17 | 13F | Lazard Asset Management Llc | 30.408 | 0,60 | 3.257 | 1,21 | ||||
| 2026-04-06 | 13F | Hiley Hunt Wealth Management | 3.666 | -0,78 | 389 | -1,52 | ||||
| 2026-04-13 | 13F | Hm Payson & Co | 4.312 | 0,00 | 458 | -0,87 | ||||
| 2026-01-12 | 13F | Sentinel Pension Advisors Inc | 0 | -100,00 | 0 | |||||
| 2026-03-16 | 13F | Osbon Capital Management Llc | 0 | -100,00 | 0 | |||||
| 2026-02-20 | 13F | Kovitz Investment Group Partners, LLC | 26.391 | -86,20 | 2.827 | -86,12 | ||||
| 2026-04-09 | 13F | Nelson, Van Denburg & Campbell Wealth Management Group, LLC | 220.186 | -12,98 | 23.362 | -13,76 | ||||
| 2026-01-21 | 13F | Fulton Breakefield Broenniman Llc | 62.844 | 3,20 | 6.731 | 3,81 | ||||
| 2026-04-09 | 13F | Goelzer Investment Management, Inc. | 2.069 | 0,00 | 220 | -0,90 | ||||
| 2026-02-09 | 13F | Northstar Financial Companies, Inc. | 4.793 | 67,18 | 513 | 68,20 | ||||
| 2026-01-27 | 13F | Elevate Wealth Advisory, Inc | 6.103 | 0,00 | 654 | 0,62 | ||||
| 2026-04-15 | 13F | Occidental Asset Management, LLC | 4.394 | 0,00 | 466 | -0,85 | ||||
| 2026-01-29 | 13F | Comerica Bank | 407.499 | 2,06 | 43.647 | 2,65 | ||||
| 2026-04-20 | 13F | Jfs Wealth Advisors, Llc | 385.993 | 1,08 | 40.973 | 0,18 | ||||
| 2026-02-17 | 13F | Mercer Global Advisors Inc /adv | 8.549.244 | 13,81 | 915.710 | 14,48 | ||||
| 2026-01-23 | 13F | Family Investment Center, Inc. | 2.723 | 0,00 | 292 | 0,34 | ||||
| 2025-11-06 | 13F | CBIZ Investment Advisory Services, LLC | 0 | -100,00 | 0 | |||||
| 2026-02-04 | 13F | Valeo Financial Advisors, LLC | 55.778 | 26,11 | 5.974 | 26,86 | ||||
| 2026-04-10 | 13F | Capital Advantage, Inc. | 0 | -100,00 | 0 | |||||
| 2026-02-17 | 13F | Harvey Capital Management Inc | 0 | -100,00 | 0 | |||||
| 2025-10-31 | 13F | First Command Advisory Services, Inc. | 0 | -100,00 | 0 | |||||
| 2026-04-22 | 13F | TPG Advisors LLC | 13.398 | 0,00 | 1.422 | -0,91 | ||||
| 2026-02-06 | 13F | Mach-1 Financial Group, Inc. | 0 | -100,00 | 0 | |||||
| 2026-02-12 | 13F | BRYN MAWR TRUST Co | 7.588 | 658,80 | 813 | 666,04 | ||||
| 2026-04-21 | 13F | North Forty Two & Co. | 10.381 | -7,98 | 1.102 | -8,86 | ||||
| 2026-04-22 | 13F | Vicus Capital | 183.680 | 4,07 | 19.498 | 3,14 | ||||
| 2026-04-07 | 13F | Heartwood Wealth Advisors LLC | 11.911 | -2,50 | 1.264 | -3,36 | ||||
| 2026-02-09 | 13F | Huntington National Bank | 26.447 | 6,87 | ||||||
| 2026-02-13 | 13F | Delos Wealth Advisors, LLC | 2.065 | 0,00 | 221 | 0,91 | ||||
| 2026-04-21 | 13F | Oak Wealth Advisors LLC | 11.028 | -1,84 | 1.171 | -2,74 | ||||
| 2026-04-21 | 13F | Topsail Wealth Management, LLC | 40.729 | 21,09 | 4.323 | 20,02 | ||||
| 2026-02-06 | 13F | BlueStem Wealth Partners, LLC | 3.764 | -6,48 | 403 | -5,84 | ||||
| 2026-02-09 | 13F | Harbour Investments, Inc. | 10.847 | -2,70 | 1.162 | -2,19 | ||||
| 2026-01-23 | 13F | Inlight Wealth Management, LLC | 445 | 28,99 | 48 | 30,56 | ||||
| 2026-01-30 | 13F | Durante & Waters, Llc | 38.524 | -1,00 | 4.126 | -0,41 | ||||
| 2026-02-12 | 13F | Altiora Financial Group, LLC | 0 | -100,00 | 0 | |||||
| 2026-02-05 | 13F | Compass Financial Group, Inc. | 10.637 | -0,35 | 1.139 | 0,26 | ||||
| 2026-04-16 | 13F | Henrickson Nauta Wealth Advisors, Inc. | 2.618 | 278 | ||||||
| 2026-04-07 | 13F | First Citizens Financial Corp | 2.434 | 29,74 | 258 | 29,00 | ||||
| 2026-02-02 | 13F | Robertson Stephens Wealth Management, LLC | 128.103 | 8,50 | 13.721 | 9,14 | ||||
| 2026-02-17 | 13F | Creative Planning | 13.555.369 | 2,76 | 1.451.916 | 3,36 | ||||
| 2026-02-10 | 13F | Syntegra Private Wealth Group, LLC | 6.929 | -2,90 | 742 | -2,24 | ||||
| 2026-04-13 | 13F | Mkd Wealth Coaches, Llc | 21.808 | 1,71 | 2.315 | 0,78 | ||||
| 2026-04-23 | 13F | Columbia Advisory Partners Llc | 2.929 | -17,61 | 311 | -18,42 | ||||
| 2026-02-10 | 13F | DT Investment Partners, LLC | 763 | 105,11 | 82 | 107,69 | ||||
| 2026-01-12 | 13F | VisionPoint Advisory Group, LLC | 5.279 | 3,05 | 565 | 3,67 | ||||
| 2026-04-17 | 13F | 55 North Private Wealth, LLC | 2.772 | 0,00 | 294 | -0,68 | ||||
| 2026-02-17 | 13F | Lakeshore Financial Planning, Inc. | 1.892 | -3,81 | 203 | -3,35 | ||||
| 2026-02-10 | 13F | Basepoint Wealth LLC | 494 | 53 | ||||||
| 2026-01-16 | 13F | Crewe Advisors LLC | 215.722 | 3,08 | 23.106 | 3,67 | ||||
| 2026-02-06 | 13F | Bare Financial Services, Inc | 53.313 | 52,51 | 5.710 | 53,41 | ||||
| 2026-04-13 | 13F | Arwa Llc | 2.599 | -23,13 | 278 | -23,20 | ||||
| 2026-04-21 | 13F | Pflug Koory, LLC | 510 | 0,39 | 54 | 0,00 | ||||
| 2026-02-13 | 13F | LiftPoint Family Wealth Advisors LLC | 31.313 | 3.354 | ||||||
| 2026-04-17 | 13F | Presilium Private Wealth, Llc | 58.409 | 5,42 | 6.200 | 4,48 | ||||
| 2026-04-15 | 13F | Single Point Partners, LLC | 129.797 | 0,21 | 13.778 | -0,70 | ||||
| 2026-04-17 | 13F | Defined Wealth Management, Llc | 2.043 | 0,74 | 217 | -0,46 | ||||
| 2026-04-20 | 13F | Independent Wealth Network Inc. | 3.555 | 5,93 | 377 | 5,01 | ||||
| 2026-01-15 | 13F | Saxony Capital Management, LLC | 17.529 | 1.878 | ||||||
| 2026-02-05 | 13F | Avantax Planning Partners, Inc. | 502.707 | 9,57 | 53.845 | 10,21 | ||||
| 2026-02-13 | 13F | Financial Sense Advisors, Inc. | 6.824 | 1,44 | 731 | 1,96 | ||||
| 2026-02-03 | 13F | Arcadia Wealth Management, LLC | 25.605 | 3,01 | 2.743 | 3,59 | ||||
| 2026-02-06 | 13F | Vestmark Advisory Solutions, Inc. | 167.945 | -10,56 | 17.989 | -10,04 | ||||
| 2026-04-20 | 13F | Sowell Financial Services LLC | 8.295 | 4,88 | 881 | 3,90 | ||||
| 2026-04-07 | 13F | Twele Capital Management, Inc. | 11.169 | -0,39 | 1.186 | -1,33 | ||||
| 2026-04-16 | 13F | True Vision MN LLC | 55.118 | 17,17 | 5.851 | 16,12 | ||||
| 2026-04-23 | 13F | Harbour Investment Management Llc | 5.370 | 0,00 | 570 | -0,87 | ||||
| 2026-02-04 | 13F | Hirtle Callaghan & Co LLC | 11.779 | 82,89 | ||||||
| 2026-02-12 | 13F | Rossby Financial, LCC | 2.122 | 8,99 | 227 | 9,66 | ||||
| 2026-04-03 | 13F | Investors Research Corp | 139 | 0,00 | 15 | 0,00 | ||||
| 2026-04-10 | 13F | Insight Wealth Strategies, LLC | 39.438 | 5,82 | 4.186 | 4,89 | ||||
| 2026-04-06 | 13F | Sincerus Advisory, LLC | 52.415 | 22,90 | 5.564 | 21,78 | ||||
| 2026-02-13 | 13F | Ausdal Financial Partners, Inc. | 13.226 | -3,21 | 1.417 | -2,68 | ||||
| 2026-04-17 | 13F | Stephenson National Bank & Trust | 0 | -100,00 | 0 | |||||
| 2026-02-17 | 13F | First Manhattan Co | 2.354 | 252 | ||||||
| 2026-04-20 | 13F | Leeward Financial Partners, LLC | 40.967 | 0,35 | 4.349 | -0,55 | ||||
| 2026-01-23 | 13F | Sage Mountain Advisors LLC | 4.670 | 3,39 | 500 | 3,95 | ||||
| 2026-02-12 | 13F | Wescott Financial Advisory Group, LLC | 3.470 | -12,35 | 372 | -11,88 | ||||
| 2026-04-02 | 13F | Stairway Partners, LLC | 173.332 | 0,09 | 18.399 | -0,80 | ||||
| 2026-01-20 | 13F | Stratos Wealth Partners, LTD. | 259.988 | 13,56 | 27.847 | 14,23 | ||||
| 2026-04-22 | 13F | Janney Montgomery Scott LLC | 233.162 | 11,59 | 25 | 9,09 | ||||
| 2026-04-17 | 13F | James J. Burns & Company, LLC | 7.020 | -2,11 | 745 | -2,99 | ||||
| 2026-04-23 | 13F | Graver Capital Management, LLC | 26.965 | 4,14 | 2.862 | 3,21 | ||||
| 2026-04-17 | 13F | First National Bank Sioux Falls | 11.870 | -5,43 | 1.270 | -5,58 | ||||
| 2026-01-23 | 13F | Galvin, Gaustad & Stein, LLC | 41.098 | 6,09 | 4.402 | 6,72 | ||||
| 2026-02-13 | 13F | Avid Wealth Partners LLC | 36.821 | -9,20 | 3.944 | -8,68 | ||||
| 2026-02-12 | 13F | Principal Securities, Inc. | 88.265 | 13,93 | 9.454 | 14,59 | ||||
| 2026-04-22 | 13F | Joel Isaacson & Co., LLC | 60.169 | 27,78 | 6.387 | 26,63 | ||||
| 2026-03-02 | 13F | Clearwave Capital, LLC | 2.238 | 240 | ||||||
| 2026-01-27 | 13F | Sage Financial Group Inc | 18.080 | -9,97 | 1.937 | -9,45 | ||||
| 2026-02-17 | 13F | Main Street Financial Solutions, LLC | 17.005 | -0,64 | 1.821 | -0,05 | ||||
| 2025-11-13 | 13F | Quadrature Capital Ltd | 0 | -100,00 | 0 | -100,00 | ||||
| 2026-04-14 | 13F | Beacon Investment Advisory Services, Inc. | 134 | 14 | ||||||
| 2026-02-17 | 13F | D. E. Shaw & Co., Inc. | 74.906 | -69,55 | 8.023 | -69,37 | ||||
| 2026-01-26 | 13F | Keystone Wealth Services, LLC | 16.171 | -4,29 | 1.732 | -3,72 | ||||
| 2026-01-23 | 13F | Gibbs Wealth Management | 8.479 | 1,61 | 913 | 2,70 | ||||
| 2026-04-23 | 13F | J.w. Cole Advisors, Inc. | 0 | -100,00 | 0 | |||||
| 2026-02-13 | 13F | Graybill Bartz & Assoc Ltd | 12.097 | 87,35 | 1.296 | 88,50 | ||||
| 2026-01-27 | 13F | Meritage Portfolio Management | 13.065 | -4,40 | 1.399 | -3,85 | ||||
| 2026-02-09 | 13F | Green Square Capital Advisors Llc | 3.411 | -69,02 | 365 | -68,26 | ||||
| 2026-02-17 | 13F | Fmr Llc | 22.297.884 | 0,60 | 2.388.326 | 1,18 | ||||
| 2026-02-17 | 13F | Keebeck Wealth Management, LLC | 74.241 | 18,68 | 7.952 | 19,37 | ||||
| 2026-04-23 | 13F | Conscious Wealth Investments, Llc | 5.798 | 1,86 | 620 | 0,98 | ||||
| 2026-01-16 | 13F | Five Oceans Advisors | 0 | -100,00 | 0 | |||||
| 2026-01-27 | 13F | Rainey & Randall Investment Management Inc. | 0 | -100,00 | 0 | |||||
| 2026-02-12 | 13F | Andina Capital Management, LLC | 0 | -100,00 | 0 | |||||
| 2026-04-21 | 13F | Trust Co Of Virginia /va | 16.446 | 42,54 | 1.746 | 41,30 | ||||
| 2026-01-13 | 13F | Stephens Consulting, LLC | 7.398 | 0,00 | 792 | 0,64 | ||||
| 2026-04-22 | 13F | Sutton Place Investors Llc | 5.251 | -5,30 | 557 | -6,07 | ||||
| 2026-01-21 | 13F | MBL Wealth, LLC | 2.268 | 243 | ||||||
| 2026-02-12 | 13F | Insigneo Advisory Services, Llc | 5.123 | 549 | ||||||
| 2026-02-11 | 13F | Premier Private Wealth Management LLC | 2.548 | 274 | ||||||
| 2025-11-12 | 13F | Clare Market Investments LLC | 2.000 | 213 | ||||||
| 2026-02-23 | 13F | Wealth Preservation Advisors, LLC | 0 | -100,00 | 0 | |||||
| 2026-02-17 | 13F | Northeast Financial Group, Inc. | 151.489 | 9,78 | 16.227 | 10,42 | ||||
| 2026-04-09 | 13F | Cliftonlarsonallen Wealth Advisors, Llc | 535.118 | -8,06 | 56.803 | -8,88 | ||||
| 2026-02-13 | 13F | Colony Group, LLC | 1.198.803 | 15,30 | 128.125 | 15,67 | ||||
| 2026-02-03 | 13F | Sigma Investment Counselors Inc | 4.434 | 0,00 | 475 | 0,42 | ||||
| 2026-02-13 | 13F | Plum Street Advisors, LLC | 27.110 | 18,27 | 2.904 | 18,93 | ||||
| 2026-01-27 | 13F | Lodestar Private Asset Management Llc | 8.442 | -3,84 | 904 | -3,21 | ||||
| 2026-02-09 | 13F | Clearwater Capital Advisors, LLC | 134.078 | -11,92 | 14.361 | -11,40 | ||||
| 2026-01-28 | 13F | Kanawha Capital Management Llc | 2.213 | -4,94 | 237 | -4,05 | ||||
| 2026-04-07 | 13F/A | Round Rock Advisors, LLC | 2.665 | 0,00 | 285 | 0,71 | ||||
| 2026-01-15 | 13F | Capital Advisors Inc/ok | 1.870 | 200 | ||||||
| 2026-02-05 | 13F | AlphaCore Capital LLC | 15.191 | 0,75 | 1.627 | 1,37 | ||||
| 2026-02-02 | 13F | Avidian Wealth Solutions, LLC | 39.477 | 1,80 | 4.228 | 2,40 | ||||
| 2026-02-04 | 13F | Tsfg, Llc | 7.846 | 1,19 | 1 | |||||
| 2025-10-28 | 13F | Country Trust Bank | 0 | -100,00 | 0 | |||||
| 2026-04-13 | 13F | Uptown Financial Advisors LLC | 5.518 | 0,00 | 586 | -1,02 | ||||
| 2026-02-17 | 13F | Ibex Wealth Advisors | 0 | -100,00 | 0 | |||||
| 2026-02-13 | 13F | Toroso Investments, LLC | 39.960 | 0,00 | 4.280 | 0,85 | ||||
| 2026-01-27 | 13F | Fiscal Wisdom Wealth Management, LLC | 3.440 | 1,47 | 368 | 1,10 | ||||
| 2026-02-09 | 13F | Millington Financial Advisors, LLC | 1.917 | -32,76 | 206 | -32,46 | ||||
| 2026-04-21 | 13F | Narus Financial Partners, LLC | 26.852 | 4,40 | 2.850 | 3,45 | ||||
| 2026-02-17 | 13F | Snowden Capital Advisors LLC | 29.580 | 20,39 | 3.168 | 21,10 | ||||
| 2026-04-02 | 13F | Collective Family Office Llc | 14.361 | -7,20 | 1.524 | -8,03 | ||||
| 2026-04-15 | 13F | BDFS Capital LLC | 7.505 | 32,53 | 797 | 31,35 | ||||
| 2025-11-13 | 13F | Promus Capital, LLC | 1.550 | 0,00 | 165 | 2,48 | ||||
| 2026-04-14 | 13F | Affiance Financial, LLC | 9.473 | -11,67 | 1.006 | -12,46 | ||||
| 2025-11-14 | 13F | Polar Asset Management Partners Inc. | 0 | -100,00 | 0 | |||||
| 2026-02-13 | 13F | Neuberger Berman Group LLC | 12.795 | 8,88 | 1.370 | 9,51 | ||||
| 2026-01-30 | 13F | Strategic Blueprint, LLC | 42.358 | -10,80 | 4.537 | -10,28 | ||||
| 2026-01-29 | 13F | DecisionPoint Financial, LLC | 0 | -100,00 | 0 | |||||
| 2026-01-29 | 13F | Quent Capital, LLC | 1.119 | 7,39 | 120 | 8,18 | ||||
| 2026-04-13 | 13F | Lee Financial Co | 2.807 | 2,56 | 298 | 1,37 | ||||
| 2026-01-13 | 13F | ForthRight Wealth Management, LLC | 9.337 | 0,00 | 1.000 | 0,60 | ||||
| 2026-02-17 | 13F | LMR Partners LLP | Put | 0 | -100,00 | 0 | ||||
| 2026-01-20 | 13F | Independence Bank of Kentucky | 11.617 | -3,43 | 1.244 | -2,81 | ||||
| 2026-02-13 | 13F | Mariner, LLC | 2.048.932 | 9,10 | 219.461 | 9,74 | ||||
| 2026-04-22 | 13F | Bravera Wealth | 1.226 | 0,00 | 130 | -0,76 | ||||
| 2026-04-13 | 13F | Foster Group, Inc. | 542.700 | 10,42 | 57.608 | 9,43 | ||||
| 2026-02-17 | 13F | Fairview Capital Investment Management, Llc | 56.550 | 0,00 | 6.057 | 0,58 | ||||
| 2026-04-20 | 13F | Cardinal Strategic Wealth Guidance | 177.441 | -2,69 | 18.835 | -3,56 | ||||
| 2026-04-22 | 13F | Kennedy Investment Group | 0 | -100,00 | 0 | |||||
| 2026-01-29 | 13F | D.a. Davidson & Co. | 11.156 | -10,23 | 1.195 | -9,75 | ||||
| 2026-01-27 | 13F | Keeler & Nadler Financial Planning & Wealth Management | 18.682 | 33,19 | 2.001 | 34,03 | ||||
| 2026-02-09 | 13F | Regimen Wealth, Llc | 17.401 | 1,03 | 1.864 | 1,58 | ||||
| 2026-02-06 | 13F | Americana Partners, LLC | 26.469 | 0,09 | 2.835 | 0,71 | ||||
| 2026-01-13 | 13F | Two West Capital Advisors LLC | 10.266 | 3,21 | 1.100 | 2,71 | ||||
| 2026-01-07 | 13F | Innova Wealth Partners | 2.250 | -20,21 | 241 | -20,00 | ||||
| 2026-01-12 | 13F | CVA Family Office, LLC | 26.573 | 3,34 | 2.846 | 3,94 | ||||
| 2026-02-05 | 13F | Atria Investments Llc | 99.125 | 21,91 | 10.617 | 22,63 | ||||
| 2026-01-27 | 13F | Sterling Investment Counsel, LLC | 0 | -100,00 | 0 | |||||
| 2026-02-06 | 13F | First Business Financial Services, Inc. | 45.130 | 3,38 | 4.834 | 3,98 | ||||
| 2026-04-15 | 13F | Riversedge Advisors, Llc | 13.189 | -11,50 | 1.400 | -12,28 | ||||
| 2026-02-02 | 13F | Partners in Financial Planning | 55.813 | 10,56 | 5.978 | 11,20 | ||||
| 2026-02-17 | 13F | Power Wealth Management Llc | 19.468 | -1,33 | 2.085 | -0,76 | ||||
| 2026-01-23 | 13F | Assetmark, Inc | 3.067.392 | 5,65 | 328.548 | 6,27 | ||||
| 2026-02-03 | 13F | Apeiron RIA LLC | 102.961 | -1,51 | 11.054 | -0,85 | ||||
| 2026-02-05 | 13F | Armor Investment Advisors, LLC | 48.872 | 4,36 | 5.235 | 4,95 | ||||
| 2026-02-13 | 13F | Centerpoint Advisors, LLC | 47 | 0 | ||||||
| 2025-11-14 | 13F | Full Sail Capital, LLC | 367.109 | 0,68 | 39.093 | 2,61 | ||||
| 2026-02-06 | 13F | Texas Bank & Trust Co | 2.200 | 2,04 | 236 | 2,62 | ||||
| 2026-02-10 | 13F | Godfrey Financial Associates, Inc. | 796 | 85 | ||||||
| 2026-04-13 | 13F | LexAurum Advisors, LLC | 13.350 | 18,83 | 1.417 | 18,48 | ||||
| 2026-02-13 | 13F | Arete Wealth Advisors, LLC | 2.052 | -6,34 | 0 | |||||
| 2026-02-17 | 13F | Raymond James Financial Inc | 1.789.329 | -21,92 | 191.655 | -21,46 | ||||
| 2026-04-21 | 13F | PDS Planning, Inc | 141.346 | 8,70 | 15.004 | 7,73 | ||||
| 2026-02-05 | 13F | Bessemer Group Inc | 687.254 | 24,38 | 74 | 25,86 | ||||
| 2026-04-23 | 13F | Moss Adams Wealth Advisors LLC | 17.909 | -10,24 | 1.901 | -11,04 | ||||
| 2026-04-02 | 13F | Crumly & Associates Inc. | 17.885 | -12,68 | 1.898 | -13,45 | ||||
| 2025-11-14 | 13F | Capstone Investment Advisors, Llc | 107.601 | 11.458 | ||||||
| 2026-01-26 | 13F | Whittier Trust Co Of Nevada Inc | 26.042 | -19,48 | 2.797 | -18,69 | ||||
| 2026-02-23 | 13F | Beaird Harris Wealth Management, LLC | 41.078 | 2,47 | 4.400 | 3,07 | ||||
| 2026-01-30 | 13F | Arrien Investments, Inc. | 6.283 | 0,00 | 673 | 0,45 | ||||
| 2026-04-08 | 13F | Capital Advisors Wealth Management, LLC | 34.494 | 0,80 | 3.662 | -0,11 | ||||
| 2026-01-29 | 13F | Kickstand Ventures, Llc. | 2.538 | 0,00 | 272 | 0,37 | ||||
| 2025-11-07 | 13F | Ade, Llc | 0 | -100,00 | 0 | |||||
| 2026-02-05 | 13F | Florin Court Capital LLP | 11.700 | 108,93 | 1.253 | 110,23 | ||||
| 2026-01-29 | 13F | ArborFi Advisors, LLC | 6.228 | 12,50 | 667 | 13,24 | ||||
| 2026-02-06 | 13F | Planning Alternatives Ltd /adv | 11.896 | 0,00 | 1.274 | 0,63 | ||||
| 2026-01-27 | 13F | Sterling Financial Planning, Inc. | 16.354 | -0,90 | 1.752 | -0,34 | ||||
| 2026-02-02 | 13F | PKS Advisory Services, LLC | 2.723 | -21,07 | 292 | -20,71 | ||||
| 2026-02-02 | 13F | Addison Capital Co | 2.816 | 0,00 | 302 | 0,67 | ||||
| 2026-02-04 | 13F | Gray Private Wealth, LLC | 7.332 | 0,00 | 785 | 0,64 | ||||
| 2026-04-13 | 13F | Massmutual Trust Co Fsb/adv | 10.020 | 13,73 | 1.064 | 12,73 | ||||
| 2026-01-30 | 13F | Us Bancorp \de\ | 5.229.521 | -1,25 | 560.138 | -0,67 | ||||
| 2026-04-16 | 13F | Intergy Private Wealth, LLC | 3.906 | 11,00 | 415 | 10,11 | ||||
| 2026-02-11 | 13F | Real Talk Capital, LLC | 6.807 | -0,95 | 729 | -0,27 | ||||
| 2026-02-13 | 13F | Pinnacle Wealth Planning Services, Inc. | 4.178 | 0,00 | 448 | 0,68 | ||||
| 2026-04-20 | 13F | One + One Wealth Management, Llc | 2.338 | 0,00 | 248 | -0,80 | ||||
| 2026-02-05 | 13F | May Hill Capital, LLC | 141.122 | 106,10 | 15.116 | 107,31 | ||||
| 2026-02-05 | 13F | 1st Source Bank | 6.060 | 0,00 | 649 | 0,62 | ||||
| 2026-02-06 | 13F | Covestor Ltd | 4.882 | 11,16 | 1 | |||||
| 2026-04-08 | 13F | Afg Fiduciary Services Limited Partnership | 7.959 | -3,80 | 847 | -4,51 | ||||
| 2026-02-17 | 13F | Laird Norton Trust Company, Llc | 254.305 | 175,13 | 27.239 | 176,75 | ||||
| 2026-02-05 | 13F | Rossmore Private Capital | 2.500 | 100,00 | 268 | 100,75 | ||||
| 2026-02-04 | 13F | Nwam Llc | 14.103 | -34,34 | 1.515 | -34,23 | ||||
| 2026-04-10 | 13F | Magnus Financial Group LLC | 3.334 | -57,68 | 354 | -58,13 | ||||
| 2026-02-09 | 13F | Fidelis Capital Partners, LLC | 3.299 | 7,15 | 353 | 7,95 | ||||
| 2026-01-29 | 13F | Cornerstone Investment Partners, LLC | 16.300 | -1,40 | 1.746 | -0,85 | ||||
| 2026-04-20 | 13F | Provenance Wealth Advisors, LLC | 5.086 | 0,00 | 540 | -0,92 | ||||
| 2026-04-21 | 13F | Centennial Advisors, LLC | 2.611 | -44,29 | 277 | -44,71 | ||||
| 2026-02-13 | 13F | Golden State Wealth Management, LLC | 2.828 | 218,11 | 303 | 221,28 | ||||
| 2026-04-16 | 13F | Annex Advisory Services, LLC | 6.637 | -1,38 | 705 | -2,22 | ||||
| 2026-02-25 | 13F | Thryve Wealth Management Llc | 26.002 | 2.785 | ||||||
| 2026-02-17 | 13F | Note Advisors, LLC | 9.708 | -4,64 | 1.044 | -3,78 | ||||
| 2026-01-06 | 13F | Canal Capital Management, LLC | 2.198 | 235 | ||||||
| 2026-02-17 | 13F | Prosperity Consulting Group, LLC | 61.751 | 21,79 | 6.614 | 22,50 | ||||
| 2026-04-15 | 13F | Iowa State Bank | 4.235 | 2,64 | 450 | 1,81 | ||||
| 2026-01-29 | 13F | Guardian Asset Advisors, LLC | 1.924 | 0,68 | 206 | 1,48 | ||||
| 2026-02-11 | 13F | Simplex Trading, Llc | 22.387 | 2.398 | ||||||
| 2026-02-06 | 13F | Synergy Investment Management, LLC | 17.683 | 7,63 | 1.894 | 8,29 | ||||
| 2026-02-10 | 13F | MainStreet Investment Advisors LLC | 10.735 | 7,51 | 1.150 | 8,09 | ||||
| 2026-02-10 | 13F | Lido Advisors, LLC | 138.638 | -1,25 | 14.798 | -1,02 | ||||
| 2026-01-20 | 13F | Cooksen Wealth, LLC | 13.473 | -6,33 | 1.443 | -5,75 | ||||
| 2025-11-13 | 13F | Obsidian Personal Planning Solutions LLC | 2.168 | -6,15 | 233 | -3,32 | ||||
| 2025-11-14 | 13F | Verition Fund Management LLC | 0 | -100,00 | 0 | |||||
| 2026-04-20 | 13F | Naples Global Advisors, Llc | 70.716 | 8,01 | 7.507 | 7,05 | ||||
| 2025-11-12 | 13F | Willow Creek Wealth Management Inc. | 4.985 | 0,63 | 531 | 2,51 | ||||
| 2026-02-13 | 13F | Oarsman Capital, Inc. | 10.758 | -0,21 | 1.152 | 0,35 | ||||
| 2026-04-09 | 13F | Kwmg, Llc | 17.638 | -5,65 | 1.872 | -6,49 | ||||
| 2026-04-08 | 13F | Sax Wealth Advisors, Llc | 35.752 | 0,00 | 3.829 | 0,00 | ||||
| 2026-04-08 | 13F | First Heartland Consultants, Inc. | 20.643 | 180,70 | 2.191 | 178,40 | ||||
| 2026-04-20 | 13F | Christensen, King & Associates Investment Services, Inc. | 3.220 | 0,06 | 342 | -0,87 | ||||
| 2026-02-13 | 13F | Financial Network Wealth Advisors LLC | 469 | 0,86 | 50 | 2,04 | ||||
| 2026-02-12 | 13F | Commonwealth Equity Services, Llc | 2.861.748 | 0,47 | 306.522 | 101.062,05 | ||||
| 2026-01-21 | 13F | Y.D. More Investments Ltd | 160 | 0,00 | 17 | 0,00 | ||||
| 2026-02-10 | 13F | CFS Investment Advisory Services, LLC | 32.407 | 0,56 | 3.471 | 0,12 | ||||
| 2026-01-27 | 13F | Beacon Bridge Wealth Partners, LLC | 116.095 | -1,86 | 12.435 | -1,29 | ||||
| 2026-02-02 | 13F | JDM Financial Group LLC | 356 | 38 | ||||||
| 2026-01-27 | 13F | Journey Advisory Group, LLC | 3.680 | 77,18 | 393 | 77,38 | ||||
| 2026-02-17 | 13F | Northern Trust Corp | 22.992 | 5,34 | 2.463 | 5,94 | ||||
| 2026-04-09 | 13F | Chemistry Wealth Management LLC | 3.490 | 0,00 | 370 | -0,80 | ||||
| 2026-04-15 | 13F | Journey Strategic Wealth Llc | 22.616 | -2,89 | 2.401 | -3,77 | ||||
| 2026-01-29 | 13F | Financial Life Planners | 0 | -100,00 | 0 | |||||
| 2026-02-17 | 13F | Cape Investment Advisory, Inc. | 2.394 | 4,50 | 256 | 4,92 | ||||
| 2026-04-17 | 13F | Webster Bank, N. A. | 8.097 | -18,64 | 859 | -19,34 | ||||
| 2025-11-13 | 13F | Certified Advisory Corp | 0 | -100,00 | 0 | |||||
| 2026-01-21 | 13F | Crux Wealth Advisors | 6.478 | 6,79 | 694 | 7,28 | ||||
| 2026-02-18 | 13F | Financial Planning Fort Collins, LLC | 57.798 | 6.191 | ||||||
| 2026-04-09 | 13F | Wealth Alliance Advisory Group, LLC | 3.716 | 0,00 | 394 | -1,01 | ||||
| 2026-02-10 | 13F | Acorn Wealth Advisors, LLC | 4.867 | 7,30 | 521 | 7,87 | ||||
| 2026-04-20 | 13F | Chatterton & Associates Inc. | 20.453 | 33,48 | 2.188 | 33,33 | ||||
| 2026-02-02 | 13F | Everest Management Corp. | 6.015 | 0,00 | 644 | 0,63 | ||||
| 2026-02-14 | 13F | Howe & Rusling Inc | 612 | 66 | ||||||
| 2026-04-10 | 13F | Summit Financial Consulting LLC | 2.065 | -10,99 | 219 | -11,69 | ||||
| 2026-04-21 | 13F | Cambient Family Office, Llc | 6.886 | 145,23 | 731 | 143,33 | ||||
| 2026-02-12 | 13F | SVRN Asset Management, LLC | 1.948 | 209 | ||||||
| 2026-02-04 | 13F | Advisor OS, LLC | 1.993 | -20,31 | 213 | -19,92 | ||||
| 2026-02-11 | 13F | Cypress Capital Group | 15.600 | 9,86 | 1.671 | 10,45 | ||||
| 2026-04-20 | 13F | Brandywine Oak Private Wealth Llc | 91.210 | 21,76 | 9.682 | 20,67 | ||||
| 2026-01-16 | 13F | Forte Asset Management Llc | 16.636 | -0,24 | 1.782 | 0,34 | ||||
| 2026-04-08 | 13F | Lineweaver Wealth Advisors, LLC | 21.201 | 2,05 | 2.251 | 1,12 | ||||
| 2026-04-21 | 13F | Magnolia Private Wealth, LLC | 8.937 | 121,82 | 949 | 119,95 | ||||
| 2026-02-05 | 13F | Center for Financial Planning, Inc. | 3.521 | 0,00 | 377 | 0,80 | ||||
| 2026-02-11 | 13F | Dearborn Partners Llc | 2.581 | 0,27 | 276 | 0,73 | ||||
| 2026-04-16 | 13F | Quotient Wealth Partners, LLC | 298.694 | 4,79 | 31.706 | 3,86 | ||||
| 2026-02-17 | 13F | Wellington Management Group Llp | 0 | -100,00 | 0 | |||||
| 2026-02-09 | 13F | Roundview Capital LLC | 8.339 | -6,05 | 893 | -5,50 | ||||
| 2026-02-04 | 13F | Rock Point Advisors, LLC | 6.811 | -1,80 | 730 | -1,22 | ||||
| 2026-02-02 | 13F | Peregrine Asset Advisers, Inc. | 6.239 | -13,65 | 668 | -13,13 | ||||
| 2026-02-17 | 13F | Ameriflex Group, Inc. | 771 | -50,00 | 83 | -50,00 | ||||
| 2026-04-07 | 13F | Signaturefd, Llc | 1.126.750 | -3,16 | 119.605 | -4,03 | ||||
| 2026-01-29 | 13F | Sanctuary Advisors, LLC | 339.913 | 10,73 | 36.408 | 11,38 | ||||
| 2026-01-22 | 13F | TSA Wealth Managment LLC | 8.704 | 22,83 | 932 | 23,61 | ||||
| 2026-02-20 | 13F | Waterford Advisors, LLC | 0 | -100,00 | 0 | |||||
| 2026-04-08 | 13F | Wealth Enhancement Advisory Services, Llc | 492.231 | -40,07 | 52.418 | -40,59 | ||||
| 2026-02-10 | 13F | Meramec Financial Planners, LLC | 700 | 75 | ||||||
| 2026-04-20 | 13F | Surience Private Wealth Llc | 15.508 | 630,82 | 1.646 | 625,11 | ||||
| 2026-01-21 | 13F | Crews Bank & Trust | 8.825 | 1,44 | 945 | 2,05 | ||||
| 2026-02-10 | 13F | Sittner & Nelson, Llc | 66 | 7 | ||||||
| 2026-02-10 | 13F | Cherry Tree Wealth Management, LLC | 3.668 | -0,24 | 393 | 0,26 | ||||
| 2026-01-23 | 13F | Beacon Harbor Wealth Advisors, Inc. | 0 | -100,00 | 0 | |||||
| 2026-02-17 | 13F | Spears Abacus Advisors LLC | 0 | -100,00 | 0 | |||||
| 2026-01-21 | 13F | Stock Yards Bank & Trust Co | 12.601 | 9,66 | 1.350 | 10,30 | ||||
| 2026-01-29 | 13F | Elevated Financial Group LLC | 3.472 | 372 | ||||||
| 2026-02-12 | 13F | Nuveen, LLC | 440.594 | 819,57 | 47.192 | 824,97 | ||||
| 2026-02-17 | 13F | Evercore Wealth Management, LLC | 2.830 | 37,18 | 303 | 38,36 | ||||
| 2026-04-14 | 13F | Seven Mile Advisory | 0 | -100,00 | 0 | |||||
| 2026-04-20 | 13F | Eagle Strategies LLC | 12.461 | -7,92 | 1.323 | -8,76 | ||||
| 2026-02-12 | 13F | Bank Of Montreal /can/ | 572.680 | 18,38 | 61.340 | 19,07 | ||||
| 2026-02-02 | 13F | B.O.S.S. Retirement Advisors, LLC | 10.933 | -14,10 | 1.171 | -13,58 | ||||
| 2026-04-13 | 13F | Professional Financial Advisors, LLC | 24.261 | 13,87 | 2.575 | 12,84 | ||||
| 2026-02-26 | 13F | TD Capital Management LLC | 38.161 | -1,08 | 4.087 | -0,51 | ||||
| 2026-04-14 | 13F | Spectrum Investment Advisors, Inc. | 6.960 | -18,93 | 739 | -19,70 | ||||
| 2026-04-23 | 13F | Harbor Investment Advisory, Llc | 510 | 5,81 | 54 | 5,88 | ||||
| 2026-02-17 | 13F | National Asset Management, Inc. | 10.259 | 16,26 | 1.099 | 16,93 | ||||
| 2026-04-23 | 13F | Intrua Financial, LLC | 4.411 | 0,00 | 468 | -0,85 | ||||
| 2026-02-11 | 13F | Parallel Advisors, LLC | 46.525 | 52,81 | 4.983 | 53,70 | ||||
| 2026-04-20 | 13F | First PREMIER Bank | 200 | 0,00 | 0 | |||||
| 2026-02-13 | 13F | Kayne Anderson Rudnick Investment Management Llc | 75.584 | 3,98 | 8.077 | 4,46 | ||||
| 2026-01-26 | 13F | Consolidated Portfolio Review Corp | 0 | -100,00 | 0 | -100,00 | ||||
| 2026-01-29 | 13F | Calamos Wealth Management LLC | 18.394 | 242,72 | 1.970 | 245,01 | ||||
| 2026-01-28 | 13F | Salomon & Ludwin, LLC | 215.345 | 7,68 | 23.115 | 8,65 | ||||
| 2026-02-11 | 13F | TCTC Holdings, LLC | 0 | -100,00 | 0 | |||||
| 2026-02-10 | 13F | Tidemark, LLC | 115 | 0,88 | 12 | 0,00 | ||||
| 2026-02-06 | 13F | Kingdom Financial Group LLC. | 196.934 | 208,91 | 21.094 | 210,74 | ||||
| 2026-02-13 | 13F | Morgan Stanley | 8.576.961 | 6,01 | 918.678 | 6,63 | ||||
| 2026-01-21 | 13F | Signature Resources Capital Management, LLC | 59 | 6 | ||||||
| 2026-04-08 | 13F | Hummer Financial Advisory Services Inc | 5.000 | 0,00 | 531 | -0,93 | ||||
| 2026-01-21 | 13F | Flagship Harbor Advisors, Llc | 17.521 | -7,77 | 1.877 | -7,27 | ||||
| 2026-04-17 | 13F | AdvisorNet Financial, Inc | 18.973 | 0,09 | 2.014 | -0,84 | ||||
| 2026-04-07 | 13F | Blueline Advisors Llc | 2.392 | 215,98 | 254 | 212,35 | ||||
| 2026-04-21 | 13F | Northland Capital Management LLC | 4.055 | 23,44 | 430 | 22,51 | ||||
| 2026-01-22 | 13F | Bartlett & Co. Wealth Management Llc | 86.311 | 26,39 | 9.245 | 27,12 | ||||
| 2026-01-23 | 13F | Westside Investment Management, Inc. | 46.338 | 30,31 | 4.963 | 31,09 | ||||
| 2026-01-23 | 13F | Rsm Us Wealth Management Llc | 288.053 | 4,86 | 30.850 | 5,46 | ||||
| 2026-02-11 | 13F | Stirlingshire Investments, Inc. | 8.241 | 883 | ||||||
| 2026-04-21 | 13F | Pinnacle Wealth Management Advisory Group, LLC | 14.708 | 1,11 | 1.561 | 0,19 | ||||
| 2026-02-13 | 13F | TRUE Private Wealth Advisors | 2.803 | 0,00 | 300 | 0,67 | ||||
| 2026-02-09 | 13F | White Lighthouse Investment Management Inc. | 24.100 | 0,86 | 2.581 | 1,45 | ||||
| 2026-04-21 | 13F | Waterway Wealth Management, LLC | 175.740 | -8,58 | 18.655 | -9,40 | ||||
| 2025-10-29 | 13F | Tradewinds, LLC. | 0 | -100,00 | 0 | |||||
| 2026-01-28 | 13F | Mountain Capital Investment Advisors, Inc | 3.403 | 366 | ||||||
| 2026-02-17 | 13F | XTX Topco Ltd | 10.293 | -1,47 | 1.102 | -0,90 | ||||
| 2026-04-16 | 13F | Birch Financial Group, Llc | 14.107 | -0,97 | 1.497 | -1,84 | ||||
| 2026-02-02 | 13F | Cornerstone Planning Group LLC | 20.855 | 0,76 | 2.248 | 1,17 | ||||
| 2026-04-15 | 13F | Valley National Advisers Inc | 3.368 | -9,78 | 0 | |||||
| 2026-02-13 | 13F | Integrity Financial Corp /WA | 985 | 136,78 | 106 | 138,64 | ||||
| 2026-01-12 | 13F | AllSquare Wealth Management LLC | 1.180 | 0,00 | 126 | 1,63 | ||||
| 2026-01-26 | 13F | West Wealth Group, LLC | 5.128 | -2,69 | 549 | -2,66 | ||||
| 2026-04-10 | 13F | OMNI 360 Wealth, Inc. | 2.768 | 1,88 | 294 | 0,34 | ||||
| 2026-02-06 | 13F | Orin Green Financial, LLC | 88.995 | -4,19 | 9.532 | -3,63 | ||||
| 2026-02-13 | 13F | Stifel Financial Corp | 618.998 | 2,48 | 66.301 | 3,07 | ||||
| 2025-11-10 | 13F | Lion Street Advisors, LLC | 7.405 | -5,93 | 859 | 4,38 | ||||
| 2026-04-14 | 13F | Moisand Fitzgerald Tamayo, LLC | 986 | -6,81 | 105 | -7,96 | ||||
| 2026-01-23 | 13F | Journey Beyond Wealth, LLC | 10.000 | 0,00 | 1.071 | 0,66 | ||||
| 2026-01-27 | 13F | Brighton Jones Llc | 0 | -100,00 | 0 | |||||
| 2026-04-14 | 13F | Precedent Wealth Partners, Llc | 54.305 | 10,91 | 5.764 | 9,92 | ||||
| 2026-04-15 | 13F | Curbstone Financial Management Corp | 46.992 | 12,31 | 4.988 | 11,31 | ||||
| 2026-04-13 | 13F | Creative Financial Designs Inc /adv | 25.559 | -3,25 | 2.713 | -4,10 | ||||
| 2026-01-21 | 13F | Modera Wealth Management, LLC | 215.092 | 3,84 | 23.039 | 4,45 | ||||
| 2026-04-15 | 13F | Hilltop Wealth Advisors, Llc | 3.522 | 0,00 | 374 | -1,06 | ||||
| 2026-02-17 | 13F | State Of Wisconsin Investment Board | 607.800 | 0,00 | 65.101 | 0,58 | ||||
| 2025-10-28 | 13F | Copperleaf Capital, LLC | 5.302 | 4,25 | 565 | 6,21 | ||||
| 2025-11-04 | 13F | IMC-Chicago, LLC | 0 | -100,00 | 0 | -100,00 | ||||
| 2026-04-17 | 13F | Boston Private Wealth Llc | 66.978 | -13,60 | 7.110 | -14,38 | ||||
| 2026-02-13 | 13F | First National Bank Of Omaha | 3.715 | 398 | ||||||
| 2026-01-27 | 13F | Horst & Graben Wealth Management LLC | 3.269 | 1,02 | 350 | 1,74 | ||||
| 2026-04-15 | 13F | Sowa Financial Group, Inc. | 10.021 | 0,18 | 1 | 0,00 | ||||
| 2026-01-28 | 13F | Aspen Wealth Strategies, LLC | 5.899 | 12,88 | 632 | 13,49 | ||||
| 2026-01-22 | 13F | Bfsg, Llc | 385 | 285,00 | 41 | 310,00 | ||||
| 2026-02-09 | 13F | Bleakley Financial Group, LLC | 34.537 | 31,53 | 3.699 | 32,30 | ||||
| 2026-01-21 | 13F | Impact Investors, Inc | 5.807 | 7,14 | 622 | 7,63 | ||||
| 2026-04-15 | 13F | Tenzing Financial LLC | 21.862 | 8,14 | 2.339 | 8,04 | ||||
| 2026-04-16 | 13F | Ballast Rock Private Wealth LLC | 8.726 | 112,52 | 926 | 110,93 | ||||
| 2026-02-13 | 13F | McAdam, LLC | 48.619 | 20,94 | 5.208 | 21,63 | ||||
| 2026-02-03 | 13F | Investment Management Associates Inc /adv | 0 | -100,00 | 0 | |||||
| 2026-02-11 | 13F | Group One Trading, L.p. | 9.825 | 1.052 | ||||||
| 2026-01-27 | 13F | Alley Investment Management Company, LLC | 131.111 | 0,10 | 14.043 | 0,68 | ||||
| 2025-11-12 | 13F | Mesirow Financial Investment Management, Inc. | 0 | -100,00 | 0 | |||||
| 2026-01-21 | 13F | Towercrest Capital Management | 134.296 | 3,54 | 14.384 | 4,15 | ||||
| 2026-02-12 | 13F | Schneider Downs Wealth Management Advisors, LP | 340.737 | 8,67 | 36.496 | 9,31 | ||||
| 2026-02-12 | 13F | Financial Engines Advisors L.L.C. | 599.668 | 1,02 | 64.230 | 1,61 | ||||
| 2026-02-13 | 13F | Baird Financial Group, Inc. | 328.222 | -7,81 | 35.156 | -7,28 | ||||
| 2026-04-17 | 13F | Union Savings Bank | 2.297 | 11,34 | 244 | 10,45 | ||||
| 2026-02-10 | 13F | Vantus Wealth LLC | 2.483 | 266 | ||||||
| 2026-01-14 | 13F | Donaldson Capital Management, Llc | 23.125 | -0,21 | 2.477 | 0,36 | ||||
| 2025-11-04 | 13F | Pineridge Advisors LLC | 1.273 | -3,92 | 136 | -2,17 | ||||
| 2026-04-08 | 13F | Cambridge Financial Group, LLC | 2.246 | -35,57 | 238 | -36,19 | ||||
| 2026-02-02 | 13F | Horizon Investments, LLC | 64.626 | 14,19 | 6.922 | 15,46 | ||||
| 2026-01-26 | 13F | Asset Dedication, LLC | 3 | 0,00 | 0 | |||||
| 2026-02-11 | 13F | Truepoint, Inc. | 11.182 | 6,44 | 1.198 | 7,07 | ||||
| 2026-04-17 | 13F | United Advisor Group, LLC | 17.695 | 17,73 | 1.878 | 16,72 | ||||
| 2026-02-17 | 13F | LMR Partners LLP | Call | 343.200 | 36.760 | |||||
| 2026-04-07 | 13F | CoreCap Advisors, LLC | 8.275 | -1,45 | 878 | -2,34 | ||||
| 2026-01-23 | 13F | Fortress Financial Group, Llc | 2.270 | 0,00 | 243 | 0,83 | ||||
| 2026-01-20 | 13F | Philip James Wealth Mangement, LLC | 3.388 | -3,56 | 363 | -3,21 | ||||
| 2026-02-17 | 13F | VestGen Advisors, LLC | 25.376 | 67,20 | 2.718 | 68,13 | ||||
| 2026-02-17 | 13F | LMR Partners LLP | 1.495.000 | 398,33 | 160.129 | 401,23 | ||||
| 2026-02-12 | 13F | Great Valley Advisor Group, Inc. | 126.376 | 25,28 | 13.537 | 26,01 | ||||
| 2025-11-14 | 13F | Parallax Volatility Advisers, L.P. | Put | 0 | -100,00 | 0 | -100,00 | |||
| 2025-11-14 | 13F | Parallax Volatility Advisers, L.P. | Call | 0 | -100,00 | 0 | -100,00 | |||
| 2026-02-10 | 13F | Madison Wealth Partners, Inc | 18.710 | -2,67 | 2.004 | -2,10 | ||||
| 2025-11-14 | 13F | Parallax Volatility Advisers, L.P. | 0 | -100,00 | 0 | |||||
| 2026-04-22 | 13F | Midwest Financial Group LLC | 18.197 | 3,91 | 1.932 | 2,99 | ||||
| 2026-04-15 | 13F | Parsons Capital Management Inc/ri | 4.284 | 54,55 | 455 | 53,38 | ||||
| 2026-02-18 | 13F | Veratis Advisors, Inc. | 53.101 | 5.756 | ||||||
| 2026-02-10 | 13F | SCS Capital Management LLC | 154.146 | -1,58 | 16.511 | -1,01 | ||||
| 2026-01-26 | 13F | Whittier Trust Co | 7.080 | 0,00 | 761 | 0,93 | ||||
| 2026-04-15 | 13F | Cypress Financial Planning Llc | 12.982 | 6,23 | 1.378 | 5,35 | ||||
| 2026-02-09 | 13F | HBK Sorce Advisory LLC | 7.586 | -3,58 | 817 | -3,09 | ||||
| 2025-10-28 | 13F | Pinnacle Financial Partners Inc | 2.726 | -81,63 | 290 | -81,29 | ||||
| 2026-02-06 | 13F | Aviance Capital Partners, LLC | 2.329 | 0,00 | 249 | 0,40 | ||||
| 2026-04-13 | 13F | IFP Advisors, Inc | 36.471 | 10,57 | 3.871 | 9,57 | ||||
| 2026-04-23 | 13F | Caliber Wealth Management, LLC / KS | 31.392 | -48,90 | 3.332 | -49,36 | ||||
| 2026-02-11 | 13F | Curtis Wealth Management Llc | 9.126 | 983 | ||||||
| 2026-01-20 | 13F | Stratos Wealth Advisors, LLC | 20.151 | 5,75 | 2.158 | 6,36 | ||||
| 2026-01-30 | 13F | Bogart Wealth, LLC | 1.677 | 0,00 | 180 | 0,56 | ||||
| 2026-01-30 | 13F | Wealthfront Advisers Llc | 4.900.255 | -2,75 | 524.866 | -2,19 | ||||
| 2026-02-17 | 13F | Clark Capital Management Group, Inc. | 2.066 | 221 | ||||||
| 2025-10-27 | 13F | WealthPlan Investment Management, LLC | 0 | -100,00 | 0 | |||||
| 2026-02-06 | 13F | EverSource Wealth Advisors, LLC | 3.929 | -47,62 | 421 | -47,37 | ||||
| 2026-02-23 | 13F | Investments & Financial Planning, LLC | 8.879 | 5,09 | 951 | 5,78 | ||||
| 2026-04-15 | 13F | Braun-Bostich & Associates Inc. | 4.822 | 0,50 | 512 | -0,39 | ||||
| 2026-02-09 | 13F | Choate Investment Advisors | 1.165.513 | -4,66 | 124.838 | -4,10 | ||||
| 2026-02-17 | 13F | Millennium Management Llc | 13.163 | -41,30 | 1.410 | -41,00 | ||||
| 2026-04-17 | 13F | First Citizens Asset Management, Inc. | 62.412 | -31,19 | 6.625 | -31,80 | ||||
| 2026-02-09 | 13F | Westover Capital Advisors, LLC | 43.299 | 2,05 | 4.638 | 2,63 | ||||
| 2026-01-26 | 13F | AE Wealth Management LLC | 449.804 | 13,11 | 48.179 | 13,77 | ||||
| 2026-04-09 | 13F | Park Place Capital Corp | 3.865 | 0,39 | 410 | -0,49 | ||||
| 2026-01-27 | 13F | Able Wealth Management LLC | 4.658 | 14,59 | 499 | 15,28 | ||||
| 2026-01-27 | 13F | First Horizon Corp | 40.275 | 27,46 | 4.314 | 28,21 | ||||
| 2026-04-10 | 13F | GEM Asset Management, LLC | 5.383 | 0,52 | 571 | -0,87 | ||||
| 2026-02-09 | 13F | Todd Asset Management Llc | 15.648 | 1.676 | ||||||
| 2026-01-30 | 13F | Smart Money Group LLC | 30.855 | 14,75 | 3.305 | 15,40 | ||||
| 2026-02-10 | 13F | Colton Groome Financial Advisors, Llc | 15.140 | -1,78 | 1.622 | -1,22 | ||||
| 2025-11-12 | 13F | Retirement Capital Strategies | 0 | -100,00 | 0 | |||||
| 2026-04-10 | 13F | Jacobson & Schmitt Advisors, Llc | 10.924 | 2,28 | 1.160 | 1,40 | ||||
| 2026-04-02 | 13F | Hilltop National Bank | 1.988 | -48,59 | 211 | -49,03 | ||||
| 2026-01-21 | 13F | MBA Advisors LLC | 0 | -100,00 | 0 | |||||
| 2026-01-21 | 13F | Palumbo Wealth Management LLC | 3.387 | 363 | ||||||
| 2026-04-14 | 13F | Act Wealth Management, Llc | 8.791 | 34,23 | 933 | 33,10 | ||||
| 2026-01-30 | 13F | Wealth Management Resources, Inc. | 43.464 | -4,76 | 4.655 | -4,20 | ||||
| 2026-02-05 | 13F | Blume Capital Management, Inc. | 0 | -100,00 | 0 | |||||
| 2026-02-06 | 13F | Summit Wealth Group, LLC | 81.767 | -1,51 | 8.758 | -0,93 | ||||
| 2026-02-13 | 13F | American Century Companies Inc | 88.600 | 0,00 | 9.490 | 0,57 | ||||
| 2026-02-12 | 13F | Zevin Asset Management Llc | 20.576 | 2.204 | ||||||
| 2026-02-09 | 13F | Unified Investment Management | 2.850 | 0,00 | 305 | 0,66 | ||||
| 2026-02-12 | 13F | Haven Private, LLC | 10.715 | -2,94 | 1.148 | -2,38 | ||||
| 2026-04-21 | 13F | RCS Financial Planning, LLC | 23.315 | 50,54 | 2.475 | 49,22 | ||||
| 2026-02-12 | 13F | Johnson Financial Group, Inc. | 45.119 | -1,42 | 4.833 | -0,84 | ||||
| 2026-01-20 | 13F | White & Co Financial Planning Inc | 16.430 | 0,00 | 1.760 | 0,57 | ||||
| 2026-04-03 | 13F | Waller Financial Planning Group, Inc | 26.953 | 3,31 | 2.861 | 2,40 | ||||
| 2026-04-09 | 13F | Diversified Management Inc | 3.170 | 0,00 | 336 | -0,88 | ||||
| 2026-04-16 | 13F | BridgePort Financial Solutions, LLC | 4.566 | 0,00 | 485 | -1,02 | ||||
| 2026-02-13 | 13F | Resources Investment Advisors, LLC. | 773.469 | 3,49 | 82.846 | 4,09 | ||||
| 2026-02-11 | 13F | IMA Wealth, Inc. | 1.076 | 14,96 | 115 | 16,16 | ||||
| 2026-04-09 | 13F | Veracity Capital LLC | 9.165 | -2,21 | 973 | -3,09 | ||||
| 2025-11-05 | 13F | Burt Wealth Advisors | 42.541 | 4,84 | 4.530 | 6,86 | ||||
| 2025-11-14 | 13F | Envision Financial Planning, LLC | 0 | -100,00 | 0 | |||||
| 2026-04-22 | 13F | Paul Damon & Associates, Inc. | 12.429 | 5,08 | 1.319 | 4,19 | ||||
| 2026-04-16 | 13F | Brookstone Capital Management | 159.577 | 13,83 | 16.939 | 12,81 | ||||
| 2026-02-13 | 13F | Gen-Wealth Partners Inc | 24.931 | 38,61 | 2.670 | 39,43 | ||||
| 2026-01-21 | 13F | Heritage Oak Wealth Advisors Llc | 2.972 | 0,00 | 318 | 0,63 | ||||
| 2026-02-18 | 13F | Crusonia Wealth Advisors LLC | 15.649 | 1.676 | ||||||
| 2026-02-17 | 13F | Fairscale Capital, LLC | 0 | -100,00 | 0 | |||||
| 2026-02-19 | 13F | CI Private Wealth, LLC | 847.950 | 7,49 | 90.824 | 8,12 | ||||
| 2026-04-13 | 13F | Kelly Financial Services LLC | 3.827 | -54,39 | 406 | -54,79 | ||||
| 2026-04-23 | 13F | Etesian Wealth Advisors, Inc. | 7.386 | -0,83 | 784 | -1,63 | ||||
| 2026-04-21 | 13F | Old National Bancorp /in/ | 6.907 | -6,75 | 733 | -7,57 | ||||
| 2025-10-28 | 13F | Hartford Financial Management Inc. | 0 | -100,00 | 0 | |||||
| 2026-04-17 | 13F | Legacy Wealth Partners, LLC | 8.100 | 30,50 | 860 | 29,37 | ||||
| 2026-02-17 | 13F | Second Line Capital, LLC | 2.277 | 244 | ||||||
| 2026-04-21 | 13F | Unique Wealth, Llc | 234.613 | 20,26 | 24.904 | 19,18 | ||||
| 2026-04-21 | 13F | Merkkuri Wealth Advisors LLC | 3.698 | 14,28 | 393 | 13,29 | ||||
| 2026-01-26 | 13F | SeaBridge Investment Advisors LLC | 7.761 | 0,10 | 831 | 0,73 | ||||
| 2026-04-16 | 13F | Evolve Private Wealth, Llc | 12.298 | 22,04 | 1.305 | 20,95 | ||||
| 2026-02-05 | 13F | Noesis Capital Mangement Corp | 4.323 | 7,46 | 463 | 8,18 | ||||
| 2025-11-04 | 13F | Guerra Advisors Inc | 976 | 104 | ||||||
| 2026-02-11 | 13F | Cedar Mountain Advisors, LLC | 0 | -100,00 | 0 | |||||
| 2026-02-13 | 13F | First Trust Advisors Lp | 7.724 | 0,46 | 827 | 1,10 | ||||
| 2026-04-15 | 13F | Badgley Phelps Wealth Managers, LLC | 4.400 | 0,00 | 467 | -0,85 | ||||
| 2026-02-17 | 13F | Crabel Capital Management, LLC | 49.992 | 129,21 | 5.355 | 130,58 | ||||
| 2026-01-23 | 13F | Actinver Wealth Management, Inc. | 1.896 | 203 | ||||||
| 2026-02-12 | 13F | Hudock, Inc. | 23.763 | -7,76 | 2.545 | -7,22 | ||||
| 2026-02-09 | 13F | Flagstone Financial Management | 29.842 | 0,35 | 3.196 | 0,95 | ||||
| 2026-02-04 | 13F | HORAN Wealth, LLC | 8.376 | 19,52 | 897 | 20,24 | ||||
| 2026-02-11 | 13F | Mattson Financial Services, LLC | 19.454 | 26,67 | 2.084 | 27,40 | ||||
| 2026-02-09 | 13F | Heritage Wealth Management, Inc./Texas | 90.664 | -22,09 | 9.711 | -21,63 | ||||
| 2026-02-12 | 13F | CIBC Private Wealth Group, LLC | 128.303 | 1,89 | 13.743 | 2,48 | ||||
| 2026-02-11 | 13F | CNB Bank | 300 | 0,00 | 32 | 3,23 | ||||
| 2026-01-27 | 13F | Rye Brook Capital LLC | 4.400 | 0,00 | 0 | |||||
| 2026-04-21 | 13F | Tassel Capital Management, Inc. | 6.184 | 0,00 | 656 | -0,91 | ||||
| 2026-02-06 | 13F | Larson Financial Group LLC | 34.375 | 23,45 | 3.682 | 24,15 | ||||
| 2026-04-23 | 13F | Accurate Wealth Management, LLC | 2.502 | -87,25 | 267 | -87,36 | ||||
| 2026-01-28 | 13F | Core Wealth Management, Inc. | 2.779 | 298 | ||||||
| 2026-02-13 | 13F | Brown Advisory Inc | 60.136 | -7,15 | 6.441 | -6,61 | ||||
| 2026-04-20 | 13F | City State Bank | 18 | 0,00 | 2 | 0,00 | ||||
| 2026-02-17 | 13F | Twin Focus Capital Partners, Llc | 4.635 | 0,00 | 496 | 0,61 | ||||
| 2026-04-07 | 13F | Orgel Wealth Management, LLC | 2.677.093 | 2,34 | 284.173 | 1,42 | ||||
| 2026-04-20 | 13F | SILVER OAK SECURITIES, Inc | 1.657 | 6,35 | 176 | 5,42 | ||||
| 2026-01-30 | 13F | Rogco, Lp | 10.646 | -0,56 | 1.140 | 0,00 | ||||
| 2026-04-01 | 13F | Confluence Investment Management Llc | 31.662 | 5,78 | 3.361 | 4,80 | ||||
| 2026-04-09 | 13F | Firethorn Wealth Partners, Llc | 5.493 | -0,56 | 583 | -1,35 | ||||
| 2026-02-12 | 13F | Jane Street Group, Llc | Put | 134.100 | 9,83 | 14.363 | 10,47 | |||
| 2026-04-15 | 13F | Hengehold Capital Management Llc | 26.181 | 11,58 | 2.779 | 10,58 | ||||
| 2026-04-13 | 13F | Woodside Wealth Management LLC | 2.248 | 0,00 | 239 | -0,83 | ||||
| 2026-02-13 | 13F | Barclays Plc | Put | 1.350.000 | 0,00 | 144.598 | 0,58 | |||
| 2026-02-12 | 13F | Founders Financial Alliance, LLC | 497 | -16,47 | 53 | -15,87 | ||||
| 2026-02-11 | 13F | Patron Partners Advisors, Llc | 2.854 | -9,02 | 306 | -8,68 | ||||
| 2026-02-02 | 13F | Blake Schutter Theil Wealth Advisors, LLC | 10.969 | -0,63 | 1.175 | -0,09 | ||||
| 2026-02-05 | 13F | Passive Capital Management, LLC. | 13.649 | 0,10 | 1.462 | 0,69 | ||||
| 2026-04-07 | 13F | Fragasso Group Inc. | 88.706 | -1,33 | 9.443 | -1,94 | ||||
| 2026-04-17 | 13F | Atlas Brown,Inc. | 4.262 | 0,42 | 452 | -0,44 | ||||
| 2026-04-21 | 13F | Davidson Investment Advisors | 56.625 | 13,56 | 5.971 | 11,78 | ||||
| 2025-11-07 | 13F | Brightwater Advisory LLC | 0 | -100,00 | 0 | -100,00 | ||||
| 2026-02-13 | 13F | Seaside Wealth Management, Inc. | 53.462 | -1,14 | 5.726 | -0,57 | ||||
| 2026-04-08 | 13F | Canandaigua National Trust Co of Florida | 4.569 | 2,24 | 485 | 1,26 | ||||
| 2026-04-14 | 13F | Sanchez Gaunt Capital Management, LLC | 23.453 | 2.490 | ||||||
| 2026-04-20 | 13F | Wall Capital Group, Inc. | 2.926 | 311 | ||||||
| 2026-04-16 | 13F | Envision Financial LLC | 8.497 | 0,15 | 902 | -0,77 | ||||
| 2026-01-13 | 13F | Stablepoint Partners, LLC | 3.782 | -4,13 | 405 | -3,57 | ||||
| 2026-02-10 | 13F | Bridge Generations Wealth Management Llc | 95.206 | 56,43 | 10.197 | 57,34 | ||||
| 2026-02-17 | 13F | GeoWealth Management, LLC | 4.929 | 1,05 | 528 | 1,54 | ||||
| 2026-02-04 | 13F | Independent Advisor Alliance | 22.366 | 2,20 | 2.396 | 2,79 | ||||
| 2026-04-21 | 13F | Shepherd Street Advisors LLC | 3.191 | 1,01 | 339 | 0,00 | ||||
| 2026-03-04 | 13F | Hayek Kallen Investment Management | 0 | -100,00 | 0 | |||||
| 2026-01-20 | 13F | HBE Wealth Management, LLC | 2.314 | 248 | ||||||
| 2025-10-30 | 13F | Ridgewood Investments LLC | 0 | -100,00 | 0 | |||||
| 2026-02-17 | 13F | One Wealth Capital Management, Llc | 73.739 | 3,76 | 7.898 | 4,36 | ||||
| 2025-11-05 | 13F | Concord Asset Management, LLC/VA | 0 | -100,00 | 0 | |||||
| 2026-02-13 | 13F | LGT Financial Advisors LLC | 0 | -100,00 | 0 | |||||
| 2026-04-14 | 13F | Patriot Investment Management Inc. | 87.338 | 0,59 | 9.271 | -0,31 | ||||
| 2026-04-22 | 13F | Stone House Investment Management, LLC | 63.275 | 17,67 | 6.717 | 16,62 | ||||
| 2026-04-14 | 13F | Centerline Wealth Advisors, LLC | 16.736 | 1.777 | ||||||
| 2026-02-25 | 13F | Westshore Wealth, LLC | 4.537 | -10,30 | 486 | -9,85 | ||||
| 2026-04-13 | 13F | Amplius Wealth Advisors, LLC | 3.461 | 8,50 | 367 | 7,62 | ||||
| 2026-04-23 | 13F | Ellenbecker Investment Group | 2.537 | -3,39 | 269 | -4,27 | ||||
| 2026-02-13 | 13F | Centiva Capital, LP | Call | 0 | -100,00 | 0 | -100,00 | |||
| 2026-04-06 | 13F | Washington Trust Advisors, Inc. | 900 | 0,00 | 96 | -1,04 | ||||
| 2026-02-10 | 13F | Goldman Sachs Group Inc | 1.081.078 | -21,38 | 115.794 | -20,92 | ||||
| 2026-02-11 | 13F | Endeavor Private Wealth, Inc. | 16.150 | 27,40 | 1.730 | 28,17 | ||||
| 2026-04-08 | 13F | Leonard Rickey Investment Advisors P.L.L.C. | 112.382 | 3,40 | 11.929 | 2,47 | ||||
| 2026-01-29 | 13F | Concurrent Investment Advisors, LLC | 37.981 | 4,31 | 4.068 | 4,93 | ||||
| 2026-01-14 | 13F | ORG Partners LLC | 35.277 | 0,10 | 3.779 | 0,75 | ||||
| 2026-04-13 | 13F | Stockman Wealth Management, Inc. | 2.246 | 238 | ||||||
| 2026-02-03 | 13F | Chesapeake Capital Corp /il/ | 39.960 | 0,00 | 4.280 | 0,59 | ||||
| 2026-04-21 | 13F | Columbus Macro, LLC | 1.953 | -0,10 | 207 | -0,96 | ||||
| 2025-11-12 | 13F | Compass Capital Corp /ma/ /adv | 0 | -100,00 | 0 | |||||
| 2026-01-21 | 13F/A | Efficient Advisors, LLC | 2.471 | -10,95 | 265 | -10,51 | ||||
| 2026-04-09 | 13F | Baron Financial Group, LLC | 2.420 | 0,00 | 257 | -1,16 | ||||
| 2026-04-20 | 13F | Boston Standard Wealth Management, LLC | 212.459 | 1,06 | 22.568 | 0,23 | ||||
| 2026-02-11 | 13F | Motley Fool Wealth Management, LLC | 14.343 | -4,39 | 1.536 | -3,82 | ||||
| 2026-04-15 | 13F | Eaton Financial Holdings Company, LLC | 2.787 | -8,44 | 296 | -9,51 | ||||
| 2026-02-17 | 13F | Capital Insight Partners, Llc | 131.357 | -11,15 | 14.070 | -10,63 | ||||
| 2025-11-14 | 13F | Wolverine Trading, Llc | Put | 112.900 | -45,88 | 12.015 | -44,79 | |||
| 2025-11-14 | 13F | Wolverine Trading, Llc | 65.791 | -12,97 | 7.001 | -11,22 | ||||
| 2025-11-14 | 13F | Wolverine Trading, Llc | Call | 231.500 | 35,06 | 24.636 | 37,79 | |||
| 2026-02-09 | 13F | Integrity Advisory Solutions, LLC | 15.938 | 8,00 | 1.707 | 8,66 | ||||
| 2025-11-06 | 13F | Financial Advocates Investment Management | 27.564 | -42,65 | 2.935 | -41,55 | ||||
| 2026-04-16 | 13F | Phillips Financial Management, Llc | 36.418 | -36,00 | 3.866 | -36,59 | ||||
| 2025-11-21 | 13F | Forefront Analytics, LLC | 0 | -100,00 | 0 | -100,00 | ||||
| 2026-02-10 | 13F | Rothschild Investment Llc | 598 | 1.290,70 | 64 | 1.500,00 | ||||
| 2026-04-21 | 13F | Northern Lights Advisors, Inc. | 12.625 | -3,77 | 1.340 | -4,63 | ||||
| 2026-02-04 | 13F | Dynamic Wealth Strategies, LLC | 3.394 | 0,00 | 364 | 0,55 | ||||
| 2026-01-29 | 13F | Golden State Equity Partners | 2.034 | 218 | ||||||
| 2026-02-13 | 13F | Change Path, LLC | 43.635 | 0,17 | 4.674 | 0,75 | ||||
| 2026-04-08 | 13F | Graves-Light Private Wealth Management, Inc. | 16.553 | 0,04 | 1.757 | -0,85 | ||||
| 2026-04-22 | 13F | Smallwood Wealth Investment Management, LLC | 17.800 | -0,67 | 1.889 | -1,56 | ||||
| 2026-02-12 | 13F | Advisory Resource Group | 2.909 | -16,58 | 312 | -16,17 | ||||
| 2026-02-13 | 13F | Icon Wealth Advisors, LLC | 218.218 | -2,20 | 23.373 | -1,63 | ||||
| 2026-02-13 | 13F | Glen Eagle Advisors, LLC | 209 | 12,97 | 22 | 15,79 | ||||
| 2026-04-15 | 13F | Horizon Financial Services, Llc | 400 | -8,88 | 42 | -10,64 | ||||
| 2026-02-13 | 13F | Hurley Capital, LLC | 176 | 1,15 | 19 | 0,00 | ||||
| 2026-04-16 | 13F | Smith Thornton Advisors LLC | 6.095 | 0,00 | 647 | -0,92 | ||||
| 2026-04-20 | 13F | Ritholtz Wealth Management | 5.798 | 615 | ||||||
| 2026-01-15 | 13F | Victory Financial Group, Llc | 7.591 | 24,14 | 813 | 24,88 |