Grundlæggende statistik
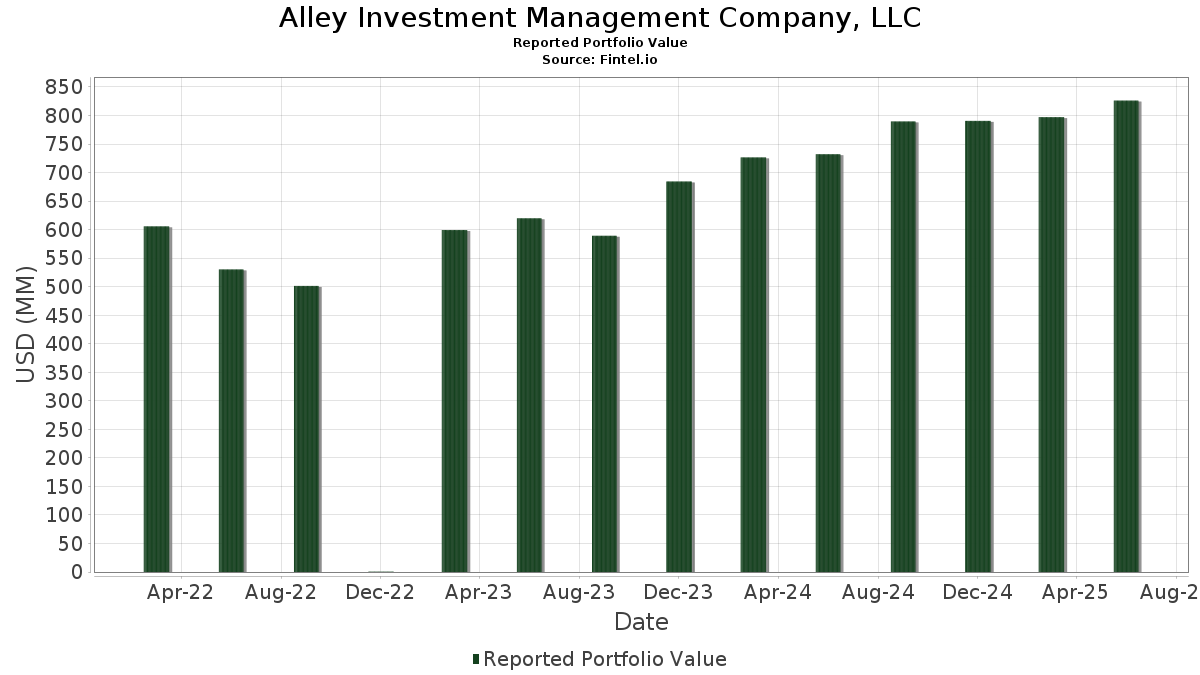
| Porteføljeværdi | $ 826.164.292 |
| Nuværende stillinger | 85 |
Seneste beholdninger, ydeevne, AUM (fra 13F, 13D)
Alley Investment Management Company, LLC har afsløret 85 samlede besiddelser i deres seneste SEC-arkivering. Den seneste porteføljeværdi er beregnet til at være $ 826.164.292 USD. Faktiske aktiver under forvaltning (AUM) er denne værdi plus kontanter (som ikke er oplyst). Alley Investment Management Company, LLCs største beholdninger er JPMorgan Chase & Co. (US:JPM) , Microsoft Corporation (US:MSFT) , Philip Morris International Inc. (US:PM) , Ameriprise Financial, Inc. (US:AMP) , and Apple Inc. (US:AAPL) . Alley Investment Management Company, LLCs nye stillinger omfatter Capital One Financial Corporation (US:COF) , AT&T Inc. (US:T) , Invesco QQQ Trust, Series 1 (US:QQQ) , .
Top øger dette kvartal
Vi bruger ændringen i porteføljeallokeringen, fordi dette er den mest meningsfulde metrik. Ændringer kan skyldes handler eller ændringer i aktiekurser.
| Sikkerhed | Aktier (MM) |
Værdi (MM$) |
Portefølje % | ΔPortefølje % |
|---|---|---|---|---|
| 0,06 | 12,82 | 1,5517 | 1,5517 | |
| 0,11 | 16,64 | 2,0136 | 0,8239 | |
| 0,06 | 30,54 | 3,6970 | 0,7904 | |
| 0,13 | 37,27 | 4,5117 | 0,5264 | |
| 0,13 | 3,88 | 0,4702 | 0,4702 | |
| 0,02 | 15,21 | 1,8406 | 0,3454 | |
| 0,16 | 29,38 | 3,5564 | 0,3170 | |
| 0,07 | 9,73 | 1,1779 | 0,2637 | |
| 0,03 | 9,49 | 1,1482 | 0,2428 | |
| 0,09 | 20,32 | 2,4594 | 0,2319 |
Top falder i dette kvartal
Vi bruger ændringen i porteføljeallokeringen, fordi dette er den mest meningsfulde metrik. Ændringer kan skyldes handler eller ændringer i aktiekurser.
| Sikkerhed | Aktier (MM) |
Værdi (MM$) |
Portefølje % | ΔPortefølje % |
|---|---|---|---|---|
| 0,12 | 21,85 | 2,6449 | -0,4188 | |
| 0,14 | 27,76 | 3,3601 | -0,4019 | |
| 0,12 | 16,48 | 1,9950 | -0,3768 | |
| 0,16 | 23,49 | 2,8431 | -0,2924 | |
| 0,06 | 19,69 | 2,3834 | -0,2565 | |
| 0,02 | 11,87 | 1,4369 | -0,2126 | |
| 0,20 | 21,40 | 2,5903 | -0,1956 | |
| 0,03 | 17,66 | 2,1370 | -0,1900 | |
| 0,36 | 19,11 | 2,3128 | -0,1812 | |
| 0,06 | 17,02 | 2,0601 | -0,1596 |
13F og Fondsarkivering
Denne formular blev indsendt den 2025-07-18 for rapporteringsperioden 2025-06-30. Klik på linkikonet for at se den fulde transaktionshistorik.
Opgrader for at låse op for premium-data og eksportere til Excel ![]() .
.
| Sikkerhed | Type | Gennemsnitlig aktiekurs | Aktier (MM) |
Δ Aktier (%) |
Δ Aktier (%) |
Værdi ($MM) |
Portefølje (%) |
ΔPortefølje (%) |
|
|---|---|---|---|---|---|---|---|---|---|
| JPM / JPMorgan Chase & Co. | 0,13 | -0,73 | 37,27 | 17,33 | 4,5117 | 0,5264 | |||
| MSFT / Microsoft Corporation | 0,06 | -0,51 | 30,54 | 31,82 | 3,6970 | 0,7904 | |||
| PM / Philip Morris International Inc. | 0,16 | -0,84 | 29,38 | 13,78 | 3,5564 | 0,3170 | |||
| AMP / Ameriprise Financial, Inc. | 0,05 | -5,73 | 28,42 | 3,94 | 3,4394 | 0,0097 | |||
| AAPL / Apple Inc. | 0,14 | 0,22 | 27,76 | -7,43 | 3,3601 | -0,4019 | |||
| PAYX / Paychex, Inc. | 0,16 | -0,33 | 23,49 | -6,03 | 2,8431 | -0,2924 | |||
| BLK / BlackRock, Inc. | 0,02 | 0,20 | 22,96 | 11,07 | 2,7793 | 0,1861 | |||
| ABBV / AbbVie Inc. | 0,12 | 0,99 | 21,85 | -10,53 | 2,6449 | -0,4188 | |||
| LQD / iShares Trust - iShares iBoxx $ Investment Grade Corporate Bond ETF | 0,20 | -4,44 | 21,40 | -3,63 | 2,5903 | -0,1956 | |||
| COST / Costco Wholesale Corporation | 0,02 | -0,30 | 21,28 | 4,36 | 2,5754 | 0,0177 | |||
| AMZN / Amazon.com, Inc. | 0,09 | -0,77 | 20,32 | 14,43 | 2,4594 | 0,2319 | |||
| HD / The Home Depot, Inc. | 0,05 | 0,47 | 19,86 | 0,51 | 2,4033 | -0,0749 | |||
| AJG / Arthur J. Gallagher & Co. | 0,06 | 0,91 | 19,69 | -6,43 | 2,3834 | -0,2565 | |||
| ABT / Abbott Laboratories | 0,14 | 0,16 | 19,41 | 2,69 | 2,3489 | -0,0216 | |||
| IGSB / iShares Trust - iShares 1-5 Year Investment Grade Corporate Bond ETF | 0,36 | -4,60 | 19,11 | -3,89 | 2,3128 | -0,1812 | |||
| UNP / Union Pacific Corporation | 0,08 | 0,09 | 18,03 | -2,52 | 2,1827 | -0,1380 | |||
| MA / Mastercard Incorporated | 0,03 | -7,16 | 17,66 | -4,82 | 2,1370 | -0,1900 | |||
| GOOGL / Alphabet Inc. | 0,10 | -0,88 | 17,11 | 12,96 | 2,0713 | 0,1709 | |||
| ACN / Accenture plc | 0,06 | 0,42 | 17,02 | -3,81 | 2,0601 | -0,1596 | |||
| NVDA / NVIDIA Corporation | 0,11 | 20,33 | 16,64 | 75,43 | 2,0136 | 0,8239 | |||
| CVX / Chevron Corporation | 0,12 | 1,85 | 16,48 | -12,83 | 1,9950 | -0,3768 | |||
| INTU / Intuit Inc. | 0,02 | -0,55 | 15,21 | 27,58 | 1,8406 | 0,3454 | |||
| LMT / Lockheed Martin Corporation | 0,03 | -0,15 | 14,51 | 3,52 | 1,7563 | -0,0020 | |||
| BND / Vanguard Bond Index Funds - Vanguard Total Bond Market ETF | 0,19 | -4,72 | 14,36 | -4,48 | 1,7376 | -0,1478 | |||
| SBUX / Starbucks Corporation | 0,15 | 2,34 | 14,09 | -4,40 | 1,7049 | -0,1434 | |||
| NEE / NextEra Energy, Inc. | 0,20 | 0,49 | 13,73 | -1,59 | 1,6620 | -0,0883 | |||
| SYK / Stryker Corporation | 0,03 | -0,36 | 13,49 | 5,90 | 1,6323 | 0,0348 | |||
| MUB / iShares Trust - iShares National Muni Bond ETF | 0,13 | -0,54 | 13,47 | -1,44 | 1,6308 | -0,0841 | |||
| COF / Capital One Financial Corporation | 0,06 | 12,82 | 1,5517 | 1,5517 | |||||
| BR / Broadridge Financial Solutions, Inc. | 0,05 | -0,74 | 12,48 | -0,50 | 1,5106 | -0,0629 | |||
| BRK.B / Berkshire Hathaway Inc. | 0,02 | -1,02 | 11,87 | -9,71 | 1,4369 | -0,2126 | |||
| PLD / Prologis, Inc. | 0,11 | 2,12 | 11,63 | -3,97 | 1,4076 | -0,1116 | |||
| HYG / iShares Trust - iShares iBoxx $ High Yield Corporate Bond ETF | 0,13 | -4,32 | 10,65 | -2,19 | 1,2891 | -0,0767 | |||
| GJR / Strats Trust For Procter & Gambel Security - Preferred Security | 0,06 | 0,57 | 10,25 | -5,98 | 1,2408 | -0,1269 | |||
| LLY / Eli Lilly and Company | 0,01 | 0,52 | 10,18 | -5,12 | 1,2320 | -0,1138 | |||
| MS / Morgan Stanley | 0,07 | 10,60 | 9,73 | 33,52 | 1,1779 | 0,2637 | |||
| ETN / Eaton Corporation plc | 0,03 | 0,08 | 9,49 | 31,44 | 1,1482 | 0,2428 | |||
| PH / Parker-Hannifin Corporation | 0,01 | 1,54 | 9,33 | 16,67 | 1,1292 | 0,1261 | |||
| ITW / Illinois Tool Works Inc. | 0,04 | 0,53 | 9,31 | 0,23 | 1,1271 | -0,0385 | |||
| DUK / Duke Energy Corporation | 0,08 | 1,09 | 9,19 | -2,19 | 1,1128 | -0,0664 | |||
| VZ_KZ / Verizon Communications Inc. | 0,20 | 1,03 | 8,71 | -3,62 | 1,0537 | -0,0794 | |||
| DHR / Danaher Corporation | 0,04 | -1,04 | 8,70 | -4,65 | 1,0530 | -0,0915 | |||
| SNA / Snap-on Incorporated | 0,03 | 0,33 | 8,15 | -7,35 | 0,9870 | -0,1172 | |||
| IJH / iShares Trust - iShares Core S&P Mid-Cap ETF | 0,13 | 0,12 | 8,00 | 6,41 | 0,9687 | 0,0253 | |||
| IJR / iShares Trust - iShares Core S&P Small-Cap ETF | 0,07 | 0,14 | 7,86 | 4,66 | 0,9513 | 0,0092 | |||
| CSCO / Cisco Systems, Inc. | 0,11 | 1,29 | 7,64 | 13,89 | 0,9243 | 0,0831 | |||
| AMGN / Amgen Inc. | 0,03 | 1,13 | 6,99 | -9,37 | 0,8467 | -0,1215 | |||
| PSX / Phillips 66 | 0,06 | 1,39 | 6,84 | -2,03 | 0,8277 | -0,0480 | |||
| CSL / Carlisle Companies Incorporated | 0,02 | 0,67 | 6,61 | 10,41 | 0,7999 | 0,0490 | |||
| USB / U.S. Bancorp | 0,14 | 1,91 | 6,49 | 9,22 | 0,7857 | 0,0402 | |||
| KVUE / Kenvue Inc. | 0,27 | 3,33 | 5,70 | -9,81 | 0,6900 | -0,1029 | |||
| VEA / Vanguard Tax-Managed Funds - Vanguard FTSE Developed Markets ETF | 0,09 | -1,93 | 4,97 | 9,99 | 0,6012 | 0,0347 | |||
| VWO / Vanguard International Equity Index Funds - Vanguard FTSE Emerging Markets ETF | 0,10 | 0,19 | 4,89 | 9,51 | 0,5924 | 0,0317 | |||
| SPY / SPDR S&P 500 ETF | 0,01 | -0,28 | 4,60 | 10,12 | 0,5572 | 0,0329 | |||
| WEC / WEC Energy Group, Inc. | 0,04 | 1,74 | 4,54 | -2,72 | 0,5498 | -0,0360 | |||
| CME / CME Group Inc. | 0,02 | 0,00 | 4,33 | 3,91 | 0,5241 | 0,0013 | |||
| T / AT&T Inc. | 0,13 | 3,88 | 0,4702 | 0,4702 | |||||
| VV / Vanguard Index Funds - Vanguard Large-Cap ETF | 0,01 | 0,00 | 2,78 | 11,00 | 0,3360 | 0,0223 | |||
| IWM / iShares Trust - iShares Russell 2000 ETF | 0,01 | 0,00 | 2,63 | 8,19 | 0,3181 | 0,0133 | |||
| MO / Altria Group, Inc. | 0,04 | 0,00 | 2,34 | -2,29 | 0,2836 | -0,0173 | |||
| IWR / iShares Trust - iShares Russell Mid-Cap ETF | 0,02 | 0,00 | 2,20 | 8,10 | 0,2666 | 0,0110 | |||
| GOOG / Alphabet Inc. | 0,01 | -0,57 | 2,06 | 12,92 | 0,2496 | 0,0205 | |||
| MCHP / Microchip Technology Incorporated | 0,02 | -0,03 | 1,68 | 45,29 | 0,2035 | 0,0584 | |||
| SCHX / Schwab Strategic Trust - Schwab U.S. Large-Cap ETF | 0,05 | -7,15 | 1,25 | 2,71 | 0,1517 | -0,0013 | |||
| XLK / The Select Sector SPDR Trust - The Technology Select Sector SPDR Fund | 0,00 | -4,79 | 1,10 | 16,72 | 0,1328 | 0,0149 | |||
| VUG / Vanguard Index Funds - Vanguard Growth ETF | 0,00 | 0,33 | 1,05 | 18,56 | 0,1277 | 0,0161 | |||
| FAST / Fastenal Company | 0,03 | 100,00 | 1,05 | 8,34 | 0,1273 | 0,0055 | |||
| EFA / iShares Trust - iShares MSCI EAFE ETF | 0,01 | -1,88 | 0,81 | 7,40 | 0,0984 | 0,0034 | |||
| DVY / iShares Trust - iShares Select Dividend ETF | 0,01 | 1,28 | 0,76 | 0,26 | 0,0918 | -0,0032 | |||
| BRK.B / Berkshire Hathaway Inc. | 0,00 | 0,00 | 0,73 | -8,77 | 0,0882 | -0,0119 | |||
| JNJ / Johnson & Johnson | 0,00 | -3,08 | 0,60 | -10,78 | 0,0723 | -0,0116 | |||
| AVGO / Broadcom Inc. | 0,00 | 5,03 | 0,55 | 73,10 | 0,0662 | 0,0265 | |||
| CRM / Salesforce, Inc. | 0,00 | 0,00 | 0,55 | 1,68 | 0,0660 | -0,0013 | |||
| V / Visa Inc. | 0,00 | -6,13 | 0,41 | -5,07 | 0,0500 | -0,0045 | |||
| SCHD / Schwab Strategic Trust - Schwab U.S. Dividend Equity ETF | 0,01 | -4,59 | 0,39 | -9,39 | 0,0467 | -0,0068 | |||
| ICSH / iShares U.S. ETF Trust - iShares Ultra Short Duration Bond Active ETF | 0,01 | -2,63 | 0,37 | -2,60 | 0,0454 | -0,0029 | |||
| SCHZ / Schwab Strategic Trust - Schwab U.S. Aggregate Bond ETF | 0,01 | 0,79 | 0,35 | 1,17 | 0,0420 | -0,0010 | |||
| WMT / Walmart Inc. | 0,00 | 0,00 | 0,33 | 11,53 | 0,0398 | 0,0028 | |||
| XEL / Xcel Energy Inc. | 0,00 | -7,99 | 0,32 | -11,39 | 0,0387 | -0,0066 | |||
| KMB / Kimberly-Clark Corporation | 0,00 | -4,51 | 0,29 | -13,33 | 0,0347 | -0,0068 | |||
| LULU / lululemon athletica inc. | 0,00 | 0,00 | 0,29 | -15,93 | 0,0345 | -0,0081 | |||
| SCHB / Schwab Strategic Trust - Schwab U.S. Broad Market ETF | 0,01 | 0,00 | 0,25 | 10,43 | 0,0308 | 0,0020 | |||
| RTX / RTX Corporation | 0,00 | 0,00 | 0,25 | 10,43 | 0,0308 | 0,0018 | |||
| PII / Polaris Inc. | 0,01 | 0,00 | 0,22 | -0,46 | 0,0260 | -0,0011 | |||
| QQQ / Invesco QQQ Trust, Series 1 | 0,00 | 0,20 | 0,0247 | 0,0247 | |||||
| MMC / Marsh & McLennan Companies, Inc. | 0,00 | -100,00 | 0,00 | 0,0000 | |||||
| UNH / UnitedHealth Group Incorporated | 0,00 | -100,00 | 0,00 | 0,0000 | |||||
| PEP / PepsiCo, Inc. | 0,00 | -100,00 | 0,00 | 0,0000 | |||||
| DFS / Discover Financial Services | 0,00 | -100,00 | 0,00 | 0,0000 | |||||
| XOM / Exxon Mobil Corporation | 0,00 | -100,00 | 0,00 | 0,0000 | |||||
| MRK / Merck & Co., Inc. | 0,00 | -100,00 | 0,00 | 0,0000 |