Grundlæggende statistik
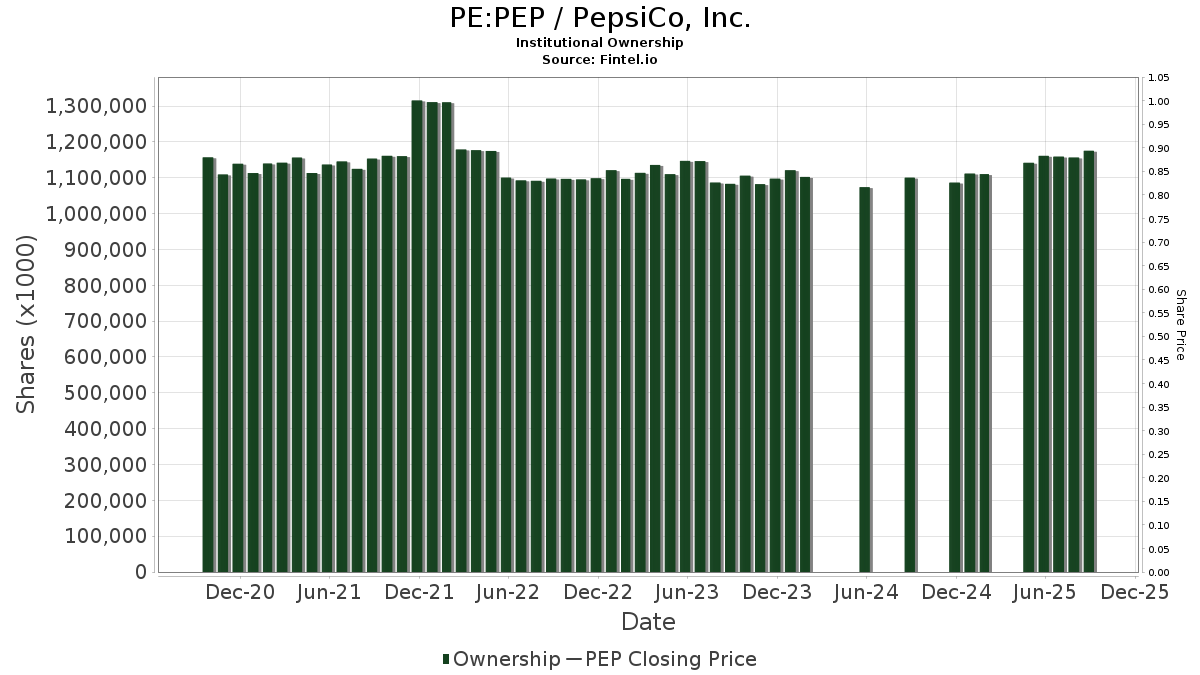
| Institutionelle aktier (lange) | 1.063.611.096 - 77,83% (ex 13D/G) - change of -82,47MM shares -7,20% MRQ |
| Institutionel værdi (lang) | $ 147.674.290 USD ($1000) |
Institutionelt ejerskab og aktionærer
PepsiCo, Inc. (PE:PEP) har 3807 institutionelle ejere og aktionærer, der har indsendt 13D/G- eller 13F-formularer til Securities Exchange Commission (SEC). Disse institutioner har i alt 1,063,618,418 aktier. Største aktionærer omfatter Vanguard Group Inc, BlackRock, Inc., State Street Corp, Geode Capital Management, Llc, Jpmorgan Chase & Co, Charles Schwab Investment Management Inc, Morgan Stanley, Bank Of America Corp /de/, Norges Bank, and Northern Trust Corp .
PepsiCo, Inc. (BVL:PEP) institutionel ejerskabsstruktur viser aktuelle positioner i virksomheden efter institutioner og fonde, samt seneste ændringer i positionsstørrelse. Større aktionærer kan omfatte individuelle investorer, investeringsforeninger, hedgefonde eller institutioner. Skema 13D angiver, at investoren besidder (eller besidder) mere end 5 % af virksomheden og har til hensigt (eller har til hensigt at) aktivt at forfølge en ændring i forretningsstrategi. Skema 13G indikerer en passiv investering på over 5%.
Fondens stemningsscore
Fund Sentiment Score (fka Ownership Accumulation Score) finder de aktier, der bliver mest købt af fonde. Det er resultatet af en sofistikeret, multi-faktor kvantitativ model, der identificerer virksomheder med de højeste niveauer af institutionel akkumulering. Scoringsmodellen bruger en kombination af den samlede stigning i oplyste ejere, ændringerne i porteføljeallokeringer i disse ejere og andre målinger. Tallet går fra 0 til 100, hvor højere tal indikerer et højere niveau af akkumulering for sine jævnaldrende, og 50 er gennemsnittet.
Opdateringsfrekvens: Dagligt
Se Ownership Explorer, som giver en liste over højest rangerende virksomheder.
AI+ Ask Fintel’s AI assistant about PepsiCo, Inc..
Select a question to share a public post with an AI-crafted answer.
Thinking of good questions…
13F og NPORT arkivering
Detaljer om 13F-arkivering er gratis. Detaljer om NP-ansøgninger kræver et premium-medlemskab. Grønne rækker angiver nye positioner. Røde rækker angiver lukkede positioner. Klik på linket ikon for at se den fulde transaktionshistorik.
Opgrader
for at låse premium-data op og eksportere til Excel ![]() .
.
Important Note
In an effort to reduce load times for our mobile users, we are testing some ways to deliver lighter pages.
In this first test, we will deliver only the most recent 750 transactions (out of 4256 for this stock). If you are interested in loading *all* the transactions for this company, click the "load all" button below. This is just a test and if you don't like it, please let us know by submitting some gentle feedback via the link at the bottom of this page.
Load All| Fil dato | Kilde | Investor | Type | Gennemsnitlig pris (Øst) |
Aktier | Δ Aktier (%) |
Rapporteret Værdi ($1000) |
Δ Værdi (%) |
Port Alloc (%) |
|
|---|---|---|---|---|---|---|---|---|---|---|
| 2026-01-30 | 13F | Folger Nolan Fleming Douglas Capital Management, Inc | 92.599 | -0,11 | 13.290 | 2,07 | ||||
| 2026-02-17 | 13F | Clearline Capital LP | 0 | -100,00 | 0 | |||||
| 2026-02-05 | 13F | RiverFront Investment Group, LLC | 4.956 | -37,72 | 711 | -36,35 | ||||
| 2026-01-27 | 13F | Michael Brady & Co., LLC | 3.475 | 499 | ||||||
| 2026-02-02 | 13F | Qrg Capital Management, Inc. | 163.938 | 5,95 | 23.528 | 8,27 | ||||
| 2025-09-19 | NP | CCOR - Core Alternative ETF | 0 | -100,00 | 0 | -100,00 | ||||
| 2026-01-02 | 13F | Boltwood Capital Management | 5.181 | -0,48 | 744 | 1,64 | ||||
| 2026-01-15 | 13F | Ironwood Financial, llc | 1.800 | 0,00 | 254 | 0,79 | ||||
| 2026-01-22 | 13F | Investment Advisory Services Inc /tx /adv | 13.330 | -7,68 | 1.913 | -5,62 | ||||
| 2026-02-17 | 13F | Lighthouse Investment Partners, LLC | 3.490 | 501 | ||||||
| 2026-02-06 | 13F | Twin Capital Management Inc | 19.802 | 10,31 | 2.842 | 12,69 | ||||
| 2026-02-04 | 13F | Dogwood Wealth Management LLC | 3.943 | 527,87 | 566 | 542,05 | ||||
| 2026-02-09 | 13F | Tandem Investment Advisors, Inc. | 0 | -100,00 | 0 | |||||
| 2026-02-09 | 13F | Quest Partners LLC | 2.183 | -6,15 | 313 | -3,99 | ||||
| 2026-01-14 | 13F | Verum Partners LLC | 1.796 | 4,97 | 258 | 7,08 | ||||
| 2026-02-11 | 13F | Compass Wealth Management LLC | 15.072 | 2.163 | ||||||
| 2025-09-24 | NP | AACRX - Strategic Allocation: Conservative Fund R Class This fund is a listed as child fund of American Century Companies Inc and if that institution has disclosed ownership in this security, then these positions will not be double counted when calculating total shares and total value | 654 | -6,84 | 90 | -5,26 | ||||
| 2026-02-17 | 13F | one8zero8, LLC | 31.770 | 0,00 | 4.560 | 2,20 | ||||
| 2026-02-13 | 13F | Karpus Management, Inc. | 1.000 | 144 | ||||||
| 2026-02-09 | 13F | Northstar Financial Companies, Inc. | 11.505 | -14,38 | 1.651 | -12,51 | ||||
| 2026-03-04 | 13F | Rehmann Capital Advisory Group | 14.039 | -5,26 | 2.015 | -3,22 | ||||
| 2025-10-17 | 13F | Financial Partners Group, Inc | 0 | -100,00 | 0 | |||||
| 2026-02-10 | 13F | Mitchell Capital Management Co | 0 | -100,00 | 0 | |||||
| 2026-02-13 | 13F | Resources Management Corp /ct/ /adv | 75.924 | -1,78 | 11 | 0,00 | ||||
| 2026-01-28 | 13F | Consolidated Planning Corp | 3.207 | -1,44 | 460 | 0,88 | ||||
| 2025-09-23 | NP | EPLIX - MainStay Epoch U.S. Equity Yield Fund Investor Class | 48.141 | -0,89 | 6.640 | 0,82 | ||||
| 2026-02-10 | 13F | Westpac Banking Corp | 16.592 | 7,56 | 2.381 | 9,93 | ||||
| 2026-01-14 | 13F | Ami Investment Management Inc | 5.587 | -1,41 | 802 | 0,75 | ||||
| 2026-02-17 | 13F | Bank Of America Corp /de/ | Put | 0 | -100,00 | 0 | ||||
| 2026-02-11 | 13F | Capital World Investors | 360.436 | 51.730 | ||||||
| 2026-01-30 | 13F | Oakworth Capital, Inc. | 9.023 | 1,95 | 1.295 | 4,19 | ||||
| 2026-01-23 | 13F | Reuter James Wealth Management, Llc | 31.830 | -0,25 | 4.568 | 1,94 | ||||
| 2026-02-06 | 13F | Payden & Rygel | 73.400 | -32,41 | 11 | -33,33 | ||||
| 2026-02-04 | 13F | Invst, LLC | 0 | -100,00 | 0 | |||||
| 2026-01-28 | 13F | Proathlete Wealth Management Llc | 634 | 4,45 | 91 | 7,06 | ||||
| 2026-02-14 | 13F | Silver Grove Financial Group, Inc. | 1.568 | 6,16 | 225 | 8,70 | ||||
| 2026-01-23 | 13F | LOM Asset Management Ltd | 17.358 | -8,30 | 2.491 | -6,32 | ||||
| 2026-02-17 | 13F | Coppell Advisory Solutions LLC | 12.294 | -31,23 | 1.772 | -29,26 | ||||
| 2026-02-13 | 13F | Archetype Wealth Partners | 2.478 | -38,20 | 0 | |||||
| 2026-02-03 | 13F | RB Capital Management, LLC | 30.803 | -3,92 | 4.421 | -1,82 | ||||
| 2026-01-23 | 13F | Smith, Moore & Co. | 17.382 | -5,95 | 2.495 | -3,89 | ||||
| 2026-02-11 | 13F | XML Financial, LLC | 13.064 | -0,93 | 1.875 | 1,24 | ||||
| 2026-01-14 | 13F | Mitchell & Pahl Private Wealth, Llc | 13.257 | 5,52 | 1.903 | 7,82 | ||||
| 2026-01-06 | 13F | Martin Capital Partners, LLC | 39.672 | 1,19 | 6 | 0,00 | ||||
| 2025-09-25 | NP | DCOR - Dimensional US Core Equity 1 ETF | 53.360 | 42,40 | 7.359 | 44,86 | ||||
| 2026-01-21 | 13F | MBA Advisors LLC | 6.771 | 2,27 | 972 | 4,52 | ||||
| 2026-01-28 | 13F | Old National Bancorp /in/ | 59.385 | -5,59 | 8.523 | -3,53 | ||||
| 2026-02-17 | 13F | Sagewood Asset Management LP | 42.344 | 6.077 | ||||||
| 2026-02-02 | 13F | GenTrust, LLC | 5.299 | 56,82 | 768 | 62,03 | ||||
| 2025-11-06 | 13F | Claudia M.p. Batlle, Crp (r) Llc | 0 | -100,00 | 0 | |||||
| 2026-01-14 | 13F | Southland Equity Partners LLC | 13.402 | -1,41 | 1.923 | 0,73 | ||||
| 2026-02-03 | 13F | Gateway Investment Advisers Llc | 297.834 | 1,28 | 42.745 | 3,50 | ||||
| 2026-02-17 | 13F | Public Employees Retirement System Of Ohio | 551.550 | 0,44 | 79.158 | 2,64 | ||||
| 2025-09-25 | NP | AMECX - INCOME FUND OF AMERICA Class A | 484.503 | 0,00 | 66.823 | 1,73 | ||||
| 2026-01-20 | 13F | Savvy Advisors, Inc. | 27.996 | 35,80 | 4.018 | 38,79 | ||||
| 2026-02-13 | 13F | United Bank | 57.935 | -10,25 | 8.315 | -8,28 | ||||
| 2026-02-03 | 13F | Lumbard & Kellner, LLC | 2.640 | 0,00 | 379 | 2,16 | ||||
| 2026-02-18 | 13F | Beacon Pointe Advisors, LLC | 143.688 | 8,69 | 20.622 | 11,08 | ||||
| 2026-02-13 | 13F | SYM FINANCIAL Corp | 7.996 | 5,47 | 1.148 | 7,80 | ||||
| 2026-01-09 | 13F | Diversified Trust Co | 77.406 | 0,37 | 11.109 | 2,58 | ||||
| 2026-01-27 | 13F | Berger Financial Group, Inc | 43.982 | -1,77 | 6.312 | 0,40 | ||||
| 2026-02-09 | 13F | Arnhold LLC | 23.222 | 0,00 | 3.333 | 2,18 | ||||
| 2026-02-09 | 13F | Carl P. Sherr & Co., LLC | 2.112 | -5,59 | 324 | 3,18 | ||||
| 2026-02-03 | 13F | CORDA Investment Management, LLC. | 300.958 | 0,20 | 43.194 | 2,39 | ||||
| 2026-02-13 | 13F | Blueshift Asset Management, LLC | 1.781 | -65,66 | 256 | -64,97 | ||||
| 2026-02-14 | 13F | Elefante Mark B | 2.875 | -1,54 | 413 | 0,49 | ||||
| 2026-01-26 | 13F | RBA Wealth Management, LLC | 2.020 | -3,44 | 290 | -1,37 | ||||
| 2026-02-17 | 13F | Stokes Family Office, LLC | 33.789 | 8,78 | 4.849 | 11,16 | ||||
| 2026-02-05 | 13F | Conning Inc. | 232.512 | -2,01 | 33.370 | 0,14 | ||||
| 2026-01-29 | 13F | Dupree Financial Group, LLC | 2.782 | 0,00 | 399 | 2,31 | ||||
| 2026-01-30 | 13F | North Star Investment Management Corp. | 47.701 | -0,02 | 6.846 | 2,18 | ||||
| 2026-01-12 | 13F | World Equity Group, Inc. | 4.268 | 613 | ||||||
| 2026-02-03 | 13F | Patten & Patten Inc/tn | 49.569 | -2,96 | 7.114 | -0,82 | ||||
| 2026-02-10 | 13F | EagleClaw Capital Managment, LLC | 7.460 | 0,00 | 1.071 | 2,20 | ||||
| 2026-02-11 | 13F | Parallel Advisors, LLC | 54.086 | 5,99 | 7.762 | 8,32 | ||||
| 2026-02-19 | 13F | Atomi Financial Group, Inc. | 13.222 | 30,18 | 1.898 | 33,03 | ||||
| 2026-02-28 | 13F | NCM Capital Management, LLC | 8.281 | 0,00 | 1.188 | 2,24 | ||||
| 2026-01-21 | 13F | Country Trust Bank | 166.425 | -9,62 | 23.885 | -7,64 | ||||
| 2026-01-09 | 13F | Somerset Trust Co | 22.036 | 3,00 | 3.163 | 5,26 | ||||
| 2026-02-13 | 13F | Portfolio Resources Advisor Group, Inc. | 30 | 4 | ||||||
| 2025-11-05 | 13F | Lokken Investment Group LLC | 9.814 | 5,94 | 1.378 | 12,67 | ||||
| 2025-11-12 | 13F | Harvest Portfolios Group Inc. | 0 | -100,00 | 0 | |||||
| 2026-01-30 | 13F | Turning Point Benefit Group, Inc. | 125 | -4,58 | 18 | -5,56 | ||||
| 2025-09-26 | NP | NUGAX - Nuveen Santa Barbara Global Dividend Growth Fund Class A This fund is a listed as child fund of Nuveen Asset Management, LLC and if that institution has disclosed ownership in this security, then these positions will not be double counted when calculating total shares and total value | 1.697 | -3,08 | 234 | -1,27 | ||||
| 2026-02-10 | 13F | Operose Advisors LLC | 622 | -8,53 | 89 | -6,32 | ||||
| 2026-02-17 | 13F | Two Sigma Investments, Lp | 44.998 | 562,12 | 6.458 | 576,94 | ||||
| 2026-02-13 | 13F | 71 West Capital Partners | 5.643 | 810 | ||||||
| 2026-02-13 | 13F | Searle & Co. | 0 | -100,00 | 0 | |||||
| 2026-02-11 | 13F | Eldridge Investment Advisors, Inc. | 1.527 | 0,00 | 219 | 2,34 | ||||
| 2026-02-12 | 13F | Federation des caisses Desjardins du Quebec | 162.903 | 3,80 | 23.379 | 6,08 | ||||
| 2026-02-13 | 13F | Vivaldi Capital Management, LLC | 39.928 | 2,90 | 5.730 | 5,16 | ||||
| 2026-02-11 | 13F | MidWestOne Financial Group, Inc. | 10.213 | -5,34 | 1.466 | -3,30 | ||||
| 2026-02-17 | 13F | Bank Of America Corp /de/ | Call | 0 | -100,00 | 0 | ||||
| 2026-01-08 | 13F | Sanders Morris Harris Llc | 0 | -100,00 | 0 | -100,00 | ||||
| 2025-11-14 | 13F | Eqis Capital Management, Inc. | 0 | -100,00 | 0 | |||||
| 2025-10-22 | 13F | BCS Wealth Management | 0 | -100,00 | 0 | |||||
| 2026-01-26 | 13F | Old Point Trust & Financial Services N A | 51.309 | -1,91 | 7.364 | 0,23 | ||||
| 2026-02-13 | 13F | Southeast Asset Advisors Inc. | 0 | -100,00 | 0 | |||||
| 2026-02-09 | 13F | Mediolanum International Funds Ltd | 208.139 | -17,70 | 30.005 | -15,36 | ||||
| 2026-02-12 | 13F | Richard W. Paul & Associates, LLC | 5.104 | 7,79 | 733 | 10,08 | ||||
| 2025-11-17 | 13F | PharVision Advisers, LLC | 0 | -100,00 | 0 | |||||
| 2026-02-06 | 13F | Paradigm Capital Management, LLC/NV | 2.535 | 0,00 | 0 | |||||
| 2026-01-26 | 13F | Riverview Trust Co | 2.418 | 0,00 | 347 | 2,36 | ||||
| 2025-11-13 | 13F | Landscape Capital Management, L.l.c. | 0 | -100,00 | 0 | -100,00 | ||||
| 2026-02-17 | 13F/A | Beverly Hills Private Wealth, LLC | 36.422 | -2,89 | 5.227 | -0,76 | ||||
| 2026-01-26 | 13F | Whittier Trust Co | 97.084 | -5,86 | 13.491 | -7,86 | ||||
| 2025-10-08 | 13F | RDA Financial Network | 0 | -100,00 | 0 | -100,00 | ||||
| 2026-01-06 | 13F | Advance Capital Management, Inc. | 1.838 | 0,49 | 264 | 2,73 | ||||
| 2026-02-17 | 13F | Gallagher Fiduciary Advisors, LLC | 3.478 | -0,71 | 499 | 1,63 | ||||
| 2026-02-11 | 13F | OneAscent Financial Services LLC | 3.116 | 24,89 | 447 | 27,71 | ||||
| 2026-01-22 | 13F | Roffman Miller Associates Inc /pa/ | 263.774 | 1,12 | 37.857 | 3,34 | ||||
| 2026-01-26 | 13F | Thomasville National Bank | 12.792 | -1,43 | 1.836 | 0,71 | ||||
| 2026-02-04 | 13F | Community Bank, N.A. | 68.119 | 1,81 | 9.776 | 4,04 | ||||
| 2026-02-11 | 13F | Clearbridge Investments, LLC | 551.984 | -29,97 | 79.221 | -28,43 | ||||
| 2025-09-26 | NP | PFM - Invesco Dividend Achievers ETF | 39.445 | -1,11 | 5.440 | 0,61 | ||||
| 2026-02-10 | 13F | IAG Wealth Partners, LLC | 500 | 0,00 | 72 | 1,43 | ||||
| 2026-02-13 | 13F | Citigroup Inc | Call | 230.600 | 19,17 | 33.096 | 21,78 | |||
| 2026-01-15 | 13F | Nikulski Financial, Inc. | 2.476 | 5,81 | 355 | 8,23 | ||||
| 2026-02-11 | 13F | Capital Wealth Planning, LLC | 20.703 | 59,70 | 2.971 | 63,24 | ||||
| 2026-02-12 | 13F | Bank of Jackson Hole Trust | 0 | -100,00 | 0 | |||||
| 2026-02-13 | 13F | Citigroup Inc | Put | 879.600 | 6,90 | 126.240 | 9,25 | |||
| 2026-01-16 | 13F | BridgePort Financial Solutions, LLC | 1.790 | -7,73 | 257 | -5,88 | ||||
| 2026-02-13 | 13F | Citigroup Inc | 1.873.863 | -12,42 | 268.937 | -10,49 | ||||
| 2025-09-24 | NP | GLOF - iShares Edge MSCI Multifactor Global ETF | 5.120 | 9,05 | 706 | 11,01 | ||||
| 2026-02-06 | 13F | Frisch Financial Group, Inc. | 2.978 | -5,31 | 432 | -2,27 | ||||
| 2025-09-29 | NP | LGDX - Intech S&P Large Cap Diversified Alpha ETF | 109 | 26,74 | 15 | 36,36 | ||||
| 2025-09-29 | NP | AIM INTERNATIONAL MUTUAL FUNDS (INVESCO INTERNATIONAL MUTUAL FUNDS) - Invesco Global Responsibility Equity Fund Class A | 1.329 | 7,09 | 183 | 8,93 | ||||
| 2026-02-13 | 13F | GM Advisory Group, Inc. | 2.193 | 315 | ||||||
| 2026-02-10 | 13F | Calton & Associates, Inc. | 2.309 | 10,43 | 331 | 12,97 | ||||
| 2026-02-05 | 13F | Littlejohn Financial Services, Inc. | 0 | -100,00 | 0 | |||||
| 2026-02-27 | 13F | Compass Financial Services Inc | 275 | 0,00 | 39 | 2,63 | ||||
| 2026-02-13 | 13F | Treasurer of the State of North Carolina | 574.173 | -6,81 | 82 | -4,65 | ||||
| 2026-01-20 | 13F | AdvisorNet Financial, Inc | 7.816 | 1,15 | 1.122 | 3,32 | ||||
| 2026-01-23 | 13F | Newton One Investments LLC | 627 | 0,00 | 90 | 2,27 | ||||
| 2026-01-27 | 13F | Old Second National Bank Of Aurora | 32.897 | -1,82 | 4.721 | 0,34 | ||||
| 2026-02-02 | 13F | Advisors Preferred, LLC | 7.000 | -19,44 | 996 | -19,95 | ||||
| 2025-09-29 | NP | AWIIX - CIBC Atlas Income Opportunities Fund Institutional Class | 58.000 | 0,00 | 7.999 | 1,73 | ||||
| 2026-02-11 | 13F | Boston Research & Management Inc | 33.959 | -5,62 | 5 | -20,00 | ||||
| 2026-01-15 | 13F | Fulcrum Capital LLC | 47.866 | 2,06 | 6.870 | 4,30 | ||||
| 2026-02-06 | 13F | Lazard Freres Gestion S.A.S. | 1.665 | 0,00 | 0 | |||||
| 2026-01-12 | 13F | Avanza Fonder AB | 158.084 | 6,34 | 22.688 | 8,68 | ||||
| 2026-01-13 | 13F | Matrix Trust Co | 382 | -95,27 | 0 | -100,00 | ||||
| 2026-01-27 | 13F | Osborne Partners Capital Management, Llc | 62.379 | -0,99 | 8.953 | 1,18 | ||||
| 2026-02-10 | 13F | Principia Wealth Advisory, LLC | 85 | 10,39 | 12 | 20,00 | ||||
| 2026-01-26 | 13F | KBC Group NV | 439.199 | -3,28 | 63 | 0,00 | ||||
| 2026-01-28 | 13F | Cadinha & Co Llc | 3.186 | 0,00 | 457 | 2,24 | ||||
| 2026-02-06 | 13F | Envestnet Portfolio Solutions, Inc. | 122.518 | 24,09 | 17.580 | 26,79 | ||||
| 2026-01-14 | 13F | Goelzer Investment Management, Inc. | 51.579 | -4,89 | 7.403 | -2,80 | ||||
| 2026-02-06 | 13F | Cullen/frost Bankers, Inc. | 87.255 | -11,66 | 12.523 | -9,73 | ||||
| 2026-01-28 | 13F | Key Client Fiduciary Advisors, LLC | 1.950 | -25,88 | 280 | -24,39 | ||||
| 2026-02-02 | 13F | Blalock Williams, Llc | 3.599 | 3,60 | 517 | 5,95 | ||||
| 2026-01-26 | 13F | Quadrant Private Wealth Management, LLC | 2.599 | 0,89 | 377 | 4,16 | ||||
| 2025-10-24 | 13F | Purus Wealth Management, LLC | 0 | -100,00 | 0 | -100,00 | ||||
| 2026-01-23 | 13F | Whitener Capital Management, Inc. | 49.458 | 4,78 | 7.098 | 7,07 | ||||
| 2026-02-13 | 13F | Northwest Bancshares, Inc. | 27.997 | 3,18 | 4.018 | 5,46 | ||||
| 2026-02-02 | 13F | Legacy Edge Advisors, LLC | 3.543 | 509 | ||||||
| 2025-09-24 | NP | BlackRock ETF Trust - BlackRock U.S. Carbon Transition Readiness ETF This fund is a listed as child fund of BlackRock, Inc. and if that institution has disclosed ownership in this security, then these positions will not be double counted when calculating total shares and total value | 32.566 | 17,03 | 4.492 | 19,06 | ||||
| 2026-02-02 | 13F | Syntax Research, Inc. | 100 | 0,00 | 14 | 0,00 | ||||
| 2026-01-12 | 13F | Brucke Financial, Inc. | 2.221 | 5,61 | 319 | 3,58 | ||||
| 2026-02-09 | 13F | Smith Chas P & Associates Pa Cpas | 259.734 | 64,31 | 37.277 | 67,91 | ||||
| 2026-02-12 | 13F | Trace Wealth Advisors, LLC | 2.531 | 0,00 | 363 | 2,25 | ||||
| 2026-02-17 | 13F | Parallax Volatility Advisers, L.P. | 62.421 | 29,68 | 8.959 | 32,51 | ||||
| 2026-02-17 | 13F | Parallax Volatility Advisers, L.P. | Call | 123.500 | 54,57 | 17.725 | 57,95 | |||
| 2026-02-17 | 13F | Parallax Volatility Advisers, L.P. | Put | 150.800 | -46,18 | 21.643 | -45,00 | |||
| 2026-01-28 | 13F | Marietta Wealth Management, LLC | 62.429 | 0,65 | 8.960 | 2,85 | ||||
| 2025-09-25 | NP | DFA INVESTMENT DIMENSIONS GROUP INC - U.S. Large Cap Equity Portfolio Institutional Class This fund is a listed as child fund of Dimensional Fund Advisors Lp and if that institution has disclosed ownership in this security, then these positions will not be double counted when calculating total shares and total value | 58.228 | -4,74 | 8.031 | -3,10 | ||||
| 2026-02-06 | 13F | Great Diamond Partners, LLC | 5.606 | -1,82 | 805 | 0,37 | ||||
| 2026-02-17 | 13F | Royal Capital Wealth Management, LLC | 5.652 | 0,00 | 811 | 2,27 | ||||
| 2026-02-13 | 13F | Voya Financial Advisors, Inc. | 4.038 | -0,25 | 582 | 2,65 | ||||
| 2025-11-13 | 13F | NS Partners Ltd | 0 | -100,00 | 0 | |||||
| 2025-09-23 | NP | PGEOX - GEORGE PUTNAM FUND OF BOSTON Class A Shares | 13.660 | -32,78 | 1.884 | -31,65 | ||||
| 2026-01-27 | 13F | Novem Group | 23.923 | 8,20 | 3.433 | 10,56 | ||||
| 2026-02-11 | 13F | West Family Investments, Inc. | 5.112 | -38,44 | 734 | -37,14 | ||||
| 2026-02-03 | 13F | Hemenway Trust Co LLC | 4.657 | -3,78 | 668 | -1,62 | ||||
| 2025-09-26 | NP | FLCOX - Fidelity Large Cap Value Index Fund This fund is a listed as child fund of Fmr Llc and if that institution has disclosed ownership in this security, then these positions will not be double counted when calculating total shares and total value | 487.254 | 280,76 | 67.202 | 287,35 | ||||
| 2026-01-20 | 13F | Analyst IMS Investment Management Services Ltd. | 0 | -100,00 | 0 | |||||
| 2026-01-23 | 13F | BSW Wealth Partners | 14.420 | -5,11 | 2.070 | -3,05 | ||||
| 2026-01-21 | 13F | Raleigh Capital Management Inc. | 15.414 | 4,05 | 2.212 | 6,35 | ||||
| 2025-10-30 | 13F | Fairway Wealth LLC | 0 | -100,00 | 0 | |||||
| 2025-09-26 | NP | BLGR - Bluemonte Large Cap Growth ETF | 8 | 1 | ||||||
| 2026-01-26 | 13F | JNBA Financial Advisors | 3.755 | -3,15 | 539 | -1,10 | ||||
| 2025-11-21 | 13F/A | CIBC Bancorp USA Inc. | 559.367 | 78.558 | ||||||
| 2026-01-30 | 13F | Ares Financial Consulting, LLC | 251 | 36 | ||||||
| 2025-10-17 | 13F | Carderock Capital Management Inc | 0 | -100,00 | 0 | |||||
| 2026-02-10 | 13F | Core Wealth Advisors, Llc | 103 | 15 | ||||||
| 2026-02-12 | 13F | Principal Securities, Inc. | 24.270 | 7,41 | 3.483 | 9,77 | ||||
| 2026-02-17 | 13F | Sterling Wealth Management, Inc. | 8.728 | 1,77 | 1.253 | 3,99 | ||||
| 2026-01-13 | 13F | Sendero Wealth Management, LLC | 22.031 | 0,70 | 3.162 | 2,90 | ||||
| 2026-01-14 | 13F | Eastern Bank | 68.438 | -51,74 | 9.822 | -50,68 | ||||
| 2026-01-26 | 13F | Townsend & Associates, Inc | 17.327 | -1,92 | 2.540 | -6,48 | ||||
| 2026-01-29 | 13F | Obermeyer Wood Investment Counsel, Lllp | 5.422 | 4,03 | 778 | 6,43 | ||||
| 2026-02-03 | 13F | Detalus Advisors, LLC | 13.255 | -1,27 | 1.902 | 0,90 | ||||
| 2026-02-09 | 13F | Shufro Rose & Co Llc | 26.420 | 2,15 | 3.792 | -2,24 | ||||
| 2025-09-25 | NP | HDUS - Hartford Disciplined US Equity ETF | 11.043 | -12,90 | 1.523 | -19,84 | ||||
| 2026-01-12 | 13F | Evanson Asset Management, LLC | 0 | -100,00 | 0 | |||||
| 2026-02-05 | 13F | Requisite Capital Management, LLC | 3.391 | -55,26 | 492 | -53,85 | ||||
| 2026-02-04 | 13F | Swiss Life Asset Management Ltd | 415.271 | 11,35 | 59.600 | 13,79 | ||||
| 2026-02-17 | 13F | Peloton Wealth Strategists | 18.695 | -10,38 | 3 | 0,00 | ||||
| 2026-02-13 | 13F | Adams Diversified Equity Fund, Inc. | 38.576 | -19,30 | 5.536 | -17,53 | ||||
| 2025-09-26 | NP | BLUC - Bluemonte Large Cap Core ETF | 7 | 1 | ||||||
| 2026-01-20 | 13F | Toth Financial Advisory Corp | 59.572 | 9,51 | 8.550 | 11,91 | ||||
| 2026-01-23 | 13F | Twelve Points Wealth Management LLC | 11.777 | -12,45 | 1.648 | -12,81 | ||||
| 2026-02-13 | 13F | Zinnia Wealth Advisory, LLC | 1.609 | 231 | ||||||
| 2026-01-14 | 13F | Waycross Partners, Llc | 4.433 | 0,00 | 636 | 2,25 | ||||
| 2026-02-02 | 13F | Caisse Des Depots Et Consignations | 0 | -100,00 | 0 | |||||
| 2026-01-29 | 13F | Dunhill Financial, LLC | 501 | 52,74 | 72 | 54,35 | ||||
| 2025-09-26 | NP | FEAMX - First Eagle Fund of America Class C | 44.711 | -1,39 | 6.167 | 0,31 | ||||
| 2025-09-29 | NP | FLAG - Global X S&P 500 U.S. Market Leaders Top 50 ETF | 578 | 1,05 | 80 | 2,60 | ||||
| 2026-01-29 | 13F | State Of Michigan Retirement System | 366.122 | -4,46 | 52.546 | -2,37 | ||||
| 2026-02-17 | 13F | Warren Averett Asset Management, LLC | 209.109 | 71,44 | 30.011 | 75,21 | ||||
| 2026-02-10 | 13F | Peak Retirement Planning, Inc. | 14.895 | 14,78 | 2.138 | 17,29 | ||||
| 2025-09-26 | NP | YOKE - Yoke Core ETF | 0 | -100,00 | 0 | -100,00 | ||||
| 2026-01-28 | 13F | Eliot Finkel Investment Counsel, LLC | 8.220 | 0,00 | 1.180 | 2,17 | ||||
| 2026-01-08 | 13F | Wealth Enhancement Advisory Services, Llc | 1.278.338 | -0,11 | 177.512 | -1,47 | ||||
| 2026-01-26 | 13F | Chicago Capital, LLC | 54.232 | 2,28 | 7.783 | 4,53 | ||||
| 2026-02-02 | 13F | Bay Harbor Wealth Management, LLC | 87 | 47,46 | 13 | 50,00 | ||||
| 2025-10-17 | 13F | Rocky Mountain Advisers, Llc | 0 | -100,00 | 0 | -100,00 | ||||
| 2025-11-14 | 13F | Wetherby Asset Management Inc | 39.137 | 5,02 | 5.496 | 11,71 | ||||
| 2026-01-08 | 13F | Signet Financial Management, Llc | 2.022 | -5,25 | 290 | -3,01 | ||||
| 2026-02-13 | 13F | Cladis Investment Advisory, LLC | 5.280 | -0,23 | 758 | 1,88 | ||||
| 2026-02-05 | 13F | Flavin Financial Services, Inc. | 9.607 | -2,47 | 1.379 | -0,36 | ||||
| 2026-02-11 | 13F | Taylor Hoffman Capital Management LLC | 7.356 | -2,39 | 1.056 | -0,28 | ||||
| 2026-01-21 | 13F | Clayton Financial Group LLC | 6.497 | 4,67 | 932 | 7,00 | ||||
| 2025-10-14 | 13F | Cliftonlarsonallen Wealth Advisors, Llc | 0 | -100,00 | 0 | |||||
| 2026-02-10 | 13F | Rothschild Investment Llc | 19.314 | 4,10 | 2.772 | 6,37 | ||||
| 2026-01-22 | 13F | City Holding Co | 25.813 | -6,14 | 3.705 | -4,09 | ||||
| 2026-01-12 | 13F | Aurdan Capital Management, LLC | 2.490 | 0,00 | 357 | 2,29 | ||||
| 2026-01-21 | 13F | Integris Wealth Management, LLC | 6.321 | 0,00 | 907 | 2,25 | ||||
| 2026-02-13 | 13F | Ariadne Wealth Management, LP | 1.806 | -36,12 | 302 | -26,41 | ||||
| 2026-02-11 | 13F | State Farm Mutual Automobile Insurance Co | 4.160.441 | 0,00 | 597.106 | 2,19 | ||||
| 2026-02-11 | 13F | Aufman Associates Inc | 1.797 | 0,00 | 258 | 1,98 | ||||
| 2026-01-15 | 13F | Royal Fund Management, LLC | 2.089 | 29,99 | 300 | 32,89 | ||||
| 2026-02-12 | 13F | Hamilton Point Investment Advisors, LLC | 6.800 | 3,77 | 986 | 7,07 | ||||
| 2026-02-05 | 13F | High Note Wealth, LLC | 387 | 28,15 | 56 | 30,95 | ||||
| 2026-01-27 | 13F | Deroy & Devereaux Private Investment Counsel Inc | 180.425 | -1,30 | 26 | 0,00 | ||||
| 2026-01-15 | 13F | Brady Martz Wealth Solutions, LLC | 6.093 | -44,95 | 874 | -43,76 | ||||
| 2026-01-28 | 13F | Mowery & Schoenfeld Wealth Management, LLC | 231 | 33 | ||||||
| 2025-09-29 | NP | PBP - Invesco S&P 500 BuyWrite ETF This fund is a listed as child fund of Invesco Ltd. and if that institution has disclosed ownership in this security, then these positions will not be double counted when calculating total shares and total value | 7.321 | 77,09 | 1.010 | 80,18 | ||||
| 2026-02-04 | 13F | JSF Financial, LLC | 1.717 | 1,48 | 246 | 3,80 | ||||
| 2026-02-03 | 13F | Cheviot Value Management, LLC | 395 | -30,34 | 59 | -31,76 | ||||
| 2025-09-29 | NP | CRTVX - CATHOLIC RESPONSIBLE INVESTMENTS MULTI-STYLE US EQUITY FUND Investor Shares | 2.604 | -1,59 | 359 | 0,28 | ||||
| 2026-02-05 | 13F | Johnson & White Wealth Management, LLC | 6.156 | 14,25 | 883 | 16,80 | ||||
| 2026-02-04 | 13F | Oregon Public Employees Retirement Fund | 156.597 | 0,03 | 22.475 | 2,22 | ||||
| 2026-02-17 | 13F | EFG International AG | 252.828 | 36.288 | ||||||
| 2026-02-13 | 13F | Whalerock Point Partners, Llc | 52.355 | 2,26 | 7.514 | 4,51 | ||||
| 2026-02-17 | 13F | Advisor Group Holdings, Inc. | 474.373 | -14,57 | 68.140 | -15,35 | ||||
| 2026-01-09 | 13F | Silvia Mccoll Wealth Management, Llc | 4.477 | -0,73 | 643 | 1,42 | ||||
| 2025-09-25 | NP | SPQAX - Pgim Jennison Global Equity Income Fund Class A | 40.719 | -21,57 | 5.616 | -20,22 | ||||
| 2026-02-09 | 13F | Knights of Columbus Asset Advisors LLC | 94.652 | 89,96 | 13.584 | 94,14 | ||||
| 2025-09-25 | NP | HQGO - Hartford US Quality Growth ETF | 1.026 | 4,16 | 142 | -4,08 | ||||
| 2026-01-12 | 13F | Spinnaker Investment Group, LLC | 2.932 | 1,17 | 421 | 3,45 | ||||
| 2026-02-12 | 13F | M&G Plc | 12.867 | 0,00 | 1.853 | 2,83 | ||||
| 2026-02-13 | 13F | Charles Schwab Investment Management Inc | 28.090.426 | 1,06 | 4.031.646 | 3,28 | ||||
| 2026-02-17 | 13F | Modern Wealth Management, LLC | 19.306 | 3,78 | 2.771 | 6,05 | ||||
| 2026-02-06 | 13F | Creative Financial Designs Inc /adv | 12.274 | -0,77 | 1.762 | 1,38 | ||||
| 2026-02-10 | 13F | Ellevest, Inc. | 6.662 | -4,14 | 956 | -2,05 | ||||
| 2026-02-13 | 13F | Sienna Gestion | 11.781 | 1.690 | ||||||
| 2026-02-13 | 13F | NLB Skladi, upravljanje premozenja, d.o.o. | 50.042 | 7.182 | ||||||
| 2026-02-13 | 13F | Brown Advisory Inc | 343.624 | 1,28 | 49.317 | 3,50 | ||||
| 2026-01-23 | 13F | Family Investment Center, Inc. | 1.770 | 0,00 | 254 | 2,42 | ||||
| 2026-02-11 | 13F | MCF Advisors LLC | 8.696 | 15,41 | 1.258 | 18,90 | ||||
| 2026-02-12 | 13F | Summit Financial, LLC | 41.332 | -1,56 | 5.990 | 1,59 | ||||
| 2025-09-25 | NP | DGRO - iShares Core Dividend Growth ETF | 4.292.160 | 18,32 | 591.975 | 20,36 | ||||
| 2026-02-13 | 13F | Templeton & Phillips Capital Management, LLC | 0 | -100,00 | 0 | |||||
| 2026-01-07 | 13F | Sagespring Wealth Partners, Llc | 16.584 | 16,47 | 2.380 | 19,06 | ||||
| 2026-01-12 | 13F | Schaper Benz & Wise Investment Counsel Inc/wi | 12.713 | -0,70 | 1.825 | 1,45 | ||||
| 2026-02-12 | 13F | New York State Common Retirement Fund | 1.606.662 | -2,08 | 230.588 | 0,07 | ||||
| 2025-09-25 | NP | DFVEX - U.s. Vector Equity Portfolio - Institutional Class This fund is a listed as child fund of Dimensional Fund Advisors Lp and if that institution has disclosed ownership in this security, then these positions will not be double counted when calculating total shares and total value | 164.268 | 47,88 | 22.656 | 50,43 | ||||
| 2026-01-14 | 13F | A. D. Beadell Investment Counsel, Inc. | 11.026 | 0,00 | 2 | 0,00 | ||||
| 2026-02-03 | 13F | International Assets Investment Management, Llc | 13.686 | -4,77 | 1.964 | 1,08 | ||||
| 2026-02-09 | 13F | Wellington Shields Capital Management, LLC | 4.284 | 0,00 | 615 | 2,16 | ||||
| 2026-02-09 | 13F | Barry Investment Advisors, LLC | 2.150 | -6,32 | 312 | -3,42 | ||||
| 2025-11-07 | 13F | Synovus Financial Corp | 79.406 | -2,55 | 11.153 | 3,65 | ||||
| 2025-09-29 | NP | AWEIX - CIBC Atlas Disciplined Equity Fund Institutional Class Shares | 116.300 | -2,32 | 16.040 | -0,63 | ||||
| 2026-02-24 | 13F | MidFirst Bank | 9.383 | 1.347 | ||||||
| 2026-01-12 | 13F | Horizon Financial Services, Llc | 0 | -100,00 | 0 | |||||
| 2026-01-15 | 13F | Capital Advisors Inc/ok | 2.213.110 | -0,13 | 317.626 | 2,06 | ||||
| 2026-02-12 | 13F | Rbo & Co Llc | 152.001 | -0,51 | 21.815 | 1,67 | ||||
| 2026-02-17 | 13F | Lazard Asset Management Llc | 1.071.055 | 16,16 | 153.718 | 18,71 | ||||
| 2026-02-17 | 13F | Evergreen Wealth Solutions, LLC | 2.186 | 314 | ||||||
| 2026-02-09 | 13F | Clear Investment Research, Llc | 0 | -100,00 | 0 | |||||
| 2026-02-12 | 13F | Advocate Investing Services LLC | 100 | 14 | ||||||
| 2026-02-17 | 13F | Snowden Capital Advisors LLC | 79.662 | 2,19 | 11.546 | 5,45 | ||||
| 2026-02-13 | 13F | 1248 Management, LLC | 259 | 0,00 | 38 | 2,78 | ||||
| 2026-02-12 | 13F | Marex Group plc | 31.234 | 98,90 | 4.483 | 103,27 | ||||
| 2025-09-24 | NP | FAB - First Trust Multi Cap Value AlphaDEX Fund This fund is a listed as child fund of First Trust Advisors Lp and if that institution has disclosed ownership in this security, then these positions will not be double counted when calculating total shares and total value | 784 | 3,02 | 108 | -5,26 | ||||
| 2026-02-17 | 13F | Core Wealth Advisors, Inc. | 2.256 | -2,25 | 324 | -0,31 | ||||
| 2025-09-19 | 13F | Canal Capital Management, LLC | 0 | -100,00 | 0 | -100,00 | ||||
| 2026-02-17 | 13F | Limestone Investment Advisors LP | Call | 1.500 | 215 | |||||
| 2026-02-17 | 13F | Limestone Investment Advisors LP | Put | 1.100 | 158 | |||||
| 2025-09-26 | NP | BVAL - Bluemonte Large Cap Value ETF | 10 | 1 | ||||||
| 2026-02-11 | 13F | Vestor Capital, Llc | 657 | 101,53 | 3 | |||||
| 2026-01-14 | 13F | First County Bank /CT/ | 7.791 | -5,12 | 1.118 | -3,04 | ||||
| 2026-01-26 | 13F | Keystone Wealth Services, LLC | 2.262 | 0,58 | 325 | 2,86 | ||||
| 2026-01-29 | 13F | Traub Capital Management LLC | 1.827 | 0,00 | 262 | 2,34 | ||||
| 2026-02-03 | 13F | Cassaday & Co Wealth Management LLC | 74.927 | -0,25 | 10.753 | 1,93 | ||||
| 2025-09-26 | NP | MSTGX - Morningstar Global Income Fund | 3.664 | 29,01 | 505 | 31,17 | ||||
| 2026-02-03 | 13F | Sigma Investment Counselors Inc | 3.158 | -3,37 | 453 | -1,09 | ||||
| 2026-01-28 | 13F | Leelyn Smith, LLC | 20.527 | 4,34 | 2.946 | 6,63 | ||||
| 2026-01-28 | 13F | Torray Llc | 135.674 | 10,64 | 19.472 | 13,07 | ||||
| 2026-02-17 | 13F | Sherman Porfolios, Llc | 1.722 | 3,36 | 247 | 5,56 | ||||
| 2026-02-02 | 13F | Avidian Wealth Solutions, LLC | 17.109 | -4,17 | 2.455 | -2,07 | ||||
| 2026-02-13 | 13F | LiftPoint Family Wealth Advisors LLC | 2.386 | 342 | ||||||
| 2026-01-21 | 13F | Canton Hathaway, LLC | 4.061 | 0,00 | 583 | 2,11 | ||||
| 2026-02-06 | 13F | Associated Banc-corp | 138.500 | -1,71 | 19.878 | 0,44 | ||||
| 2025-10-22 | 13F | Prospera Capital Management, LLC | 0 | -100,00 | 0 | -100,00 | ||||
| 2026-02-13 | 13F | Financial Network Wealth Advisors LLC | 800 | -2,68 | 115 | -0,87 | ||||
| 2025-10-24 | 13F | Opal Wealth Advisors, LLC | 0 | -100,00 | 0 | -100,00 | ||||
| 2026-01-21 | 13F | Buffalo Business & Estate Services Ltd | 1.761 | 253 | ||||||
| 2026-02-06 | 13F | Copia Wealth Management | 8 | -93,65 | 1 | -94,12 | ||||
| 2025-10-16 | 13F | Lockerman Financial Group, Inc. | 0 | -100,00 | 0 | -100,00 | ||||
| 2025-11-18 | 13F | Copley Financial Group, Inc. | 0 | -100,00 | 0 | -100,00 | ||||
| 2026-02-02 | 13F | Advanced Asset Management Advisors Inc | 26.964 | 0,00 | 3.870 | 2,19 | ||||
| 2026-02-13 | 13F | Bollard Group LLC | 30.796 | -6,91 | 4 | 0,00 | ||||
| 2026-01-07 | 13F | Capital Advantage, Inc. | 3.453 | -7,55 | 496 | -5,53 | ||||
| 2026-01-21 | 13F | Phocas Financial Corp. | 0 | -100,00 | 0 | |||||
| 2026-02-06 | 13F | Reliant Investment Partners, LLC | 1.816 | -1,36 | 261 | -0,38 | ||||
| 2026-01-28 | 13F | Kanawha Capital Management Llc | 125.091 | -0,12 | 17.953 | 2,08 | ||||
| 2025-09-26 | NP | FHEQ - Fidelity Hedged Equity ETF | 9.693 | 4.948,44 | 1.337 | 3.948,48 | ||||
| 2026-01-27 | 13F | Lodestar Private Asset Management Llc | 7.770 | -2,81 | 1.115 | -0,62 | ||||
| 2026-02-05 | 13F | Cambridge Investment Research Advisors, Inc. | 338.098 | 3,39 | 49 | 6,67 | ||||
| 2026-02-11 | 13F | Pettyjohn, Wood & White, Inc | 64.683 | 2,90 | 9.283 | 5,15 | ||||
| 2026-02-13 | 13F | Oarsman Capital, Inc. | 12.521 | 0,72 | 1.797 | 2,92 | ||||
| 2026-01-12 | 13F | Lvm Capital Management Ltd/mi | 17.910 | -6,13 | 3 | 0,00 | ||||
| 2026-01-16 | 13F | Morris Retirement Advisors, LLC | 0 | -100,00 | 0 | |||||
| 2026-02-12 | 13F | Keel Point, LLC | 5.561 | 10,29 | 798 | 12,71 | ||||
| 2025-11-10 | 13F | AMJ Financial Wealth Management | 0 | -100,00 | 0 | |||||
| 2026-01-21 | 13F | Newbridge Financial Services Group, Inc. | 1.883 | -12,42 | 270 | -10,30 | ||||
| 2025-11-14 | 13F | Mbb Public Markets I Llc | 0 | -100,00 | 0 | -100,00 | ||||
| 2025-09-29 | NP | CRQSX - CATHOLIC RESPONSIBLE INVESTMENTS EQUITY INDEX FUND Institutional Shares | 183.211 | -5,60 | 25.268 | -3,97 | ||||
| 2026-02-10 | 13F | Norges Bank | 21.034.095 | 3.018.813 | ||||||
| 2026-01-23 | 13F | Stanich Group LLC | 1.438 | -18,80 | 206 | -16,94 | ||||
| 2026-02-11 | 13F | Dearborn Partners Llc | 52.534 | -1,52 | 7.540 | 0,64 | ||||
| 2026-01-22 | 13F | Charter Trust Co | 54.914 | -1,09 | 7.881 | 1,09 | ||||
| 2026-01-20 | 13F | Trust Co Of Toledo Na /oh/ | 50.061 | -2,04 | 7.185 | 0,11 | ||||
| 2026-02-13 | 13F | Burton Enright Welch | 3.549 | 509 | ||||||
| 2026-02-04 | 13F | Oxbow Advisors, LLC | 10.225 | 3,54 | 1.468 | 5,84 | ||||
| 2026-02-13 | 13F | Avid Wealth Partners LLC | 1.634 | 235 | ||||||
| 2026-01-28 | 13F | One River Asset Management, LLC | 1.800 | 516,44 | 258 | 529,27 | ||||
| 2026-01-28 | 13F | One River Asset Management, LLC | Call | 10.700 | 345,83 | 1.536 | 355,49 | |||
| 2026-02-13 | 13F | Banco Santander, S.A. | 15.715 | 11,44 | 2.255 | 13,89 | ||||
| 2026-01-15 | 13F | Jamison Private Wealth Management, Inc. | 15.563 | 0,46 | 2.234 | 2,67 | ||||
| 2025-09-12 | NP | KNGAX - CBOE Vest S&P 500 Dividend Aristocrats Target Income Fund Class A Shares | 4.260 | -35.600,00 | 588 | -19,70 | ||||
| 2026-02-09 | 13F | Frazier Financial Advisors, LLC | 244 | -9,63 | 35 | -5,41 | ||||
| 2026-02-10 | 13F | BlackDiamond Wealth Management Inc. | 2.449 | -5,19 | 408 | 12,43 | ||||
| 2026-02-04 | 13F | Paradigm Asset Management Co Llc | 12.011 | -5,51 | 1.724 | -3,47 | ||||
| 2026-01-15 | 13F | Great Waters Wealth Management | 2.837 | 0,00 | 407 | 2,26 | ||||
| 2026-02-17 | 13F | Millennium Management Llc | 1.291.946 | 4,04 | 185.420 | 6,32 | ||||
| 2026-02-17 | 13F | Millennium Management Llc | Call | 585.100 | 57,62 | 83.974 | 61,08 | |||
| 2026-01-27 | 13F | Birch Hill Investment Advisors LLC | 184.575 | 2,57 | 26.490 | 4,82 | ||||
| 2026-02-10 | 13F | Peapack Gladstone Financial Corp | 355.842 | -1,15 | 51 | 2,00 | ||||
| 2026-02-17 | 13F | Millennium Management Llc | Put | 871.700 | 4,48 | 125.106 | 6,77 | |||
| 2026-02-11 | 13F | Vermillion Wealth Management, Inc. | 109 | -31,45 | 16 | -31,82 | ||||
| 2026-01-28 | 13F | One River Asset Management, LLC | Put | 10.500 | 337,50 | 1.507 | 346,88 | |||
| 2026-01-23 | 13F | Oxler Private Wealth LLC | 2.872 | -12,25 | 412 | -10,24 | ||||
| 2026-02-09 | 13F | Prairie Wealth Advisors, Inc. | 0 | -100,00 | 234 | -17,67 | ||||
| 2026-01-30 | 13F | Jennison Associates Llc | 205.851 | -32,81 | 29.544 | -31,34 | ||||
| 2026-02-02 | 13F | Citizens Business Bank | 1.523 | 219 | ||||||
| 2026-02-02 | 13F | JDM Financial Group LLC | 60 | 9 | ||||||
| 2026-02-05 | 13F | Cardinal Point Capital Management, ULC | 71.217 | 2,87 | 10.221 | 5,13 | ||||
| 2026-02-06 | 13F | McKinley Carter Wealth Services, Inc. | 42.885 | 2,07 | 6.155 | 4,31 | ||||
| 2026-02-03 | 13F | Morse Asset Management, Inc | 1.558 | 81,59 | 224 | 85,83 | ||||
| 2026-02-17 | 13F | Integrated Advisors Network LLC | 32.867 | 73,80 | 4.717 | 77,66 | ||||
| 2026-01-30 | 13F | Interchange Capital Partners, LLC | 11.631 | 1,72 | 1.669 | 3,99 | ||||
| 2025-09-26 | NP | BKLC - BNY Mellon US Large Cap Core Equity ETF | 93.959 | 26,43 | 12.959 | 28,62 | ||||
| 2025-09-25 | NP | QLV - FlexShares US Quality Low Volatility Index Fund | 17.015 | 50,84 | 2.347 | 53,43 | ||||
| 2026-01-16 | 13F | Red Lighthouse Investment Management, Llc | 0 | -100,00 | 0 | |||||
| 2026-02-17 | 13F | Fairview Capital Investment Management, Llc | 3.244 | -3,37 | 466 | -1,27 | ||||
| 2026-02-12 | 13F | Edgewood Management Llc | 20.886 | 0,00 | 2.998 | 2,18 | ||||
| 2026-01-26 | 13F | Phraction Management LLC | 13.713 | 1,93 | 1.968 | 4,18 | ||||
| 2026-01-23 | 13F | Monarch Capital Management Inc/ | 12.973 | 7,01 | 1.877 | 10,22 | ||||
| 2026-02-05 | 13F | Navalign, LLC | 1.541 | 0,00 | 221 | 2,31 | ||||
| 2026-01-12 | 13F | Ccm Investment Advisers Llc | 107.464 | -0,14 | 15.423 | 2,06 | ||||
| 2026-02-11 | 13F | Picton Mahoney Asset Management | 30.201 | 4,18 | 4.334 | 108.250,00 | ||||
| 2026-01-28 | 13F | Davis Capital Management | 33 | -50,00 | 5 | -55,56 | ||||
| 2026-02-05 | 13F | Amalgamated Bank | 257.911 | -3,25 | 37 | 0,00 | ||||
| 2026-02-04 | 13F | Virginia Retirement Systems Et Al | 272.816 | 0,00 | 39.155 | 2,19 | ||||
| 2025-11-14 | 13F | Centiva Capital, LP | 0 | -100,00 | 0 | -100,00 | ||||
| 2026-02-02 | 13F | Capital Management Corp /va | 0 | -100,00 | 0 | |||||
| 2026-02-13 | 13F | Ames National Corp | 3.025 | -4,57 | 434 | -2,47 | ||||
| 2026-02-17 | 13F | Berkshire Bank | 10.364 | -2,28 | 1.487 | -0,13 | ||||
| 2026-02-13 | 13F | Level Four Advisory Services, Llc | 30.558 | -4,02 | 4.386 | -1,92 | ||||
| 2026-01-14 | 13F | Kaufman Rossin Wealth, LLC | 3.171 | -12,04 | 455 | -10,08 | ||||
| 2026-02-09 | 13F | Morris Financial Concepts, Inc. | 2.709 | 0,00 | 389 | 2,11 | ||||
| 2026-01-23 | 13F | Cantor Fitzgerald Investment Adviser L.p. | 13.441 | -5,76 | 1.929 | -3,65 | ||||
| 2026-01-28 | 13F | Accretive Wealth Partners, LLC | 2.188 | 0,00 | 314 | 2,28 | ||||
| 2026-01-23 | 13F | FSM Wealth Advisors, LLC | 8.356 | -15,55 | 1.199 | -13,68 | ||||
| 2026-01-30 | 13F | Simplicity Wealth,LLC | 16.841 | -15,25 | 2.417 | -13,37 | ||||
| 2026-02-12 | 13F | SWAN Capital LLC | 101 | 24,69 | 15 | 27,27 | ||||
| 2026-01-16 | 13F | Tema Etfs Llc | 25.705 | -0,29 | 3.689 | 1,91 | ||||
| 2026-01-26 | 13F | Spectrum Asset Management, Inc. (NB/CA) | 2.153 | 0,00 | 312 | 3,31 | ||||
| 2026-01-28 | 13F | Hudson Value Partners, LLC | 4.820 | 0,00 | 694 | 2,66 | ||||
| 2025-09-29 | NP | QYLD - Global X NASDAQ 100 Covered Call ETF This fund is a listed as child fund of Mirae Asset Global Investments Co., Ltd. and if that institution has disclosed ownership in this security, then these positions will not be double counted when calculating total shares and total value | 660.196 | -20,49 | 91.054 | -19,12 | ||||
| 2026-02-10 | 13F | Fiduciary Family Office, Llc | 9.141 | -20,09 | 1.312 | -18,37 | ||||
| 2026-02-20 | 13F | Sunbelt Securities, Inc. | 18.006 | -1,60 | 2.584 | 0,58 | ||||
| 2026-01-09 | 13F | Affinity Capital Advisors, LLC | 1.712 | 7,67 | 246 | 8,41 | ||||
| 2026-01-14 | 13F | Centurion Wealth Management LLC | 2.145 | 3,08 | 308 | 5,14 | ||||
| 2026-01-26 | 13F | Intelligent Financial Strategies | 783 | 0,00 | 114 | 2,73 | ||||
| 2026-01-22 | 13F | Personal Cfo Solutions, Llc | 4.263 | 4,72 | 612 | 7,01 | ||||
| 2026-02-12 | 13F | Federated Hermes, Inc. | 2.663.179 | 2,12 | 382.219 | 4,36 | ||||
| 2026-02-12 | 13F | Rowland & Co Investment Counsel/adv | 2.215 | 9,93 | 318 | 12,41 | ||||
| 2026-01-27 | 13F | TD Waterhouse Canada Inc. | 91.229 | -2,15 | 13.090 | -0,16 | ||||
| 2026-01-09 | 13F | Community Trust & Investment Co | 4.312 | -6,91 | 619 | -4,92 | ||||
| 2026-01-20 | 13F | Ethos Financial Group, LLC | 2.956 | 53,24 | 429 | 58,89 | ||||
| 2026-01-28 | 13F | Turtle Creek Wealth Advisors, LLC | 34.532 | 11,00 | 4.956 | 13,41 | ||||
| 2026-01-29 | 13F | LCM Capital Management Inc | 7.265 | -6,29 | 1.043 | -4,23 | ||||
| 2026-02-17 | 13F | Man Group plc | Put | 43.600 | -57,92 | 6.257 | -56,99 | |||
| 2026-01-21 | 13F | Asio Capital, LLC | 6.402 | -4,15 | 919 | -2,03 | ||||
| 2026-02-17 | 13F | Man Group plc | Call | 43.200 | -42,63 | 6.200 | -41,37 | |||
| 2025-10-14 | 13F | Livelsberger Financial Advisory | 0 | -100,00 | 0 | -100,00 | ||||
| 2026-02-13 | 13F | Neuberger Berman Group LLC | 938.544 | 4,28 | 134.700 | 6,56 | ||||
| 2026-02-04 | 13F | LRI Investments, LLC | 9.296 | -0,97 | 1.334 | 1,21 | ||||
| 2026-02-17 | 13F | Man Group plc | 773.958 | -18,96 | 111.078 | -17,19 | ||||
| 2025-09-26 | NP | BINT - Bluemonte Global Equity ETF | 9 | 1 | ||||||
| 2026-01-12 | 13F | Moody National Bank Trust Division | 15.434 | -21,09 | 2.215 | -19,37 | ||||
| 2026-02-11 | 13F | Lyell Wealth Management, Lp | 7.846 | -5,58 | 1.126 | -3,51 | ||||
| 2026-02-09 | 13F | Fidelis Capital Partners, LLC | 18.443 | 12,75 | 2.647 | 15,19 | ||||
| 2026-02-12 | 13F | Penserra Capital Management LLC | 117 | -4,88 | 0 | |||||
| 2026-02-02 | 13F | Addison Capital Co | 29.939 | -8,03 | 4.297 | -6,02 | ||||
| 2026-02-06 | 13F | Planning Alternatives Ltd /adv | 1.431 | -17,71 | 205 | -15,98 | ||||
| 2026-02-05 | 13F | May Hill Capital, LLC | 3.982 | 69,74 | 572 | 73,56 | ||||
| 2026-01-29 | 13F | Teachers Retirement System Of The State Of Kentucky | 107.592 | 0,00 | 15 | 0,00 | ||||
| 2025-11-13 | 13F | Total Investment Management Inc | 0 | -100,00 | 0 | -100,00 | ||||
| 2026-02-11 | 13F | Boyer & Corporon Wealth Management, LLC | 37.736 | 5.416 | ||||||
| 2026-02-11 | 13F | Real Talk Capital, LLC | 2.326 | -1,11 | 334 | 0,91 | ||||
| 2026-02-17 | 13F | Prosperity Consulting Group, LLC | 14.318 | -10,50 | 2.055 | -8,55 | ||||
| 2026-01-09 | 13F | Aull & Monroe Investment Management Corp | 14.838 | -0,24 | 2.130 | 1,96 | ||||
| 2026-02-17 | 13F | Kemnay Advisory Services Inc. | 544 | 78 | ||||||
| 2026-02-13 | 13F | RFP Financial Group LLC | 5.384 | -16,23 | 773 | -14,60 | ||||
| 2026-02-17 | 13F | Marin Bay Wealth Advisors, LLC | 4.133 | 593 | ||||||
| 2026-02-17 | 13F | Boreal Capital Management LLC | 515 | 0,00 | 75 | 2,78 | ||||
| 2026-02-02 | 13F | Cerro Pacific Wealth Advisors LLC | 10.712 | -3,23 | 1.537 | -1,09 | ||||
| 2026-02-03 | 13F | Alpha Cubed Investments, LLC | 3.808 | 6,46 | 546 | 8,76 | ||||
| 2026-02-12 | 13F | Westchester Capital Management, Inc. | 13.312 | 15,14 | 1.911 | 17,68 | ||||
| 2026-02-06 | 13F | Texas Bank & Trust Co | 7.494 | 0,00 | 1.076 | 2,19 | ||||
| 2026-02-06 | 13F | First Business Financial Services, Inc. | 3.809 | -24,45 | 547 | -22,88 | ||||
| 2026-02-23 | 13F | Mv Capital Management, Inc. | 2.333 | 18,31 | 335 | 28,46 | ||||
| 2025-11-13 | 13F | Banco de Sabadell, S.A | 0 | -100,00 | 0 | |||||
| 2026-01-15 | 13F | Cherry Creek Investment Advisors, Inc. | 2.777 | -17,01 | 399 | -15,14 | ||||
| 2026-02-11 | 13F | Orion Investment Co | 0 | -100,00 | 0 | |||||
| 2026-02-17 | 13F | Credit Agricole S A | Put | 25.000 | 0,00 | 3.588 | 2,19 | |||
| 2026-02-17 | 13F | Credit Agricole S A | 988.988 | 76,18 | 141.940 | 80,04 | ||||
| 2026-01-30 | 13F | Chapin Davis, Inc. | 18.975 | -2,88 | 2.723 | -0,73 | ||||
| 2025-11-17 | 13F | LGT Financial Advisors LLC | 0 | -100,00 | 0 | |||||
| 2026-02-13 | 13F | Smartleaf Asset Management LLC | 19.120 | 17,26 | 2.756 | 20,61 | ||||
| 2025-09-24 | NP | IYK - iShares U.S. Consumer Goods ETF | 795.001 | -4,49 | 109.647 | -2,84 | ||||
| 2026-01-27 | 13F | Friedenthal Financial | 5 | 0,00 | 1 | |||||
| 2026-02-17 | 13F | Harvest Investment Services, LLC | 1.540 | -29,45 | 221 | -27,78 | ||||
| 2026-01-30 | 13F | Bell & Brown Wealth Advisors, Llc | 20.922 | 3,40 | 3.003 | 5,67 | ||||
| 2026-02-12 | 13F | Colonial Trust Advisors | 74.283 | -9,04 | 10.661 | -7,05 | ||||
| 2026-01-12 | 13F | Byrne Asset Management LLC | 1.023 | -1,45 | 147 | 0,69 | ||||
| 2026-01-28 | 13F | Columbia Asset Management | 30.584 | 2,62 | 4.389 | 4,87 | ||||
| 2026-01-21 | 13F | South Shore Capital Advisors | 3.196 | 126,83 | 459 | 99,13 | ||||
| 2026-02-11 | 13F | Arsenal Capital Advisors LLC | 1.939 | 281 | ||||||
| 2026-02-17 | 13F/A | Vance Wealth, Inc. | 1.746 | 2,59 | 253 | 5,86 | ||||
| 2026-01-05 | 13F | Jacobs & Co/ca | 91.627 | -3,25 | 13 | 0,00 | ||||
| 2026-02-10 | 13F | CFS Investment Advisory Services, LLC | 15.566 | -10,54 | 2.234 | -15,25 | ||||
| 2025-12-15 | 13F/A | Hudson Bay Capital Management LP | Call | 0 | -100,00 | 0 | -100,00 | |||
| 2025-12-15 | 13F/A | Hudson Bay Capital Management LP | Put | 0 | -100,00 | 0 | -100,00 | |||
| 2026-01-09 | 13F | Cambridge Financial Group, LLC | 5.296 | 70,40 | 786 | 80,28 | ||||
| 2026-01-16 | 13F | Crewe Advisors LLC | 1.919 | 2,57 | 275 | 4,96 | ||||
| 2026-02-05 | 13F | Center for Financial Planning, Inc. | 13.329 | -0,74 | 1.913 | 1,43 | ||||
| 2026-01-29 | 13F | Comerica Bank | 463.242 | -4,08 | 66.484 | -1,98 | ||||
| 2026-02-02 | 13F | PKS Advisory Services, LLC | 1.634 | -1,98 | 234 | 0,00 | ||||
| 2026-02-06 | 13F | Vestmark Advisory Solutions, Inc. | 35.368 | 185,00 | 5.076 | 191,33 | ||||
| 2026-02-17 | 13F | Hurlow Wealth Management Group, Inc. | 2.303 | -8,86 | 331 | -6,78 | ||||
| 2026-01-26 | 13F | Xcel Wealth Management, LLC | 3.039 | 4,79 | 436 | 7,13 | ||||
| 2026-02-13 | 13F | Bridgewater Associates, LP | 83.974 | 0,95 | 12.052 | 3,17 | ||||
| 2026-02-17 | 13F | Css Llc/il | 10.419 | 105,50 | 1.495 | 109,97 | ||||
| 2026-01-21 | 13F | McElhenny Sheffield Capital Management, LLC | 5.487 | -35,29 | 788 | -33,87 | ||||
| 2026-01-08 | 13F | Old Port Advisors | 5.956 | -2,41 | 855 | -0,35 | ||||
| 2026-01-22 | 13F | Carlton Hofferkamp & Jenks Wealth Management, LLC | 10.306 | -0,35 | 1.479 | -6,27 | ||||
| 2026-01-28 | 13F | Fiduciary Wealth Partners, LLC | 2.708 | -1,17 | 389 | 1,04 | ||||
| 2026-02-02 | 13F | Danske Bank A/s | 1.002.818 | 8,19 | 143.924 | 10,56 | ||||
| 2025-11-07 | 13F | Sierra Ocean, Llc | 0 | -100,00 | 0 | -100,00 | ||||
| 2025-11-14 | 13F | EFG Asset Management (Americas) Corp. | 27.911 | 12,24 | 3.920 | 19,37 | ||||
| 2026-01-23 | 13F | Farther Finance Advisors, LLC | 66.893 | 52,32 | 9.600 | 55,67 | ||||
| 2026-02-05 | 13F | Avantax Planning Partners, Inc. | 62.583 | 11,22 | 8.982 | 13,65 | ||||
| 2026-02-13 | 13F | Tradewinds, LLC. | 10.815 | -4,05 | 1.552 | -1,96 | ||||
| 2026-01-22 | 13F | Cardinal Capital Management, Inc. | 0 | -100,00 | 0 | |||||
| 2026-02-12 | 13F | Logan Capital Management Inc | 95.170 | -2,10 | 13.659 | 0,04 | ||||
| 2025-09-26 | NP | PBAIX - Blackrock Tactical Opportunities Fund Institutional This fund is a listed as child fund of BlackRock, Inc. and if that institution has disclosed ownership in this security, then these positions will not be double counted when calculating total shares and total value | 30.650 | -2,74 | 4.227 | -1,05 | ||||
| 2026-01-28 | 13F | Oversea-Chinese Banking CORP Ltd | 4.576 | 12,93 | 657 | 15,29 | ||||
| 2025-10-16 | 13F | Kingstone Capital Partners Texas, LLC | 0 | -100,00 | 0 | -100,00 | ||||
| 2026-02-04 | 13F | Advisor OS, LLC | 9.807 | 7,12 | 1.407 | 9,49 | ||||
| 2026-02-13 | 13F | Ausdal Financial Partners, Inc. | 16.797 | -1,83 | 2.411 | 0,33 | ||||
| 2026-02-17 | 13F | Fullerton Fund Management Co Ltd | 0 | -100,00 | 0 | |||||
| 2026-02-13 | 13F | Sei Investments Co | 708.087 | 30,16 | 101.625 | 33,02 | ||||
| 2026-01-22 | 13F | Lee Financial Co | 0 | -100,00 | 0 | |||||
| 2026-01-08 | 13F | Profit Investment Management, LLC | 2.011 | -12,57 | 289 | -10,84 | ||||
| 2025-10-14 | 13F | Flywheel Private Wealth LLC | 0 | -100,00 | 0 | |||||
| 2025-10-24 | 13F | Hemington Wealth Management | 1.373 | 75,58 | 0 | |||||
| 2026-01-28 | 13F | Grant Street Asset Management, Inc. | 1.448 | -6,46 | 208 | -4,61 | ||||
| 2025-09-26 | NP | FHOFX - Fidelity Series Large Cap Growth Index Fund This fund is a listed as child fund of Fmr Llc and if that institution has disclosed ownership in this security, then these positions will not be double counted when calculating total shares and total value | 12.669 | -82,49 | 1.747 | -82,19 | ||||
| 2026-01-27 | 13F | Meritage Portfolio Management | 6.621 | 0,00 | 950 | 2,26 | ||||
| 2026-01-28 | 13F | Nicholson Meyer Capital Management, Inc. | 1.736 | -4,41 | 249 | -2,35 | ||||
| 2025-11-14 | 13F | ExodusPoint Capital Management, LP | 164.196 | 23.060 | ||||||
| 2026-02-17 | 13F | Aristotle Capital Management, LLC | 24.466 | 0,00 | 3.511 | 2,18 | ||||
| 2026-02-05 | 13F | AlphaCore Capital LLC | 28.182 | 57,65 | 4.083 | 62,67 | ||||
| 2026-02-09 | 13F | Hutchinson Capital Management/ca | 2.907 | 0,17 | 417 | 2,46 | ||||
| 2026-02-19 | 13F | WealthPoint Financial, LLC | 1.665 | 239 | ||||||
| 2026-02-14 | 13F | American Trust | 26.550 | -0,33 | 3.810 | 1,84 | ||||
| 2026-01-29 | 13F | IMC-Chicago, LLC | 89.418 | 12.833 | ||||||
| 2026-01-29 | 13F | IMC-Chicago, LLC | Put | 1.171.800 | 11,32 | 168.177 | 13,77 | |||
| 2026-01-29 | 13F | IMC-Chicago, LLC | Call | 1.120.800 | 8,23 | 160.857 | 10,60 | |||
| 2026-02-13 | 13F | Kcm Investment Advisors Llc | 14.219 | -4,60 | 2.041 | -2,53 | ||||
| 2026-02-17 | 13F | Palisade Capital Management Llc/nj | 1.666 | 239 | ||||||
| 2026-01-23 | 13F | Parthenon Llc | 100.965 | -0,67 | 14.490 | 1,51 | ||||
| 2026-02-27 | 13F | Strategic Investment Solutions, Inc. /IL | 720 | 2,71 | 103 | 5,10 | ||||
| 2026-02-13 | 13F | Missouri Trust & Investment Co | 10.681 | 13,21 | 1.533 | 15,62 | ||||
| 2026-01-23 | 13F | Gibbs Wealth Management | 10.556 | -14,36 | 1.477 | -14,73 | ||||
| 2026-02-05 | 13F | Atlas Wealth LLC | 4.251 | -0,35 | 610 | 1,84 | ||||
| 2026-02-13 | 13F | Chevy Chase Trust Holdings, Inc. | 826.284 | -1,07 | 118.588 | 1,10 | ||||
| 2026-01-09 | 13F | S.E.E.D. Planning Group LLC | 25.789 | 2,88 | 3.701 | 5,14 | ||||
| 2025-09-17 | NP | GTCEX - Strategic Equity Portfolio | 13.437 | -11,88 | 1.853 | -10,35 | ||||
| 2026-01-22 | 13F | Franklin, Parlapiano, Turner & Welch, LLC | 52.038 | 1,42 | 7.614 | 5,68 | ||||
| 2026-02-06 | 13F | Resona Asset Management Co.,Ltd. | 518.548 | -3,63 | 74.487 | -1,40 | ||||
| 2026-01-15 | 13F | Elser Financial Planning, Inc | 3.470 | -0,03 | 498 | 1,01 | ||||
| 2026-01-28 | 13F | North Point Portfolio Managers Corp/oh | 68.351 | -0,65 | 9.810 | 1,53 | ||||
| 2026-01-14 | 13F | Centennial Wealth Advisory LLC | 1.699 | 244 | ||||||
| 2026-01-12 | 13F | VisionPoint Advisory Group, LLC | 2.793 | -8,46 | 401 | -6,54 | ||||
| 2026-02-04 | 13F | Tsfg, Llc | 2.492 | -2,47 | 0 | |||||
| 2025-10-22 | 13F | Stanley-Laman Group, Ltd. | 0 | -100,00 | 0 | |||||
| 2026-01-15 | 13F | Moody Lynn & Lieberson, Llc | 82.583 | 25,21 | 11.852 | 27,96 | ||||
| 2026-02-10 | 13F | Greenwich Wealth Management LLC | 4.120 | 0,00 | 1 | |||||
| 2026-01-28 | 13F | Cortland Associates Inc/mo | 1.640 | 0,00 | 235 | 2,17 | ||||
| 2026-01-23 | 13F | High Net Worth Advisory Group LLC | 26.333 | -2,39 | 3.779 | -0,24 | ||||
| 2026-01-16 | 13F | Keystone Financial Group, Inc. | 453 | 0,00 | 66 | 3,17 | ||||
| 2026-02-13 | 13F | Dynamic Technology Lab Private Ltd | 14.890 | 2.137 | ||||||
| 2026-01-09 | 13F | Montecito Bank & Trust | 9.902 | -0,85 | 1.421 | 1,36 | ||||
| 2026-02-11 | 13F | Peachtree Investment Partners, LLC | 2.773 | -9,05 | 398 | -7,24 | ||||
| 2026-01-15 | 13F | Westend Capital Management LLC | 574 | 293,15 | 82 | 310,00 | ||||
| 2025-09-24 | NP | TWBIX - Balanced Fund Investor Class This fund is a listed as child fund of American Century Companies Inc and if that institution has disclosed ownership in this security, then these positions will not be double counted when calculating total shares and total value | 27.921 | -10,33 | 3.851 | -8,79 | ||||
| 2025-09-25 | NP | BBUS - JPMorgan BetaBuilders U.S. Equity ETF | 128.910 | 8,07 | 17.779 | 9,94 | ||||
| 2026-02-13 | 13F | Palisade Asset Management, LLC | 114.493 | 4,57 | 16.432 | 6,87 | ||||
| 2026-02-11 | 13F | CenterBook Partners LP | 13.763 | 1.975 | ||||||
| 2026-01-14 | 13F | Woodstock Corp | 87.254 | 0,36 | 12.523 | 2,56 | ||||
| 2026-01-21 | 13F | Crux Wealth Advisors | 3.182 | -1,58 | 457 | 0,44 | ||||
| 2026-02-03 | 13F | D.B. Root & Company, LLC | 4.513 | 1,83 | 648 | 4,02 | ||||
| 2026-01-28 | 13F | Chicago Partners Investment Group LLC | 22.289 | -1,56 | 3.223 | -5,21 | ||||
| 2026-02-12 | 13F | Fortress Private Ledger, Llc | 1.660 | -6,79 | 238 | -4,80 | ||||
| 2025-09-26 | NP | RGEAX - Global Equity Fund Class A | 45.098 | 13,26 | 6.220 | 15,21 | ||||
| 2026-01-14 | 13F | Jfs Wealth Advisors, Llc | 17.002 | 0,82 | 2.441 | 3,08 | ||||
| 2026-02-05 | 13F | North Dakota State Investment Board | 46.997 | 6.745 | ||||||
| 2025-10-24 | 13F | Seamount Financial Group Inc | 0 | -100,00 | 0 | |||||
| 2026-02-17 | 13F | Equitable Holdings, Inc. | 35.762 | -5,45 | 5.133 | -3,37 | ||||
| 2026-01-06 | 13F | Armstrong Henry H Associates Inc | 16.190 | -5,36 | 2.324 | -3,29 | ||||
| 2026-01-23 | 13F | Evolution Advisers, Inc. | 526 | 0,00 | 0 | |||||
| 2025-11-13 | 13F | Banque Transatlantique SA | 0 | -100,00 | 0 | -100,00 | ||||
| 2026-01-08 | 13F | Pine Haven Investment Counsel, Inc | 9.901 | -0,05 | 1.421 | 2,08 | ||||
| 2026-02-10 | 13F | Bowen Hanes & Co Inc | 25.523 | -8,82 | 4 | -99,92 | ||||
| 2026-02-11 | 13F | X-Square Capital, LLC | 12.150 | -4,09 | 2 | 0,00 | ||||
| 2026-01-05 | 13F | Coastline Trust Co | 19.506 | -0,32 | 2.800 | 1,86 | ||||
| 2026-02-17 | 13F | Raffles Associates Lp | 0 | -100,00 | 0 | |||||
| 2026-01-26 | 13F | SMART Wealth LLC | 1.489 | 214 | ||||||
| 2026-01-23 | 13F | Clear Creek Financial Management, LLC | 9.658 | 17,01 | 1.387 | 19,59 | ||||
| 2026-01-21 | 13F | Stock Yards Bank & Trust Co | 96.764 | -0,46 | 13.888 | 1,72 | ||||
| 2026-02-12 | 13F | Granite Investment Partners, LLC | 43.959 | -0,87 | 6.309 | 1,30 | ||||
| 2026-02-13 | 13F | Journey Strategic Wealth Llc | 219.905 | 0,14 | 31.561 | 2,34 | ||||
| 2025-09-29 | NP | QQWZ - Pacer Cash COWZ 100-Nasdaq 100 Rotator ETF | 723 | 100 | ||||||
| 2026-02-18 | 13F | Garton & Associates Financial Advisors LLC | 13.195 | 1.894 | ||||||
| 2026-01-15 | 13F | Allspring Global Investments Holdings, LLC | 161.938 | -0,56 | 23.032 | -1,19 | ||||
| 2026-01-15 | 13F | Hengehold Capital Management Llc | 23.712 | -4,34 | 3.403 | -2,24 | ||||
| 2026-02-02 | 13F | Alliance Wealth Advisors, LLC /UT | 6.627 | -20,67 | 951 | -18,93 | ||||
| 2025-09-26 | NP | SPHQ - Invesco S&P 500 Quality ETF This fund is a listed as child fund of Invesco Ltd. and if that institution has disclosed ownership in this security, then these positions will not be double counted when calculating total shares and total value | 2.215.338 | 32,57 | 305.539 | 34,86 | ||||
| 2026-02-17 | 13F | SummitTX Capital, L.P. | 0 | -100,00 | 0 | |||||
| 2026-02-09 | 13F | Old Republic International Corp | 455.950 | 0,00 | 65 | 1,56 | ||||
| 2026-02-06 | 13F | BOK Financial Private Wealth, Inc. | 13.933 | 0,51 | 2.019 | 3,75 | ||||
| 2026-02-06 | 13F | Ironwood Investment Counsel, LLC | 44.765 | 0,92 | 6.425 | 3,13 | ||||
| 2025-09-25 | NP | MFWTX - MFS Global Total Return Fund A | 12.424 | -1,23 | 1.714 | 0,47 | ||||
| 2026-02-06 | 13F | Kingdom Financial Group LLC. | 373 | 54 | ||||||
| 2026-02-17 | 13F | Cresset Asset Management, LLC | Put | 500 | 0,00 | 72 | 1,43 | |||
| 2026-02-17 | 13F | Cresset Asset Management, LLC | 296.369 | -6,64 | 42.900 | -3,77 | ||||
| 2026-01-29 | 13F | BKM Wealth Management, LLC | 8.369 | -21,11 | 1.201 | -19,34 | ||||
| 2026-01-07 | 13F | Corsicana & Co. | 6.280 | -2,64 | 901 | -0,44 | ||||
| 2026-02-12 | 13F | Wedbush Securities Inc | 50.041 | 17,41 | 7 | 40,00 | ||||
| 2026-02-12 | 13F | Great Lakes Advisors, Llc | 832.357 | 33,90 | 119.460 | 36,84 | ||||
| 2026-01-20 | 13F | Meridian Investment Counsel Inc. | 3.762 | -12,76 | 540 | -10,91 | ||||
| 2025-11-24 | 13F/A | Fulcrum Asset Management LLP | Put | 0 | -100,00 | 0 | -100,00 | |||
| 2026-01-29 | 13F/A | Stockman Wealth Management, Inc. | 89.294 | -1,17 | 12.815 | 1,00 | ||||
| 2026-02-13 | 13F | First National Bank Of Omaha | 159.735 | 15,31 | 22.939 | 17,91 | ||||
| 2026-02-05 | 13F | Sequent Planning LLC | 21.750 | 0,00 | 3.122 | 2,19 | ||||
| 2026-02-13 | 13F | Clarity Asset Management, Inc. | 237 | 0,00 | 34 | 3,03 | ||||
| 2026-02-04 | 13F | Pensionmark Financial Group, Llc | 55.460 | 14,04 | 6.907 | 1,14 | ||||
| 2025-11-14 | 13F | CI Private Wealth, LLC | Call | 0 | -100,00 | 0 | ||||
| 2026-02-12 | 13F | Front Row Advisors LLC | 389 | 0,00 | 56 | 3,70 | ||||
| 2026-01-07 | 13F | Everpar Advisors Llc | 4.763 | 26,04 | 684 | 28,87 | ||||
| 2026-02-09 | 13F | Kuhn & Co Investment Counsel | 6.638 | 14,29 | 953 | 16,81 | ||||
| 2026-02-13 | 13F | Sargent Investment Group, LLC | 12.065 | 12,95 | 1.732 | 15,40 | ||||
| 2026-01-26 | 13F | Code Waechter LLC | 3.453 | 18,09 | 496 | 11,74 | ||||
| 2026-02-12 | 13F | Sit Investment Associates Inc | 0 | -100,00 | 0 | |||||
| 2026-02-24 | 13F | Astoria Portfolio Advisors LLC. | 3.243 | 91,78 | 546 | 132,91 | ||||
| 2026-01-27 | 13F | Focused Investors LLC | 1.100.750 | 54,03 | 157.980 | 57,40 | ||||
| 2026-02-04 | 13F | Northeast Investment Management | 60.939 | -5,19 | 8.746 | -3,12 | ||||
| 2026-02-13 | 13F | University Of Texas/texas Am Investment Managment Co | 775 | 111 | ||||||
| 2026-02-13 | 13F | Alliance Private Wealth, LLC | 9.124 | 1.486 | ||||||
| 2026-02-13 | 13F | Rhumbline Advisers | 2.538.130 | -1,31 | 364.272 | 0,86 | ||||
| 2026-01-22 | 13F | WELLCOME TRUST LTD (THE) as trustee of the WELLCOME TRUST | 2.000.000 | 0,00 | 287.040 | 2,19 | ||||
| 2026-02-05 | 13F | LGT Fund Management Co Ltd. | 42.378 | 6,27 | 6.109 | 7,03 | ||||
| 2026-02-10 | 13F | Camden National Bank | 60.093 | 0,46 | 8.625 | 2,65 | ||||
| 2026-02-11 | 13F | Atlanta Consulting Group Advisors, LLC | 3.539 | 7,21 | 513 | 10,58 | ||||
| 2026-01-27 | 13F | Stone Point Wealth LLC | 24.187 | -1,01 | 3.471 | 1,17 | ||||
| 2026-02-13 | 13F | Transamerica Financial Advisors, Inc. | 7.157 | 1.028 | ||||||
| 2026-01-22 | 13F | Bfsg, Llc | 11.529 | -6,02 | 1.655 | -3,95 | ||||
| 2026-02-11 | 13F | Francis Financial, Inc. | 0 | -100,00 | 0 | |||||
| 2026-02-17 | 13F | Asset Management Group, Inc. | 34.750 | -9,62 | 4.987 | -7,63 | ||||
| 2025-09-29 | NP | BDIV - AAM BRENTVIEW DIVIDEND GROWTH ETF | 425 | -15,00 | 59 | -13,43 | ||||
| 2026-02-10 | 13F | National Pension Service | 3.143.939 | 2,51 | 451.218 | 4,76 | ||||
| 2026-02-17 | 13F | Fairscale Capital, LLC | 865 | 0,00 | 125 | 3,31 | ||||
| 2025-11-14 | 13F | Private Capital Management, LLC | Put | 0 | -100,00 | 0 | -100,00 | |||
| 2026-01-21 | 13F | Woodmont Investment Counsel Llc | 27.309 | -2,36 | 3.919 | -0,23 | ||||
| 2025-09-29 | NP | MPGVX - Mondrian Global Equity Value Fund | 39.498 | 160,27 | 5.448 | 122,15 | ||||
| 2026-02-11 | 13F | GW&K Investment Management, LLC | 2.202 | 0 | ||||||
| 2026-02-04 | 13F | Bridgewealth Advisory Group, LLC | 5.025 | 2,87 | 721 | 5,10 | ||||
| 2026-02-13 | 13F | BNB Wealth Management, LLC | 3.222 | 462 | ||||||
| 2026-02-13 | 13F | 1832 Asset Management L.P. | 1.296.354 | 4.172,19 | 186.053 | 4.266,39 | ||||
| 2026-02-12 | 13F | Paradigm Capital Management Inc/ny | 1.500 | 0,00 | 215 | 2,38 | ||||
| 2026-02-02 | 13F | Eq Wealth Advisors, Llc | 834 | 120 | ||||||
| 2026-01-20 | 13F | Pine Harbor Wealth Management, LLC | 1.797 | 0,00 | 258 | 1,98 | ||||
| 2026-01-27 | 13F | PFG Advisors | 7.513 | -25,41 | 1.078 | -23,76 | ||||
| 2026-02-13 | 13F | Alvarez & Marsal Private Wealth Partners, LLC | 1.386 | 201 | ||||||
| 2026-01-09 | 13F | Atlas Brown,Inc. | 24.023 | 0,46 | 3.448 | 2,65 | ||||
| 2026-02-10 | 13F | Texas Yale Capital Corp. | 19.950 | 3,23 | 2.863 | 5,49 | ||||
| 2025-11-14 | 13F | AXA Investment Managers S.A. | 620.592 | 87.156 | ||||||
| 2026-01-23 | 13F | Founders Capital Management, Llc | 83.879 | 0,34 | 12.038 | 2,54 | ||||
| 2026-02-13 | 13F | Independent Family Office, LLC | 0 | -100,00 | 0 | |||||
| 2026-02-13 | 13F | Truvestments Capital Llc | 7.936 | -1,43 | 1.139 | 0,71 | ||||
| 2026-02-12 | 13F | First International Bank of Israel Ltd. | 29.598 | 4.248 | ||||||
| 2026-02-03 | 13F | Falcon Wealth Planning | 5.409 | 17,28 | 776 | 19,94 | ||||
| 2026-02-10 | 13F | Kentucky Retirement Systems Insurance Trust Fund | 36.063 | 0,00 | 5.176 | 2,19 | ||||
| 2026-02-10 | 13F | Marietta Investment Partners Llc | 25.200 | -4,91 | 3.617 | -2,82 | ||||
| 2026-02-17 | 13F | Spears Abacus Advisors LLC | 130.418 | -2,24 | 18.718 | -0,10 | ||||
| 2026-01-28 | 13F | Atwood & Palmer Inc | 13.586 | 0,00 | 1.950 | 2,15 | ||||
| 2026-01-22 | 13F | Cache Advisors, LLC | 1.851 | 27,74 | 266 | 30,54 | ||||
| 2026-02-12 | 13F | Pettinga Financial Advisors, LLC | 1.880 | 3,75 | 270 | 5,91 | ||||
| 2026-02-05 | 13F | S&co Inc | 82.282 | -1,30 | 12 | 0,00 | ||||
| 2026-02-12 | 13F | Alps Advisors Inc | 34.011 | -0,48 | 4.881 | 1,71 | ||||
| 2025-11-13 | 13F | Pathstone Holdings, LLC | Call | 0 | -100,00 | 0 | ||||
| 2026-01-13 | 13F | Well Done, LLC | 4.297 | 3,94 | 617 | 6,21 | ||||
| 2026-02-09 | 13F | HS Management Partners, LLC | 56.473 | -69,67 | 8.105 | -69,01 | ||||
| 2025-09-26 | NP | WWLAX - Westwood Quality Value Fund A Class Shares | 13.215 | 0,00 | 1.823 | 1,73 | ||||
| 2025-09-26 | NP | OWTEX - Old Westbury Total Equity Fund | 2.964 | 12,02 | 409 | 13,97 | ||||
| 2026-01-09 | 13F | McCollum Christoferson Group LLC | 11.503 | -2,99 | 1.651 | -0,90 | ||||
| 2026-02-10 | 13F | Lcnb Corp | 10.411 | 0,97 | 1.494 | 3,18 | ||||
| 2026-02-13 | 13F | QTR Family Wealth, LLC | 2.382 | -38,73 | 398 | -27,29 | ||||
| 2026-02-12 | 13F | Schneider Downs Wealth Management Advisors, LP | 2.701 | 14,11 | 388 | 16,57 | ||||
| 2026-01-06 | 13F | Sage Capital Advisors,llc | 62.913 | -0,39 | 9.029 | 1,79 | ||||
| 2026-01-27 | 13F | HCR Wealth Advisors | 2.220 | 0,91 | 319 | 1,60 | ||||
| 2026-01-16 | 13F | Ledgewood Wealth Advisors, LLC | 2.035 | 0,00 | 292 | 2,46 | ||||
| 2026-02-02 | 13F | Dudley Capital Management, Llc | 8.969 | 0,00 | 1.287 | 2,22 | ||||
| 2026-02-10 | 13F/A | Guinness Atkinson Asset Management Inc | 7.580 | -2,12 | 1.093 | 0,74 | ||||
| 2026-02-03 | 13F | Capital City Trust Co/fl | 2.708 | -3,56 | 389 | -1,52 | ||||
| 2026-01-12 | 13F | Burns J W & Co Inc/ny | 56.170 | -2,34 | 8.061 | -0,20 | ||||
| 2026-01-30 | 13F | Arlington Trust Co LLC | 565 | -83,11 | 81 | -82,73 | ||||
| 2026-01-07 | 13F | Crescent Sterling, Ltd. | 15.445 | -0,06 | 2.217 | 2,12 | ||||
| 2026-01-21 | 13F | Petra Financial Advisors Inc | 2.410 | -0,50 | 346 | 1,47 | ||||
| 2026-02-05 | 13F | BlueChip Wealth Advisors LLC | 2.336 | 1,08 | 335 | 3,40 | ||||
| 2026-02-13 | 13F | Solstein Capital, LLC | 2.688 | 0,00 | 386 | 2,12 | ||||
| 2026-02-17 | 13F | Algert Global Llc | 2.350 | 0 | ||||||
| 2026-02-05 | 13F | HighMark Wealth Management LLC | 1.015 | 0,00 | 146 | 2,11 | ||||
| 2026-02-13 | 13F | Evelyn Partners Investment Management LLP | 42.942 | -34,61 | 6.163 | -33,17 | ||||
| 2026-01-07 | 13F | KFA Private Wealth Group, LLC | 2.977 | 0,71 | 427 | 2,89 | ||||
| 2025-12-15 | 13F | Farmers National Bank | 15.101 | -2,13 | 2.121 | 4,07 | ||||
| 2026-02-12 | 13F | Swiss Re Ltd | 194 | 28 | ||||||
| 2026-02-09 | 13F | Troy Asset Management Ltd | 252.920 | -1,10 | 36.299 | 1,07 | ||||
| 2026-02-13 | 13F | DLD Asset Management, LP | Put | 8.000 | -46,67 | 1.148 | -45,46 | |||
| 2026-01-02 | 13F | Global Wealth Strategies & Associates | 654 | 46,31 | 94 | 50,00 | ||||
| 2026-01-08 | 13F | Versant Capital Management, Inc | 5.635 | 0,77 | 809 | 2,93 | ||||
| 2026-02-04 | 13F | Global Wealth Management Investment Advisory, Inc. | 28.825 | 30,47 | 4.137 | 33,33 | ||||
| 2025-09-24 | NP | TNRAX - 1290 Avantis U.S. Large Cap Growth Fund Class A | 4.776 | 0,00 | 659 | 1,70 | ||||
| 2026-01-26 | 13F | MOKAN Wealth Management Inc. | 13.419 | -7,46 | 1.927 | -5,40 | ||||
| 2026-02-09 | 13F | Life Cycle Investment Partners Ltd | 496.374 | 71.240 | ||||||
| 2026-02-11 | 13F | Dorsey & Whitney Trust CO LLC | 25.217 | -0,28 | 3.619 | 1,91 | ||||
| 2025-09-26 | NP | BFRE - Westwood LBRTY Global Equity ETF | 329 | 40,00 | 45 | 45,16 | ||||
| 2026-02-09 | 13F | Texas Capital Bank Wealth Management Services Inc | 12.146 | 38,01 | 1.743 | 41,02 | ||||
| 2026-01-15 | 13F | McGlone Suttner Wealth Management, Inc. | 7.443 | -5,37 | 1.068 | -3,26 | ||||
| 2025-11-14 | 13F | Wolverine Trading, Llc | 42.849 | 69,98 | 6.006 | 81,83 | ||||
| 2025-11-14 | 13F | Wolverine Trading, Llc | Call | 491.800 | -18,12 | 68.936 | -12,41 | |||
| 2026-02-02 | 13F | Millstone Evans Group, LLC | 5.084 | -5,15 | 730 | -3,06 | ||||
| 2026-02-12 | 13F | Gerber Kawasaki Wealth & Investment Management | 3.054 | -11,63 | 438 | -9,69 | ||||
| 2025-11-14 | 13F | Wolverine Trading, Llc | Put | 547.300 | 98,80 | 76.715 | 112,65 | |||
| 2026-01-12 | 13F | Bill Few Associates, Inc. | 28.035 | 2,17 | 4.024 | 4,41 | ||||
| 2026-01-14 | 13F | Smith Thornton Advisors LLC | 3.238 | -0,12 | 465 | 1,98 | ||||
| 2026-01-21 | 13F | Mezzasalma Advisors, LLC | 1.771 | -10,06 | 252 | -8,70 | ||||
| 2026-02-06 | 13F | Midwest Financial Partners Investments, Inc. | 2.227 | 320 | ||||||
| 2026-02-17 | 13F | DZ BANK AG Deutsche Zentral Genossenschafts Bank, Frankfurt am Main | 2.738.653 | 579,60 | 393.053 | 594,54 | ||||
| 2026-02-13 | 13F | PYA Waltman Capital, LLC | 13.722 | 5,98 | 1.969 | 8,31 | ||||
| 2026-01-23 | 13F | Patriot Investment Management Inc. | 5.161 | -6,13 | 741 | -4,15 | ||||
| 2026-02-04 | 13F | Plato Investment Management Ltd | 62.386 | 2,80 | 8.997 | 6,37 | ||||
| 2026-02-13 | 13F | Tower Bridge Advisors | 84.988 | -3,63 | 12.197 | -1,51 | ||||
| 2026-02-12 | 13F | MetLife Investment Management, LLC | 336.881 | -3,36 | 48.349 | -1,24 | ||||
| 2026-01-26 | 13F | Moss Adams Wealth Advisors LLC | 3.788 | 12,74 | 549 | 16,35 | ||||
| 2026-01-26 | 13F | Virginia Wealth Management Group, Inc. | 34.201 | -7,88 | 4.908 | -5,87 | ||||
| 2026-02-12 | 13F | Gardner Russo & Quinn Llc | 9.794 | -10,64 | 1.406 | -8,71 | ||||
| 2026-02-10 | 13F | Daiwa Securities Group Inc. | 400.366 | 4,60 | 57 | 7,55 | ||||
| 2026-01-15 | 13F | Shrier Wealth Management, Llc | 12.785 | 1.835 | ||||||
| 2026-02-02 | 13F | Pittenger & Anderson Inc | 24.826 | 503,45 | 3.563 | 517,50 | ||||
| 2026-02-13 | 13F | Broderick Brian C | 13.377 | -0,59 | 1.920 | 1,59 | ||||
| 2026-01-27 | 13F | Vision Capital Management, Inc. | 2.204 | 1,10 | 316 | 3,27 | ||||
| 2026-02-17 | 13F | Ameriflex Group, Inc. | 1.807 | 56,04 | 259 | 59,88 | ||||
| 2026-02-05 | 13F | GSB Wealth Management, LLC | 15.396 | -5,26 | 2.210 | -3,20 | ||||
| 2026-01-23 | 13F | Patton Fund Management, Inc. | 0 | -100,00 | 0 | |||||
| 2025-11-14 | 13F | Schonfeld Strategic Advisors LLC | 0 | -100,00 | 0 | |||||
| 2026-02-11 | 13F | Miller Investment Management, LP | 4.631 | 0,00 | 665 | 2,15 | ||||
| 2026-02-03 | 13F | Legacy Wealth Managment, LLC/ID | 110 | 27,91 | 16 | 25,00 | ||||
| 2026-01-09 | 13F | GEM Asset Management, LLC | 3.046 | 0,10 | 417 | -2,57 | ||||
| 2026-02-04 | 13F | Stonebridge Financial Group, LLC / MO | 1.766 | 253 | ||||||
| 2026-02-04 | 13F | Midwest Trust Co | 365.041 | -3,22 | 52.391 | -1,10 | ||||
| 2026-01-20 | 13F | Home Federal Bank Of Tennessee | 13.462 | 0,00 | 1.932 | 2,22 | ||||
| 2026-02-11 | 13F | BLI - Banque de Luxembourg Investments | 329.172 | -10,41 | 47.452 | -7,94 | ||||
| 2026-02-09 | 13F | Main Street Research LLC | 2.116 | -9,15 | 307 | -6,42 | ||||
| 2026-02-17 | 13F | IHT Wealth Management, LLC | 33.848 | 3,15 | 4.865 | 5,58 | ||||
| 2026-01-21 | 13F | Carolina Wealth Advisors, LLC | 886 | 0,45 | 127 | 3,25 | ||||
| 2026-01-21 | 13F | Finward Bancorp | 3.429 | -5,04 | 492 | -2,96 | ||||
| 2026-01-22 | 13F | HHM Wealth Advisors, LLC | 2.429 | -19,70 | 349 | -17,92 | ||||
| 2026-01-07 | 13F | Massmutual Trust Co Fsb/adv | 133.759 | -3,25 | 19.197 | -1,12 | ||||
| 2026-02-13 | 13F | Cornercap Investment Counsel Inc | 10.917 | -1,34 | 1.567 | 0,84 | ||||
| 2026-02-11 | 13F | Prestige Wealth Management Group LLC | 3.925 | -7,84 | 569 | -4,85 | ||||
| 2025-09-29 | NP | EGLE - Global X S&P 500 U.S. Revenue Leaders ETF | 83 | -30,25 | 11 | -31,25 | ||||
| 2026-02-10 | 13F | Heritage Trust Co | 23.806 | 11,20 | 3.417 | 13,64 | ||||
| 2026-01-27 | 13F | Oak Harvest Investment Services | 50.898 | 1,41 | 7.305 | 3,63 | ||||
| 2026-02-17 | 13F | Creegan & Nassoura Financial Group, LLC | 18.272 | -4,32 | 2.622 | -2,24 | ||||
| 2026-01-12 | 13F | Willner & Heller, Llc | 2.469 | -17,84 | 354 | -16,11 | ||||
| 2026-02-09 | 13F | Catalyst Funds Management Pty Ltd | 0 | -100,00 | 0 | |||||
| 2026-02-17 | 13F | Kensington Investment Counsel, LLC | 37.963 | 6,05 | 5.448 | 8,37 | ||||
| 2026-02-06 | 13F | Mach-1 Financial Group, Inc. | 2.726 | 83,82 | 391 | 87,98 | ||||
| 2026-02-06 | 13F | Cedar Wealth Management, LLC | 109 | 0,00 | 16 | 0,00 | ||||
| 2025-11-04 | 13F | Pineridge Advisors LLC | 980 | 0,93 | 138 | 7,03 | ||||
| 2026-01-13 | 13F | Trinity Financial Advisors LLC | 2.770 | 0,00 | 401 | 3,08 | ||||
| 2026-01-09 | 13F | Partnership Wealth Management, LLC | 11.828 | -0,83 | 1.698 | 1,31 | ||||
| 2026-02-11 | 13F | Nemes Rush Group LLC | 1.905 | -19,65 | 273 | -18,02 | ||||
| 2026-01-14 | 13F | Congress Park Capital LLC | 5.400 | 0,00 | 775 | 2,24 | ||||
| 2026-01-22 | 13F | Ofi Invest Asset Management | 13.802 | -93,49 | 1.711 | -93,25 | ||||
| 2026-01-27 | 13F | Northstar Asset Management Llc | 16.890 | 0,00 | 2.424 | 2,19 | ||||
| 2026-02-05 | 13F | Blume Capital Management, Inc. | 1.683 | -5,61 | 242 | -3,60 | ||||
| 2026-02-13 | 13F | Maverick Capital Ltd | 3.976 | -75,25 | 571 | -74,73 | ||||
| 2026-02-03 | 13F | Rnc Capital Management Llc | 418.538 | 30,62 | 60.069 | 33,49 | ||||
| 2025-10-17 | 13F | Slocum, Gordon & Co LLP | 0 | -100,00 | 0 | |||||
| 2026-02-11 | 13F | Gaddis Premier Wealth Advisors LLC | 2.176 | 312 | ||||||
| 2026-02-17 | 13F | Imprint Wealth LLC | 179 | -19,37 | 26 | -19,35 | ||||
| 2026-02-05 | 13F | Thayer Partners, LLC / MA | 2.202 | 316 | ||||||
| 2026-02-04 | 13F | Naples Global Advisors, Llc | 26.403 | -2,00 | 3.825 | 1,08 | ||||
| 2026-01-13 | 13F | Regatta Capital Group, Llc | 6.242 | -14,01 | 896 | -12,17 | ||||
| 2026-01-23 | 13F | Northwest Quadrant Wealth Management, LLC | 3.429 | 0,00 | 492 | 2,29 | ||||
| 2026-02-17 | 13F | Covington Investment Advisors Inc. | 28.980 | -7,28 | 4 | 0,00 | ||||
| 2026-02-17 | 13F | Cim Investment Mangement Inc | 5.357 | 0,00 | 769 | 2,13 | ||||
| 2026-01-26 | 13F | Roman Butler Fullerton & Co | 4.916 | -4,64 | 710 | -5,84 | ||||
| 2026-02-27 | 13F | Groupama Asset Managment | 10.360 | -7,04 | 1.487 | -5,05 | ||||
| 2026-01-08 | 13F | Maridea Wealth Management LLC | 2.997 | -3,57 | 430 | -9,87 | ||||
| 2026-02-10 | 13F | Thoroughbred Financial Services, Llc | 10.896 | -2,82 | 2 | 0,00 |