Grundlæggende statistik
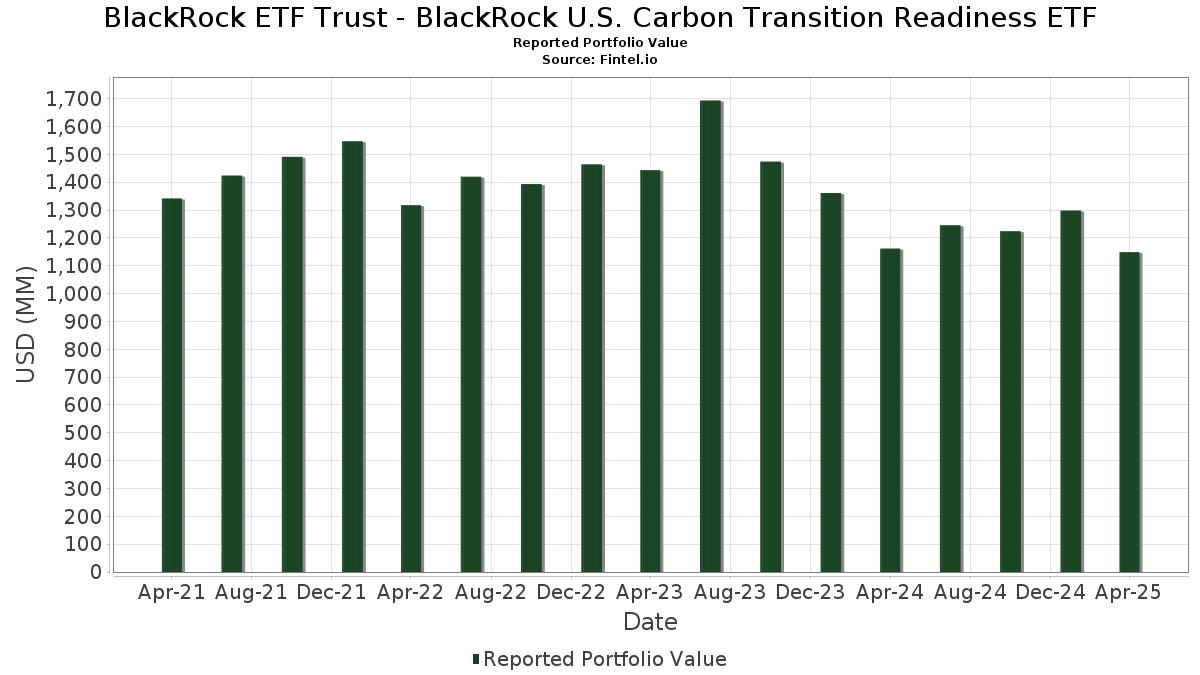
| Porteføljeværdi | $ 1.308.267.655 |
| Nuværende stillinger | 305 |
Seneste beholdninger, ydeevne, AUM (fra 13F, 13D)
BlackRock ETF Trust - BlackRock U.S. Carbon Transition Readiness ETF har afsløret 305 samlede besiddelser i deres seneste SEC-arkivering. Den seneste porteføljeværdi er beregnet til at være $ 1.308.267.655 USD. Faktiske aktiver under forvaltning (AUM) er denne værdi plus kontanter (som ikke er oplyst). BlackRock ETF Trust - BlackRock U.S. Carbon Transition Readiness ETFs største beholdninger er NVIDIA Corporation (US:NVDA) , Microsoft Corporation (US:MSFT) , Apple Inc. (US:AAPL) , Amazon.com, Inc. (US:AMZN) , and Meta Platforms, Inc. (US:META) . BlackRock ETF Trust - BlackRock U.S. Carbon Transition Readiness ETFs nye stillinger omfatter Carpenter Technology Corporation (US:CRS) , Toast, Inc. (US:TOST) , Flutter Entertainment plc (US:FLUT) , Rocket Lab Corporation (US:RKLB) , and CMS Energy Corporation (US:CMS) .
Top øger dette kvartal
Vi bruger ændringen i porteføljeallokeringen, fordi dette er den mest meningsfulde metrik. Ændringer kan skyldes handler eller ændringer i aktiekurser.
| Sikkerhed | Aktier (MM) |
Værdi (MM$) |
Portefølje % | ΔPortefølje % |
|---|---|---|---|---|
| NVDA / NVIDIA Corporation | 0,54 | 95,29 | 7,2948 | 2,1953 |
| MSFT / Microsoft Corporation | 0,14 | 74,43 | 5,6973 | 0,9525 |
| VICI / VICI Properties Inc. | 0,39 | 12,84 | 0,9827 | 0,7738 |
| META / Meta Platforms, Inc. | 0,05 | 39,22 | 3,0026 | 0,6706 |
| AVGO / Broadcom Inc. | 0,10 | 29,35 | 2,2469 | 0,5644 |
| AMZN / Amazon.com, Inc. | 0,19 | 44,28 | 3,3899 | 0,4464 |
| GWW / W.W. Grainger, Inc. | 0,01 | 5,87 | 0,4494 | 0,3387 |
| CL / Colgate-Palmolive Company | 0,13 | 11,18 | 0,8562 | 0,2872 |
| CHRW / C.H. Robinson Worldwide, Inc. | 0,05 | 6,11 | 0,4681 | 0,2770 |
| ORCL / Oracle Corporation | 0,03 | 7,59 | 0,5810 | 0,2273 |
Top falder i dette kvartal
Vi bruger ændringen i porteføljeallokeringen, fordi dette er den mest meningsfulde metrik. Ændringer kan skyldes handler eller ændringer i aktiekurser.
| Sikkerhed | Aktier (MM) |
Værdi (MM$) |
Portefølje % | ΔPortefølje % |
|---|---|---|---|---|
| AAPL / Apple Inc. | 0,34 | 70,96 | 5,4317 | -0,9466 |
| JNJ / Johnson & Johnson | 0,01 | 0,90 | 0,0690 | -0,6376 |
| KO / The Coca-Cola Company | 0,13 | 8,69 | 0,6649 | -0,5590 |
| MDT / Medtronic plc | 0,02 | 1,82 | 0,1395 | -0,4694 |
| LLY / Eli Lilly and Company | 0,02 | 15,39 | 1,1784 | -0,4307 |
| ROK / Rockwell Automation, Inc. | 0,00 | 0,14 | 0,0110 | -0,3548 |
| COST / Costco Wholesale Corporation | 0,01 | 9,35 | 0,7154 | -0,3543 |
| PPG / PPG Industries, Inc. | 0,02 | 1,84 | 0,1405 | -0,3436 |
| CI / The Cigna Group | 0,00 | 1,26 | 0,0965 | -0,3323 |
| EG / Everest Group, Ltd. | 0,00 | 0,12 | 0,0090 | -0,3224 |
13F og Fondsarkivering
Denne formular blev indsendt den 2025-09-24 for rapporteringsperioden 2025-07-31. Klik på linkikonet for at se den fulde transaktionshistorik.
Opgrader for at låse op for premium-data og eksportere til Excel ![]() .
.
| Sikkerhed | Type | Gennemsnitlig aktiekurs | Aktier (MM) |
Δ Aktier (%) |
Δ Aktier (%) |
Værdi ($MM) |
Portefølje (%) |
ΔPortefølje (%) |
|
|---|---|---|---|---|---|---|---|---|---|
| NVDA / NVIDIA Corporation | 0,54 | -0,17 | 95,29 | 63,03 | 7,2948 | 2,1953 | |||
| MSFT / Microsoft Corporation | 0,14 | 1,38 | 74,43 | 36,84 | 5,6973 | 0,9525 | |||
| AAPL / Apple Inc. | 0,34 | -0,64 | 70,96 | -2,95 | 5,4317 | -0,9466 | |||
| AMZN / Amazon.com, Inc. | 0,19 | 3,39 | 44,28 | 31,25 | 3,3899 | 0,4464 | |||
| META / Meta Platforms, Inc. | 0,05 | 4,15 | 39,22 | 46,74 | 3,0026 | 0,6706 | |||
| AVGO / Broadcom Inc. | 0,10 | -0,26 | 29,35 | 52,19 | 2,2469 | 0,5644 | |||
| GOOGL / Alphabet Inc. | 0,12 | -15,68 | 23,36 | 1,90 | 1,7881 | -0,2117 | |||
| MA / Mastercard Incorporated | 0,04 | -1,59 | 22,22 | 1,72 | 1,7009 | -0,2048 | |||
| BRK.B / Berkshire Hathaway Inc. | 0,04 | 9,23 | 20,86 | -3,34 | 1,5971 | -0,2860 | |||
| TSLA / Tesla, Inc. | 0,07 | 0,04 | 20,39 | 9,29 | 1,5606 | -0,0667 | |||
| JPM / JPMorgan Chase & Co. | 0,07 | -8,39 | 19,91 | 10,94 | 1,5243 | -0,0416 | |||
| GOOG / Alphabet Inc. | 0,10 | -10,32 | 19,52 | 7,50 | 1,4942 | -0,0898 | |||
| GS / The Goldman Sachs Group, Inc. | 0,02 | -18,36 | 15,90 | 7,88 | 1,2169 | -0,0686 | |||
| LLY / Eli Lilly and Company | 0,02 | 1,37 | 15,39 | -16,54 | 1,1784 | -0,4307 | |||
| NFLX / Netflix, Inc. | 0,01 | 6,34 | 14,77 | 8,94 | 1,1304 | -0,0522 | |||
| CSCO / Cisco Systems, Inc. | 0,21 | 9,84 | 14,38 | 29,54 | 1,1008 | 0,1323 | |||
| GE / General Electric Company | 0,05 | -6,36 | 13,84 | 25,96 | 1,0595 | 0,1008 | |||
| ADSK / Autodesk, Inc. | 0,05 | 19,24 | 13,76 | 31,80 | 1,0530 | 0,1424 | |||
| ECL / Ecolab Inc. | 0,05 | -0,30 | 13,73 | 3,79 | 1,0513 | -0,1030 | |||
| VICI / VICI Properties Inc. | 0,39 | 426,54 | 12,84 | 436,22 | 0,9827 | 0,7738 | |||
| CL / Colgate-Palmolive Company | 0,13 | 88,55 | 11,18 | 71,48 | 0,8562 | 0,2872 | |||
| PEG / Public Service Enterprise Group Incorporated | 0,11 | -1,42 | 9,69 | 10,74 | 0,7418 | -0,0216 | |||
| TMUS / T-Mobile US, Inc. | 0,04 | -15,23 | 9,42 | -18,16 | 0,7207 | -0,2830 | |||
| COST / Costco Wholesale Corporation | 0,01 | -19,33 | 9,35 | -23,78 | 0,7154 | -0,3543 | |||
| TJX / The TJX Companies, Inc. | 0,07 | 10,82 | 9,32 | 7,25 | 0,7137 | -0,0447 | |||
| NDAQ / Nasdaq, Inc. | 0,09 | 6,46 | 9,12 | 34,42 | 0,6978 | 0,1061 | |||
| ETN / Eaton Corporation plc | 0,02 | -10,41 | 9,05 | 17,08 | 0,6927 | 0,0184 | |||
| KEY / KeyCorp | 0,50 | 4,17 | 8,90 | 25,79 | 0,6814 | 0,0641 | |||
| ACN / Accenture plc | 0,03 | 10,50 | 8,75 | -1,33 | 0,6697 | -0,1039 | |||
| KO / The Coca-Cola Company | 0,13 | -33,84 | 8,69 | -38,09 | 0,6649 | -0,5590 | |||
| SPGI / S&P Global Inc. | 0,02 | -9,10 | 8,59 | 0,17 | 0,6579 | -0,0905 | |||
| BKR / Baker Hughes Company | 0,19 | 9,16 | 8,57 | 38,93 | 0,6560 | 0,1178 | |||
| COF / Capital One Financial Corporation | 0,04 | -6,53 | 8,30 | 11,48 | 0,6355 | -0,0141 | |||
| RTX / RTX Corporation | 0,05 | -12,41 | 8,27 | 9,42 | 0,6330 | -0,0263 | |||
| AMD / Advanced Micro Devices, Inc. | 0,05 | -11,41 | 8,21 | 60,47 | 0,6286 | 0,1821 | |||
| GILD / Gilead Sciences, Inc. | 0,07 | 8,88 | 7,64 | 14,76 | 0,5850 | 0,0040 | |||
| ORCL / Oracle Corporation | 0,03 | 3,81 | 7,59 | 87,22 | 0,5810 | 0,2273 | |||
| YUM / Yum! Brands, Inc. | 0,05 | -0,26 | 7,31 | -4,43 | 0,5595 | -0,1077 | |||
| ABT / Abbott Laboratories | 0,06 | -0,26 | 7,17 | -3,74 | 0,5491 | -0,1010 | |||
| ES / Eversource Energy | 0,11 | 20,80 | 7,13 | 34,24 | 0,5459 | 0,0825 | |||
| PLTR / Palantir Technologies Inc. | 0,04 | 10,10 | 7,10 | 47,20 | 0,5437 | 0,1228 | |||
| BKNG / Booking Holdings Inc. | 0,00 | -16,59 | 6,95 | -9,97 | 0,5317 | -0,1414 | |||
| ABBV / AbbVie Inc. | 0,04 | 3,69 | 6,91 | 0,45 | 0,5287 | -0,0711 | |||
| HD / The Home Depot, Inc. | 0,02 | -23,78 | 6,77 | -22,30 | 0,5181 | -0,2418 | |||
| US0669224778 / BlackRock Cash Funds: Treasury, SL Agency Shares | 6,48 | 1,09 | 6,48 | 1,09 | 0,4960 | -0,0632 | |||
| XOM / Exxon Mobil Corporation | 0,06 | 69,25 | 6,43 | 78,88 | 0,4922 | 0,1786 | |||
| CRH / CRH plc | 0,07 | 110,02 | 6,38 | 110,14 | 0,4887 | 0,2236 | |||
| UBER / Uber Technologies, Inc. | 0,07 | 20,87 | 6,35 | 30,92 | 0,4863 | 0,0630 | |||
| LRCX / Lam Research Corporation | 0,06 | -0,26 | 6,16 | 31,97 | 0,4718 | 0,0644 | |||
| CHRW / C.H. Robinson Worldwide, Inc. | 0,05 | 116,01 | 6,11 | 179,18 | 0,4681 | 0,2770 | |||
| INTU / Intuit Inc. | 0,01 | -9,99 | 6,10 | 12,62 | 0,4673 | -0,0056 | |||
| TT / Trane Technologies plc | 0,01 | -22,00 | 6,10 | -10,85 | 0,4673 | -0,1301 | |||
| PLD / Prologis, Inc. | 0,06 | 8,96 | 6,10 | 13,84 | 0,4667 | -0,0005 | |||
| OKE / ONEOK, Inc. | 0,07 | 21,90 | 6,04 | 21,83 | 0,4622 | 0,0298 | |||
| EBAY / eBay Inc. | 0,06 | -0,26 | 5,95 | 34,25 | 0,4558 | 0,0689 | |||
| AJG / Arthur J. Gallagher & Co. | 0,02 | 129,69 | 5,94 | 105,75 | 0,4544 | 0,2027 | |||
| GWW / W.W. Grainger, Inc. | 0,01 | 355,85 | 5,87 | 362,65 | 0,4494 | 0,3387 | |||
| WMT / Walmart Inc. | 0,06 | -4,65 | 5,78 | -3,92 | 0,4428 | -0,0825 | |||
| HUBB / Hubbell Incorporated | 0,01 | -0,26 | 5,78 | 20,15 | 0,4427 | 0,0228 | |||
| ACM / AECOM | 0,05 | 23,02 | 5,72 | 40,60 | 0,4380 | 0,0829 | |||
| V / Visa Inc. | 0,02 | -11,51 | 5,71 | -11,53 | 0,4371 | -0,1259 | |||
| NOW / ServiceNow, Inc. | 0,01 | -15,45 | 5,59 | -16,51 | 0,4282 | -0,1563 | |||
| IBM / International Business Machines Corporation | 0,02 | -3,71 | 5,51 | 0,81 | 0,4216 | -0,0551 | |||
| RCL / Royal Caribbean Cruises Ltd. | 0,02 | -10,18 | 5,50 | 32,86 | 0,4206 | 0,0598 | |||
| PFE / Pfizer Inc. | 0,23 | 29,54 | 5,42 | 23,60 | 0,4150 | 0,0323 | |||
| CMI / Cummins Inc. | 0,01 | -27,39 | 5,39 | -9,16 | 0,4129 | -0,1051 | |||
| J / Jacobs Solutions Inc. | 0,04 | -0,26 | 5,31 | 14,28 | 0,4068 | 0,0012 | |||
| CRM / Salesforce, Inc. | 0,02 | -22,28 | 5,27 | -25,29 | 0,4035 | -0,2120 | |||
| AMAT / Applied Materials, Inc. | 0,03 | 17,54 | 4,93 | 40,45 | 0,3777 | 0,0712 | |||
| USB / U.S. Bancorp | 0,11 | 17,25 | 4,88 | 30,69 | 0,3739 | 0,0478 | |||
| ADBE / Adobe Inc. | 0,01 | 20,24 | 4,81 | 14,68 | 0,3683 | 0,0023 | |||
| WFC / Wells Fargo & Company | 0,06 | -6,23 | 4,75 | 6,46 | 0,3634 | -0,0256 | |||
| MDLZ / Mondelez International, Inc. | 0,07 | -4,08 | 4,62 | -8,92 | 0,3539 | -0,0890 | |||
| VEEV / Veeva Systems Inc. | 0,02 | -21,10 | 4,60 | -4,05 | 0,3520 | -0,0661 | |||
| MRK / Merck & Co., Inc. | 0,06 | 18,82 | 4,56 | 8,95 | 0,3494 | -0,0161 | |||
| MKC / McCormick & Company, Incorporated | 0,06 | 8,06 | 4,52 | -0,44 | 0,3463 | -0,0501 | |||
| PEP / PepsiCo, Inc. | 0,03 | 17,03 | 4,49 | 19,06 | 0,3438 | 0,0147 | |||
| CVX / Chevron Corporation | 0,03 | 32,29 | 4,49 | 47,45 | 0,3437 | 0,0780 | |||
| ADI / Analog Devices, Inc. | 0,02 | -7,77 | 4,48 | 6,28 | 0,3431 | -0,0248 | |||
| CBRE / CBRE Group, Inc. | 0,03 | 153,71 | 4,44 | 223,44 | 0,3402 | 0,2203 | |||
| GEV / GE Vernova Inc. | 0,01 | -12,57 | 4,39 | 55,66 | 0,3357 | 0,0900 | |||
| CAT / Caterpillar Inc. | 0,01 | -21,72 | 4,29 | 10,86 | 0,3282 | -0,0092 | |||
| ARES / Ares Management Corporation | 0,02 | 27,60 | 4,16 | 55,20 | 0,3188 | 0,0847 | |||
| AMGN / Amgen Inc. | 0,01 | -23,05 | 4,16 | -21,93 | 0,3188 | -0,1467 | |||
| TPR / Tapestry, Inc. | 0,04 | 13,82 | 4,04 | 74,05 | 0,3091 | 0,1067 | |||
| PANW / Palo Alto Networks, Inc. | 0,02 | -0,26 | 4,00 | -7,38 | 0,3065 | -0,0706 | |||
| HUM / Humana Inc. | 0,02 | 57,91 | 3,83 | 50,49 | 0,2932 | 0,0711 | |||
| ISRG / Intuitive Surgical, Inc. | 0,01 | -0,26 | 3,64 | -6,97 | 0,2788 | -0,0628 | |||
| KKR / KKR & Co. Inc. | 0,02 | -0,27 | 3,63 | 27,90 | 0,2776 | 0,0303 | |||
| HIG / The Hartford Insurance Group, Inc. | 0,03 | 0,00 | 3,61 | 1,41 | 0,2761 | -0,0342 | |||
| SRE / Sempra | 0,04 | -33,16 | 3,58 | -26,50 | 0,2742 | -0,1509 | |||
| FTI / TechnipFMC plc | 0,10 | -0,26 | 3,52 | 28,78 | 0,2692 | 0,0310 | |||
| VZ / Verizon Communications Inc. | 0,08 | 172,40 | 3,50 | 164,47 | 0,2679 | 0,1524 | |||
| SYY / Sysco Corporation | 0,04 | 27,34 | 3,46 | 42,00 | 0,2648 | 0,0522 | |||
| LYV / Live Nation Entertainment, Inc. | 0,02 | 62,19 | 3,44 | 199,48 | 0,2637 | 0,1851 | |||
| HON / Honeywell International Inc. | 0,02 | -0,26 | 3,43 | 5,34 | 0,2627 | -0,0215 | |||
| BDX / Becton, Dickinson and Company | 0,02 | 137,98 | 3,43 | 104,90 | 0,2623 | 0,1164 | |||
| DIS / The Walt Disney Company | 0,03 | 46,51 | 3,41 | 91,90 | 0,2611 | 0,1060 | |||
| QCOM / QUALCOMM Incorporated | 0,02 | -7,96 | 3,40 | -9,02 | 0,2602 | -0,0657 | |||
| IPG / The Interpublic Group of Companies, Inc. | 0,14 | -0,26 | 3,36 | -2,33 | 0,2572 | -0,0429 | |||
| VRTX / Vertex Pharmaceuticals Incorporated | 0,01 | 112,31 | 3,35 | 90,39 | 0,2564 | 0,1029 | |||
| GEN / Gen Digital Inc. | 0,11 | -0,26 | 3,30 | 13,68 | 0,2526 | -0,0006 | |||
| WAT / Waters Corporation | 0,01 | 51,76 | 3,25 | 26,03 | 0,2491 | 0,0238 | |||
| TGT / Target Corporation | 0,03 | 130,29 | 3,21 | 139,34 | 0,2459 | 0,1288 | |||
| BAC / Bank of America Corporation | 0,07 | 33,57 | 3,19 | 58,30 | 0,2439 | 0,0683 | |||
| NEE / NextEra Energy, Inc. | 0,04 | 11,43 | 3,17 | 18,41 | 0,2423 | 0,0091 | |||
| ACGL / Arch Capital Group Ltd. | 0,04 | -7,66 | 3,13 | -12,39 | 0,2393 | -0,0719 | |||
| ETSY / Etsy, Inc. | 0,05 | -26,56 | 3,11 | -1,58 | 0,2384 | -0,0377 | |||
| VLTO / Veralto Corporation | 0,03 | -0,26 | 3,11 | 9,04 | 0,2383 | -0,0108 | |||
| CDNS / Cadence Design Systems, Inc. | 0,01 | -10,33 | 3,10 | 9,80 | 0,2376 | -0,0090 | |||
| UNH / UnitedHealth Group Incorporated | 0,01 | 20,58 | 3,04 | -26,85 | 0,2323 | -0,1297 | |||
| XYZ / Block, Inc. | 0,04 | -23,09 | 2,87 | 1,63 | 0,2194 | -0,0267 | |||
| ANTM / Anthem Inc | 0,01 | 0,00 | 2,84 | -32,70 | 0,2173 | -0,1506 | |||
| SBUX / Starbucks Corporation | 0,03 | 34,18 | 2,84 | 49,45 | 0,2170 | 0,0515 | |||
| MPC / Marathon Petroleum Corporation | 0,02 | -38,20 | 2,81 | -23,46 | 0,2151 | -0,1051 | |||
| ALL / The Allstate Corporation | 0,01 | -6,22 | 2,75 | -3,92 | 0,2104 | -0,0392 | |||
| NKE / NIKE, Inc. | 0,04 | 26,46 | 2,75 | 67,46 | 0,2104 | 0,0672 | |||
| JBHT / J.B. Hunt Transport Services, Inc. | 0,02 | -0,26 | 2,67 | 10,02 | 0,2043 | -0,0073 | |||
| ADP / Automatic Data Processing, Inc. | 0,01 | 70,29 | 2,62 | 75,35 | 0,2004 | 0,0702 | |||
| A / Agilent Technologies, Inc. | 0,02 | 8,87 | 2,62 | 16,21 | 0,2003 | 0,0038 | |||
| ILMN / Illumina, Inc. | 0,02 | -0,26 | 2,49 | 31,99 | 0,1908 | 0,0261 | |||
| US0669225197 / BlackRock Cash Funds: Institutional, SL Agency Shares | 2,46 | -19,97 | 2,46 | -19,97 | 0,1887 | -0,0800 | |||
| CLH / Clean Harbors, Inc. | 0,01 | -23,26 | 2,46 | -15,40 | 0,1884 | -0,0655 | |||
| EW / Edwards Lifesciences Corporation | 0,03 | -0,26 | 2,42 | 4,77 | 0,1852 | -0,0162 | |||
| ED / Consolidated Edison, Inc. | 0,02 | -5,11 | 2,37 | -12,91 | 0,1818 | -0,0561 | |||
| CVS / CVS Health Corporation | 0,04 | -19,39 | 2,37 | -24,97 | 0,1811 | -0,0940 | |||
| EXPD / Expeditors International of Washington, Inc. | 0,02 | -5,96 | 2,36 | -0,55 | 0,1808 | -0,0264 | |||
| WY / Weyerhaeuser Company | 0,09 | -28,90 | 2,32 | -31,27 | 0,1777 | -0,1169 | |||
| OSK / Oshkosh Corporation | 0,02 | 354,79 | 2,31 | 588,10 | 0,1770 | 0,1477 | |||
| WM / Waste Management, Inc. | 0,01 | -20,06 | 2,30 | -21,48 | 0,1758 | -0,0794 | |||
| CRWD / CrowdStrike Holdings, Inc. | 0,01 | 22,29 | 2,29 | 29,58 | 0,1754 | 0,0212 | |||
| COR / Cencora, Inc. | 0,01 | 145,34 | 2,29 | 139,83 | 0,1752 | 0,0919 | |||
| ALNY / Alnylam Pharmaceuticals, Inc. | 0,01 | 15,35 | 2,28 | 71,89 | 0,1747 | 0,0588 | |||
| CHD / Church & Dwight Co., Inc. | 0,02 | -51,42 | 2,26 | -54,15 | 0,1731 | -0,2571 | |||
| LPLA / LPL Financial Holdings Inc. | 0,01 | -0,25 | 2,17 | 23,44 | 0,1661 | 0,0127 | |||
| FNB / F.N.B. Corporation | 0,14 | -0,26 | 2,13 | 16,69 | 0,1633 | 0,0039 | |||
| DE / Deere & Company | 0,00 | -5,86 | 2,11 | 6,47 | 0,1613 | -0,0113 | |||
| TRV / The Travelers Companies, Inc. | 0,01 | 88,77 | 2,07 | 86,09 | 0,1587 | 0,0615 | |||
| BIIB / Biogen Inc. | 0,02 | -0,26 | 2,07 | 5,45 | 0,1584 | -0,0128 | |||
| APO / Apollo Global Management, Inc. | 0,01 | 90,55 | 2,07 | 102,95 | 0,1582 | 0,0693 | |||
| AVY / Avery Dennison Corporation | 0,01 | 7,14 | 2,06 | 5,04 | 0,1581 | -0,0134 | |||
| KLAC / KLA Corporation | 0,00 | 64,64 | 2,05 | 106,03 | 0,1570 | 0,0701 | |||
| HOLX / Hologic, Inc. | 0,03 | 29,76 | 2,00 | 49,03 | 0,1534 | 0,0360 | |||
| CINF / Cincinnati Financial Corporation | 0,01 | -0,26 | 1,91 | 5,69 | 0,1464 | -0,0115 | |||
| HOOD / Robinhood Markets, Inc. | 0,02 | 31,22 | 1,90 | 175,40 | 0,1457 | 0,0854 | |||
| CEG / Constellation Energy Corporation | 0,01 | -0,26 | 1,90 | 55,27 | 0,1454 | 0,0387 | |||
| PPG / PPG Industries, Inc. | 0,02 | -65,88 | 1,84 | -66,93 | 0,1405 | -0,3436 | |||
| DOCU / DocuSign, Inc. | 0,02 | 190,95 | 1,83 | 169,47 | 0,1399 | 0,0807 | |||
| MDT / Medtronic plc | 0,02 | -75,48 | 1,82 | -73,91 | 0,1395 | -0,4694 | |||
| RL / Ralph Lauren Corporation | 0,01 | 55,77 | 1,81 | 106,87 | 0,1383 | 0,0621 | |||
| EXPE / Expedia Group, Inc. | 0,01 | 9,27 | 1,79 | 25,53 | 0,1371 | 0,0126 | |||
| VLO / Valero Energy Corporation | 0,01 | -0,26 | 1,77 | 17,96 | 0,1358 | 0,0046 | |||
| PCG / PG&E Corporation | 0,13 | -0,26 | 1,77 | -15,37 | 0,1358 | -0,0470 | |||
| SPR / Spirit AeroSystems Holdings, Inc. | 0,04 | 693,82 | 1,77 | 772,41 | 0,1356 | 0,1178 | |||
| MCD / McDonald's Corporation | 0,01 | 117,18 | 1,77 | 103,92 | 0,1353 | 0,0597 | |||
| KDP / Keurig Dr Pepper Inc. | 0,05 | -18,72 | 1,75 | -23,29 | 0,1337 | -0,0649 | |||
| INTC / Intel Corporation | 0,09 | -0,26 | 1,74 | -1,75 | 0,1335 | -0,0213 | |||
| COP / ConocoPhillips | 0,02 | 44,19 | 1,71 | 54,24 | 0,1309 | 0,0342 | |||
| MGM / MGM Resorts International | 0,05 | -0,27 | 1,67 | 15,54 | 0,1281 | 0,0018 | |||
| ZM / Zoom Communications Inc. | 0,02 | -0,27 | 1,66 | -4,76 | 0,1270 | -0,0250 | |||
| SNPS / Synopsys, Inc. | 0,00 | -0,23 | 1,64 | 37,73 | 0,1255 | 0,0216 | |||
| LHX / L3Harris Technologies, Inc. | 0,01 | 358,66 | 1,64 | 474,39 | 0,1253 | 0,1004 | |||
| NTRA / Natera, Inc. | 0,01 | 18,68 | 1,64 | 5,14 | 0,1252 | -0,0106 | |||
| WSM / Williams-Sonoma, Inc. | 0,01 | -11,57 | 1,62 | 7,14 | 0,1240 | -0,0080 | |||
| AMP / Ameriprise Financial, Inc. | 0,00 | 56,38 | 1,62 | 72,13 | 0,1239 | 0,0418 | |||
| ZS / Zscaler, Inc. | 0,01 | -11,75 | 1,60 | 11,40 | 0,1228 | -0,0028 | |||
| KMPR / Kemper Corporation | 0,03 | 86,92 | 1,60 | 94,77 | 0,1226 | 0,0508 | |||
| BXP / Boston Properties, Inc. | 0,02 | -0,26 | 1,60 | 2,37 | 0,1224 | -0,0138 | |||
| TRMB / Trimble Inc. | 0,02 | 278,40 | 1,58 | 411,00 | 0,1209 | 0,0940 | |||
| OKTA / Okta, Inc. | 0,02 | -15,63 | 1,58 | -26,43 | 0,1208 | -0,0663 | |||
| BBY / Best Buy Co., Inc. | 0,02 | 16,41 | 1,57 | 13,59 | 0,1203 | -0,0004 | |||
| AGO / Assured Guaranty Ltd. | 0,02 | -0,26 | 1,54 | -3,87 | 0,1178 | -0,0218 | |||
| EL / The Estée Lauder Companies Inc. | 0,02 | -0,27 | 1,53 | 55,26 | 0,1175 | 0,0312 | |||
| LVS / Las Vegas Sands Corp. | 0,03 | -13,92 | 1,53 | 22,98 | 0,1168 | 0,0086 | |||
| FTNT / Fortinet, Inc. | 0,01 | -34,75 | 1,49 | -37,18 | 0,1142 | -0,0930 | |||
| LNG / Cheniere Energy, Inc. | 0,01 | -69,75 | 1,48 | -69,13 | 0,1132 | -0,3045 | |||
| PYPL / PayPal Holdings, Inc. | 0,02 | -0,26 | 1,40 | 4,17 | 0,1071 | -0,0101 | |||
| XYL / Xylem Inc. | 0,01 | -12,62 | 1,39 | 4,74 | 0,1067 | -0,0093 | |||
| TEAM / Atlassian Corporation | 0,01 | 127,56 | 1,37 | 91,36 | 0,1052 | 0,0425 | |||
| XRAY / DENTSPLY SIRONA Inc. | 0,10 | 65,19 | 1,37 | 70,15 | 0,1047 | 0,0346 | |||
| ALB / Albemarle Corporation | 0,02 | 13,62 | 1,36 | 31,69 | 0,1041 | 0,0140 | |||
| MRVL / Marvell Technology, Inc. | 0,02 | 13,03 | 1,35 | 55,61 | 0,1031 | 0,0276 | |||
| WDAY / Workday, Inc. | 0,01 | -0,27 | 1,34 | -6,61 | 0,1028 | -0,0227 | |||
| SPOT / Spotify Technology S.A. | 0,00 | -0,28 | 1,33 | 1,76 | 0,1021 | -0,0122 | |||
| NEM / Newmont Corporation | 0,02 | 339,87 | 1,31 | 419,84 | 0,1003 | 0,0782 | |||
| MCK / McKesson Corporation | 0,00 | 123,17 | 1,31 | 117,08 | 0,1002 | 0,0476 | |||
| CI / The Cigna Group | 0,00 | -67,39 | 1,26 | -74,36 | 0,0965 | -0,3323 | |||
| PCAR / PACCAR Inc | 0,01 | -45,75 | 1,24 | -40,61 | 0,0952 | -0,0875 | |||
| NI / NiSource Inc. | 0,03 | 107,93 | 1,24 | 125,82 | 0,0951 | 0,0471 | |||
| EIX / Edison International | 0,02 | -0,26 | 1,23 | -2,84 | 0,0943 | -0,0163 | |||
| HPE / Hewlett Packard Enterprise Company | 0,06 | -0,26 | 1,19 | 27,32 | 0,0913 | 0,0095 | |||
| CRS / Carpenter Technology Corporation | 0,00 | 1,18 | 0,0902 | 0,0902 | |||||
| MU / Micron Technology, Inc. | 0,01 | 23,30 | 1,17 | 74,78 | 0,0897 | 0,0312 | |||
| DECK / Deckers Outdoor Corporation | 0,01 | -0,26 | 1,13 | -4,47 | 0,0867 | -0,0167 | |||
| AAL / American Airlines Group Inc. | 0,10 | -0,26 | 1,13 | 15,16 | 0,0867 | 0,0009 | |||
| FMC / FMC Corporation | 0,03 | -0,26 | 1,13 | -7,07 | 0,0866 | -0,0197 | |||
| ULTA / Ulta Beauty, Inc. | 0,00 | 87,74 | 1,07 | 75,45 | 0,0821 | 0,0393 | |||
| HXL / Hexcel Corporation | 0,02 | -0,25 | 1,07 | 23,33 | 0,0818 | 0,0062 | |||
| PODD / Insulet Corporation | 0,00 | 275,03 | 1,06 | 329,27 | 0,0809 | 0,0594 | |||
| DVA / DaVita Inc. | 0,01 | -43,78 | 1,04 | -44,26 | 0,0799 | -0,0835 | |||
| PWR / Quanta Services, Inc. | 0,00 | -36,05 | 1,04 | -11,23 | 0,0793 | -0,0225 | |||
| REG / Regency Centers Corporation | 0,01 | -0,26 | 1,04 | -1,33 | 0,0793 | -0,0123 | |||
| MSTR / Strategy Inc | 0,00 | 123,72 | 1,02 | 136,60 | 0,0778 | 0,0403 | |||
| CG / The Carlyle Group Inc. | 0,02 | 17,79 | 1,01 | 85,11 | 0,0771 | 0,0296 | |||
| NRG / NRG Energy, Inc. | 0,01 | 272,59 | 1,00 | 470,86 | 0,0765 | 0,0612 | |||
| APP / AppLovin Corporation | 0,00 | -8,63 | 0,99 | 32,62 | 0,0760 | 0,0107 | |||
| JNJ / Johnson & Johnson | 0,01 | -89,44 | 0,90 | -88,88 | 0,0690 | -0,6376 | |||
| MNST / Monster Beverage Corporation | 0,02 | -5,80 | 0,90 | 0,56 | 0,0685 | 0,0029 | |||
| JBL / Jabil Inc. | 0,00 | 138,03 | 0,88 | 262,81 | 0,0673 | 0,0461 | |||
| RBLX / Roblox Corporation | 0,01 | 0,87 | 0,0670 | 0,0670 | |||||
| PFG / Principal Financial Group, Inc. | 0,01 | 0,26 | 0,85 | 5,32 | 0,0652 | -0,0054 | |||
| ATI / ATI Inc. | 0,01 | 240,61 | 0,85 | 382,86 | 0,0648 | 0,0494 | |||
| CFG / Citizens Financial Group, Inc. | 0,02 | -48,37 | 0,84 | -41,51 | 0,0646 | -0,0538 | |||
| VTR / Ventas, Inc. | 0,01 | -36,81 | 0,84 | -39,42 | 0,0643 | -0,0566 | |||
| PSN / Parsons Corporation | 0,01 | -15,07 | 0,82 | -5,85 | 0,0629 | -0,0132 | |||
| WRB / W. R. Berkley Corporation | 0,01 | 104,83 | 0,81 | 96,62 | 0,0623 | 0,0262 | |||
| CH1300646267 / Bunge Global SA | 0,01 | 66,05 | 0,79 | 68,09 | 0,0602 | 0,0194 | |||
| CCL / Carnival Corporation & plc | 0,03 | 43,42 | 0,77 | 132,73 | 0,0589 | 0,0300 | |||
| MCO / Moody's Corporation | 0,00 | 56,81 | 0,77 | 106,20 | 0,0586 | 0,0313 | |||
| BMY / Bristol-Myers Squibb Company | 0,02 | 476,51 | 0,74 | 400,00 | 0,0567 | 0,0437 | |||
| DOC / Healthpeak Properties, Inc. | 0,04 | -0,26 | 0,73 | -5,30 | 0,0561 | -0,0114 | |||
| RIVN / Rivian Automotive, Inc. | 0,06 | -0,26 | 0,73 | -6,06 | 0,0558 | -0,0119 | |||
| TFC / Truist Financial Corporation | 0,02 | 118.021,43 | 0,72 | 0,0553 | 0,0553 | ||||
| TOST / Toast, Inc. | 0,01 | 0,72 | 0,0547 | 0,0547 | |||||
| KRC / Kilroy Realty Corporation | 0,02 | -49,74 | 0,70 | -41,22 | 0,0538 | -0,0505 | |||
| RGA / Reinsurance Group of America, Incorporated | 0,00 | -60,60 | 0,70 | -59,51 | 0,0533 | -0,0967 | |||
| DASH / DoorDash, Inc. | 0,00 | 188,38 | 0,68 | 363,01 | 0,0518 | 0,0398 | |||
| AMT / American Tower Corporation | 0,00 | -40,97 | 0,67 | -45,45 | 0,0515 | -0,0560 | |||
| WEN / The Wendy's Company | 0,07 | 30,46 | 0,67 | 2,76 | 0,0513 | -0,0056 | |||
| ZBRA / Zebra Technologies Corporation | 0,00 | 5,09 | 0,64 | -35,54 | 0,0493 | -0,0209 | |||
| REGN / Regeneron Pharmaceuticals, Inc. | 0,00 | 64,12 | 0,63 | 49,65 | 0,0485 | 0,0115 | |||
| ENPH / Enphase Energy, Inc. | 0,02 | 48,00 | 0,61 | 7,45 | 0,0465 | -0,0028 | |||
| OLED / Universal Display Corporation | 0,00 | -30,08 | 0,57 | -19,63 | 0,0436 | -0,0182 | |||
| SMCI / Super Micro Computer, Inc. | 0,01 | 0,57 | 0,0435 | 0,0435 | |||||
| GWRE / Guidewire Software, Inc. | 0,00 | 45,92 | 0,57 | 61,43 | 0,0433 | 0,0127 | |||
| HUBS / HubSpot, Inc. | 0,00 | -0,19 | 0,56 | -15,28 | 0,0429 | -0,0147 | |||
| MSI / Motorola Solutions, Inc. | 0,00 | 33,91 | 0,54 | 33,66 | 0,0417 | 0,0061 | |||
| FLUT / Flutter Entertainment plc | 0,00 | 0,53 | 0,0404 | 0,0404 | |||||
| LCID / Lucid Group, Inc. | 0,21 | 155,97 | 0,51 | 151,49 | 0,0390 | 0,0213 | |||
| ROKU / Roku, Inc. | 0,01 | 94,31 | 0,51 | 227,10 | 0,0389 | 0,0280 | |||
| TWLO / Twilio Inc. | 0,00 | -0,26 | 0,49 | 32,97 | 0,0377 | 0,0054 | |||
| GLOB / Globant S.A. | 0,01 | -0,27 | 0,49 | -28,57 | 0,0375 | -0,0223 | |||
| HPQ / HP Inc. | 0,02 | -0,26 | 0,49 | -3,17 | 0,0374 | -0,0067 | |||
| FITB / Fifth Third Bancorp | 0,01 | -47,39 | 0,47 | -49,95 | 0,0363 | -0,0414 | |||
| XP / XP Inc. | 0,03 | 128,99 | 0,47 | 130,39 | 0,0360 | 0,0181 | |||
| WBA / Walgreens Boots Alliance, Inc. | 0,04 | -49,88 | 0,46 | -74,19 | 0,0355 | -0,0967 | |||
| SPG / Simon Property Group, Inc. | 0,00 | -71,13 | 0,46 | -69,96 | 0,0349 | -0,0976 | |||
| AFG / American Financial Group, Inc. | 0,00 | -0,27 | 0,45 | -1,52 | 0,0348 | -0,0055 | |||
| LLYVK / Liberty Live Group | 0,01 | -0,26 | 0,44 | 17,46 | 0,0340 | 0,0010 | |||
| JCI / Johnson Controls International plc | 0,00 | -0,24 | 0,43 | 24,86 | 0,0331 | 0,0029 | |||
| GME / GameStop Corp. | 0,02 | 0,43 | 0,0326 | 0,0326 | |||||
| MPWR / Monolithic Power Systems, Inc. | 0,00 | -0,33 | 0,42 | 19,44 | 0,0325 | 0,0015 | |||
| RKLB / Rocket Lab Corporation | 0,01 | 0,41 | 0,0313 | 0,0313 | |||||
| PVH / PVH Corp. | 0,01 | -0,26 | 0,40 | 6,13 | 0,0305 | -0,0022 | |||
| LLYVA / Liberty Live Group | 0,00 | -0,25 | 0,40 | 16,81 | 0,0303 | 0,0007 | |||
| CMS / CMS Energy Corporation | 0,01 | 0,38 | 0,0290 | 0,0290 | |||||
| UAL / United Airlines Holdings, Inc. | 0,00 | -37,04 | 0,37 | -19,26 | 0,0283 | -0,0116 | |||
| AU / AngloGold Ashanti plc | 0,01 | 0,37 | 0,0283 | 0,0283 | |||||
| MTZ / MasTec, Inc. | 0,00 | -61,44 | 0,36 | -42,72 | 0,0278 | -0,0274 | |||
| LDOS / Leidos Holdings, Inc. | 0,00 | -75,29 | 0,36 | -57,93 | 0,0277 | -0,0233 | |||
| FLEX / Flex Ltd. | 0,01 | 0,36 | 0,0273 | 0,0273 | |||||
| KBR / KBR, Inc. | 0,01 | 0,35 | 0,0266 | 0,0266 | |||||
| FNF / Fidelity National Financial, Inc. | 0,01 | 0,33 | 0,0252 | 0,0252 | |||||
| TPL / Texas Pacific Land Corporation | 0,00 | 180,67 | 0,32 | 84,57 | 0,0248 | 0,0125 | |||
| CNC / Centene Corporation | 0,01 | -62,15 | 0,31 | -83,51 | 0,0238 | -0,1408 | |||
| FLS / Flowserve Corporation | 0,01 | -0,26 | 0,30 | 23,67 | 0,0233 | 0,0018 | |||
| IBKR / Interactive Brokers Group, Inc. | 0,00 | 300,54 | 0,29 | 52,91 | 0,0222 | 0,0056 | |||
| VNO / Vornado Realty Trust | 0,01 | -0,25 | 0,27 | 8,76 | 0,0209 | -0,0010 | |||
| FCX / Freeport-McMoRan Inc. | 0,01 | -66,06 | 0,27 | -61,93 | 0,0203 | -0,0335 | |||
| BURL / Burlington Stores, Inc. | 0,00 | -0,22 | 0,25 | 21,18 | 0,0188 | 0,0011 | |||
| CMG / Chipotle Mexican Grill, Inc. | 0,01 | 67,00 | 0,25 | 41,62 | 0,0188 | 0,0037 | |||
| COIN / Coinbase Global, Inc. | 0,00 | 0,24 | 0,0182 | 0,0182 | |||||
| S+P500 EMINI FUT SEP25 / DE (000000000) | 0,23 | 0,0179 | 0,0179 | ||||||
| MASI / Masimo Corporation | 0,00 | 0,22 | 0,0171 | 0,0171 | |||||
| WELL / Welltower Inc. | 0,00 | -0,29 | 0,22 | 8,25 | 0,0171 | -0,0010 | |||
| AM / Antero Midstream Corporation | 0,01 | -0,27 | 0,22 | 10,55 | 0,0169 | -0,0005 | |||
| CVNA / Carvana Co. | 0,00 | 0,22 | 0,0165 | 0,0165 | |||||
| GAP / The Gap, Inc. | 0,01 | -0,27 | 0,20 | -11,35 | 0,0156 | -0,0045 | |||
| SFM / Sprouts Farmers Market, Inc. | 0,00 | 0,20 | 0,0151 | 0,0151 | |||||
| LBTYA / Liberty Global Ltd. | 0,02 | -0,26 | 0,19 | -8,57 | 0,0147 | -0,0037 | |||
| FRT / Federal Realty Investment Trust | 0,00 | -90,09 | 0,19 | -90,33 | 0,0145 | -0,1552 | |||
| AIG / American International Group, Inc. | 0,00 | -37,04 | 0,18 | -33,57 | 0,0141 | -0,0074 | |||
| AFRM / Affirm Holdings, Inc. | 0,00 | 0,18 | 0,0135 | 0,0135 | |||||
| BWA / BorgWarner Inc. | 0,00 | -0,25 | 0,18 | 29,63 | 0,0134 | 0,0016 | |||
| SWK / Stanley Black & Decker, Inc. | 0,00 | 17,45 | 0,17 | -13,16 | 0,0127 | -0,0037 | |||
| IOT / Samsara Inc. | 0,00 | 0,15 | 0,0115 | 0,0115 | |||||
| RDDT / Reddit, Inc. | 0,00 | 0,15 | 0,0113 | 0,0113 | |||||
| ROK / Rockwell Automation, Inc. | 0,00 | -97,91 | 0,14 | -97,10 | 0,0110 | -0,3548 | |||
| MDB / MongoDB, Inc. | 0,00 | -45,63 | 0,14 | -64,07 | 0,0110 | -0,0170 | |||
| DG / Dollar General Corporation | 0,00 | 0,14 | 0,0109 | 0,0109 | |||||
| LYFT / Lyft, Inc. | 0,01 | 0,13 | 0,0103 | 0,0103 | |||||
| BPOP / Popular, Inc. | 0,00 | 0,13 | 0,0099 | 0,0099 | |||||
| EG / Everest Group, Ltd. | 0,00 | -96,99 | 0,12 | -97,38 | 0,0090 | -0,3224 | |||
| LULU / lululemon athletica inc. | 0,00 | 0,10 | 0,0073 | 0,0073 | |||||
| PARA / Paramount Global | 0,00 | 0,00 | 0,00 | 0,0000 | -0,0000 | ||||
| YETI / YETI Holdings, Inc. | 0,00 | 0,00 | 0,00 | 0,0000 | 0,0000 | ||||
| FYBR / Frontier Communications Parent, Inc. | 0,00 | 0,00 | 0,00 | 0,0000 | -0,0000 | ||||
| MKTX / MarketAxess Holdings Inc. | 0,00 | 0,00 | 0,00 | 0,0000 | -0,0000 | ||||
| PNFP / Pinnacle Financial Partners, Inc. | 0,00 | 0,00 | 0,00 | 0,0000 | -0,0000 | ||||
| IEX / IDEX Corporation | 0,00 | 0,00 | 0,00 | 0,0000 | -0,0000 | ||||
| FBHS / Fortune Brands Home & Security Inc | 0,00 | 0,00 | 0,00 | 0,0000 | -0,0000 | ||||
| BFB / Brown-Forman Corp. - Class B | 0,00 | 0,00 | 0,00 | 0,0000 | -0,0000 | ||||
| DXC / DXC Technology Company | 0,00 | 0,00 | 0,00 | 0,0000 | -0,0000 | ||||
| INGR / Ingredion Incorporated | 0,00 | 0,00 | 0,00 | 0,0000 | -0,0000 | ||||
| AGNC / AGNC Investment Corp. | 0,00 | 0,00 | 0,00 | 0,0000 | -0,0000 | ||||
| AZO / AutoZone, Inc. | 0,00 | -100,00 | 0,00 | -100,00 | -0,0184 | ||||
| SJM / The J. M. Smucker Company | 0,00 | -100,00 | 0,00 | -100,00 | -0,0144 |