Grundlæggende statistik
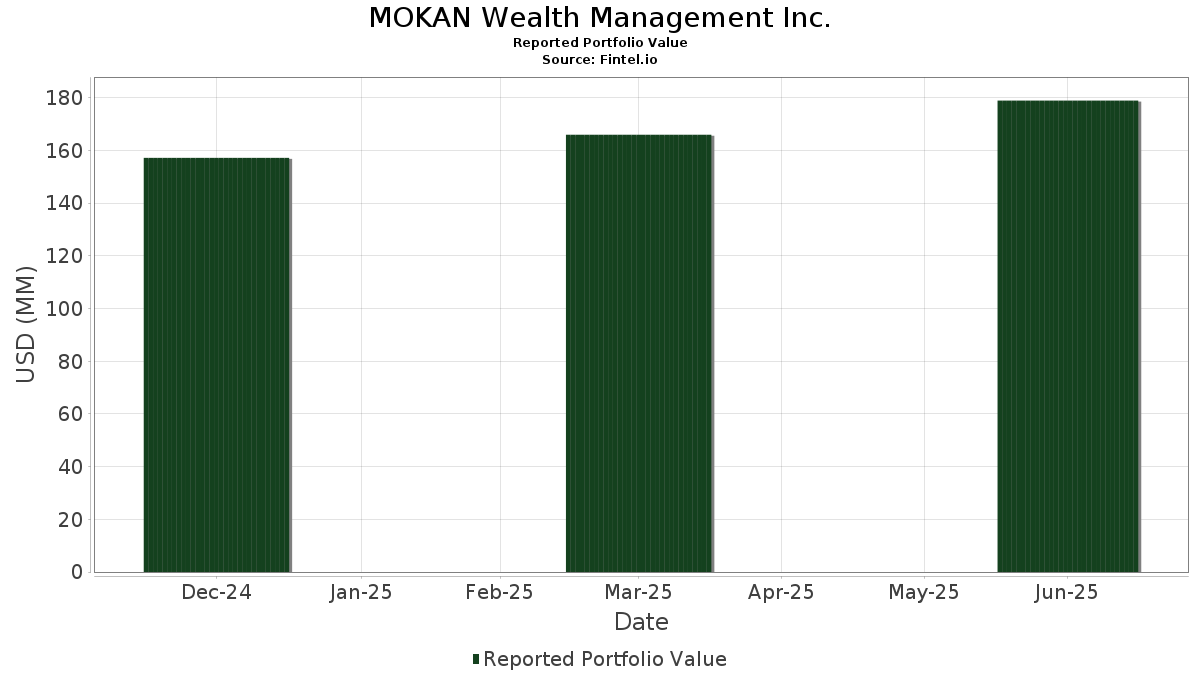
| Porteføljeværdi | $ 178.926.588 |
| Nuværende stillinger | 82 |
Seneste beholdninger, ydeevne, AUM (fra 13F, 13D)
MOKAN Wealth Management Inc. har afsløret 82 samlede besiddelser i deres seneste SEC-arkivering. Den seneste porteføljeværdi er beregnet til at være $ 178.926.588 USD. Faktiske aktiver under forvaltning (AUM) er denne værdi plus kontanter (som ikke er oplyst). MOKAN Wealth Management Inc.s største beholdninger er Vanguard Scottsdale Funds - Vanguard Short-Term Treasury ETF (US:VGSH) , SPDR Series Trust - SPDR Bloomberg 1-3 Month T-Bill ETF (US:BIL) , SPDR Series Trust - SPDR Bloomberg 3-12 Month T-Bill ETF (US:BILS) , Broadcom Inc. (US:AVGO) , and Vanguard World Fund - Vanguard Information Technology ETF (US:VGT) . MOKAN Wealth Management Inc.s nye stillinger omfatter Allegion plc (US:ALLE) , PulteGroup, Inc. (US:PHM) , PPG Industries, Inc. (US:PPG) , Avery Dennison Corporation (US:AVY) , and Conagra Brands, Inc. (US:CAG) .
Top øger dette kvartal
Vi bruger ændringen i porteføljeallokeringen, fordi dette er den mest meningsfulde metrik. Ændringer kan skyldes handler eller ændringer i aktiekurser.
| Sikkerhed | Aktier (MM) |
Værdi (MM$) |
Portefølje % | ΔPortefølje % |
|---|---|---|---|---|
| 0,03 | 7,71 | 4,3065 | 1,1278 | |
| 0,01 | 1,38 | 0,7731 | 0,7731 | |
| 0,01 | 1,37 | 0,7669 | 0,7669 | |
| 0,01 | 1,37 | 0,7634 | 0,7634 | |
| 0,01 | 1,31 | 0,7334 | 0,7334 | |
| 0,00 | 1,26 | 0,7058 | 0,7058 | |
| 0,02 | 3,29 | 1,8393 | 0,4717 | |
| 0,03 | 0,60 | 0,3350 | 0,3350 | |
| 0,06 | 4,70 | 2,6277 | 0,2035 | |
| 0,04 | 4,23 | 2,3668 | 0,1632 |
Top falder i dette kvartal
Vi bruger ændringen i porteføljeallokeringen, fordi dette er den mest meningsfulde metrik. Ændringer kan skyldes handler eller ændringer i aktiekurser.
| Sikkerhed | Aktier (MM) |
Værdi (MM$) |
Portefølje % | ΔPortefølje % |
|---|---|---|---|---|
| 0,05 | 4,09 | 2,2880 | -1,0374 | |
| 0,00 | 0,72 | 0,4009 | -0,7618 | |
| 0,01 | 4,03 | 2,2512 | -0,6667 | |
| 0,01 | 6,59 | 3,6824 | -0,6560 | |
| 0,01 | 0,75 | 0,4202 | -0,6074 | |
| 0,03 | 5,79 | 3,2352 | -0,4479 | |
| 0,01 | 6,81 | 3,8043 | -0,3585 | |
| 0,00 | 0,26 | 0,1427 | -0,2814 | |
| 0,02 | 3,16 | 1,7684 | -0,2301 | |
| 0,02 | 4,68 | 2,6129 | -0,2098 |
13F og Fondsarkivering
Denne formular blev indsendt den 2025-07-25 for rapporteringsperioden 2025-06-30. Klik på linkikonet for at se den fulde transaktionshistorik.
Opgrader for at låse op for premium-data og eksportere til Excel ![]() .
.
| Sikkerhed | Type | Gennemsnitlig aktiekurs | Aktier (MM) |
Δ Aktier (%) |
Δ Aktier (%) |
Værdi ($MM) |
Portefølje (%) |
ΔPortefølje (%) |
|
|---|---|---|---|---|---|---|---|---|---|
| VGSH / Vanguard Scottsdale Funds - Vanguard Short-Term Treasury ETF | 0,21 | 8,25 | 12,37 | 8,42 | 6,9146 | 0,0387 | |||
| BIL / SPDR Series Trust - SPDR Bloomberg 1-3 Month T-Bill ETF | 0,13 | 8,64 | 12,24 | 8,65 | 6,8420 | 0,0525 | |||
| BILS / SPDR Series Trust - SPDR Bloomberg 3-12 Month T-Bill ETF | 0,11 | 7,51 | 11,04 | 7,45 | 6,1724 | -0,0209 | |||
| AVGO / Broadcom Inc. | 0,03 | -11,32 | 7,71 | 46,07 | 4,3065 | 1,1278 | |||
| VGT / Vanguard World Fund - Vanguard Information Technology ETF | 0,01 | -19,44 | 6,81 | -1,48 | 3,8043 | -0,3585 | |||
| BRK.B / Berkshire Hathaway Inc. | 0,01 | 0,29 | 6,59 | -8,49 | 3,6824 | -0,6560 | |||
| MSFT / Microsoft Corporation | 0,01 | -19,47 | 6,01 | 6,64 | 3,3572 | -0,0367 | |||
| AAPL / Apple Inc. | 0,03 | 2,54 | 5,79 | -5,30 | 3,2352 | -0,4479 | |||
| MRK / Merck & Co., Inc. | 0,06 | 32,50 | 4,70 | 16,85 | 2,6277 | 0,2035 | |||
| AMZN / Amazon.com, Inc. | 0,02 | -13,40 | 4,68 | -0,19 | 2,6129 | -0,2098 | |||
| WMT / Walmart Inc. | 0,04 | 3,97 | 4,23 | 15,78 | 2,3668 | 0,1632 | |||
| COP / ConocoPhillips | 0,05 | -13,19 | 4,09 | -25,82 | 2,2880 | -1,0374 | |||
| VUG / Vanguard Index Funds - Vanguard Growth ETF | 0,01 | -29,64 | 4,03 | -16,83 | 2,2512 | -0,6667 | |||
| SCHD / Schwab Strategic Trust - Schwab U.S. Dividend Equity ETF | 0,15 | 4,86 | 4,00 | -0,62 | 2,2330 | -0,1893 | |||
| MCD / McDonald's Corporation | 0,01 | 8,70 | 3,47 | 1,64 | 1,9408 | -0,1177 | |||
| ABBV / AbbVie Inc. | 0,02 | 21,49 | 3,40 | 7,64 | 1,8981 | -0,0031 | |||
| NVDA / NVIDIA Corporation | 0,02 | -0,54 | 3,29 | 45,04 | 1,8393 | 0,4717 | |||
| GOOG / Alphabet Inc. | 0,02 | -15,94 | 3,16 | -4,58 | 1,7684 | -0,2301 | |||
| ABT / Abbott Laboratories | 0,02 | 11,94 | 2,99 | 14,77 | 1,6726 | 0,1012 | |||
| COST / Costco Wholesale Corporation | 0,00 | 9,10 | 2,85 | 13,89 | 1,5902 | 0,0847 | |||
| UNH / UnitedHealth Group Incorporated | 0,01 | 63,87 | 2,74 | -2,32 | 1,5319 | -0,1593 | |||
| GJR / Strats Trust For Procter & Gambel Security - Preferred Security | 0,02 | 13,70 | 2,44 | 6,36 | 1,3648 | -0,0191 | |||
| HD / The Home Depot, Inc. | 0,01 | 13,22 | 2,35 | 13,11 | 1,3121 | 0,0615 | |||
| JNJ / Johnson & Johnson | 0,01 | 18,96 | 2,16 | 9,61 | 1,2051 | 0,0197 | |||
| EOG / EOG Resources, Inc. | 0,02 | 20,45 | 2,15 | 12,31 | 1,2034 | 0,0483 | |||
| GILD / Gilead Sciences, Inc. | 0,02 | 18,87 | 2,15 | 17,60 | 1,1993 | 0,1002 | |||
| CBOE / Cboe Global Markets, Inc. | 0,01 | 4,74 | 2,13 | 7,84 | 1,1917 | -0,0000 | |||
| HSY / The Hershey Company | 0,01 | 20,05 | 2,11 | 16,48 | 1,1809 | 0,0876 | |||
| PEP / PepsiCo, Inc. | 0,02 | 30,36 | 2,09 | 14,84 | 1,1677 | 0,0714 | |||
| VTV / Vanguard Index Funds - Vanguard Value ETF | 0,01 | 10,84 | 2,04 | 13,37 | 1,1422 | 0,0560 | |||
| SNA / Snap-on Incorporated | 0,01 | 15,00 | 2,01 | 6,34 | 1,1257 | -0,0160 | |||
| VIG / Vanguard Specialized Funds - Vanguard Dividend Appreciation ETF | 0,01 | 9,47 | 1,72 | 15,49 | 0,9627 | 0,0639 | |||
| QCOM / QUALCOMM Incorporated | 0,01 | 14,93 | 1,51 | 19,16 | 0,8449 | 0,0803 | |||
| YUM / Yum! Brands, Inc. | 0,01 | 21,57 | 1,45 | 14,55 | 0,8101 | 0,0478 | |||
| V / Visa Inc. | 0,00 | 7,02 | 1,45 | 8,56 | 0,8078 | 0,0053 | |||
| EXPD / Expeditors International of Washington, Inc. | 0,01 | 17,45 | 1,44 | 11,66 | 0,8027 | 0,0277 | |||
| MA / Mastercard Incorporated | 0,00 | 6,27 | 1,42 | 8,92 | 0,7918 | 0,0084 | |||
| ITW / Illinois Tool Works Inc. | 0,01 | 15,66 | 1,41 | 15,25 | 0,7901 | 0,0513 | |||
| ALLE / Allegion plc | 0,01 | 1,38 | 0,7731 | 0,7731 | |||||
| PHM / PulteGroup, Inc. | 0,01 | 1,37 | 0,7669 | 0,7669 | |||||
| PPG / PPG Industries, Inc. | 0,01 | 1,37 | 0,7634 | 0,7634 | |||||
| AON / Aon plc | 0,00 | 20,35 | 1,32 | 7,47 | 0,7402 | -0,0027 | |||
| AVY / Avery Dennison Corporation | 0,01 | 1,31 | 0,7334 | 0,7334 | |||||
| PAYX / Paychex, Inc. | 0,01 | 7,26 | 1,30 | 1,17 | 0,7264 | -0,0474 | |||
| ACN / Accenture plc | 0,00 | 1,26 | 0,7058 | 0,7058 | |||||
| ZTS / Zoetis Inc. | 0,01 | 10,23 | 1,24 | 4,39 | 0,6908 | -0,0227 | |||
| VOO / Vanguard Index Funds - Vanguard S&P 500 ETF | 0,00 | 17,24 | 1,22 | 29,48 | 0,6825 | 0,1137 | |||
| GOOGL / Alphabet Inc. | 0,01 | 2,68 | 1,14 | 16,92 | 0,6374 | 0,0496 | |||
| VYM / Vanguard Whitehall Funds - Vanguard High Dividend Yield ETF | 0,01 | 4,38 | 0,96 | 7,97 | 0,5378 | 0,0004 | |||
| RTX / RTX Corporation | 0,01 | -0,40 | 0,87 | 9,75 | 0,4850 | 0,0088 | |||
| CSCO / Cisco Systems, Inc. | 0,01 | 9,15 | 0,78 | 22,71 | 0,4350 | 0,0529 | |||
| LMT / Lockheed Martin Corporation | 0,00 | 5,28 | 0,77 | 8,97 | 0,4278 | 0,0045 | |||
| TROW / T. Rowe Price Group, Inc. | 0,01 | -58,07 | 0,75 | -55,95 | 0,4202 | -0,6074 | |||
| CME / CME Group Inc. | 0,00 | -64,21 | 0,72 | -62,83 | 0,4009 | -0,7618 | |||
| VZ / Verizon Communications Inc. | 0,02 | 9,35 | 0,71 | 4,41 | 0,3975 | -0,0132 | |||
| DGX / Quest Diagnostics Incorporated | 0,00 | 13,50 | 0,69 | 20,60 | 0,3834 | 0,0408 | |||
| VICI / VICI Properties Inc. | 0,02 | 14,93 | 0,68 | 14,86 | 0,3806 | 0,0233 | |||
| USB / U.S. Bancorp | 0,01 | 13,22 | 0,68 | 21,33 | 0,3789 | 0,0423 | |||
| FOXA / Fox Corporation | 0,01 | 14,74 | 0,67 | 13,68 | 0,3764 | 0,0191 | |||
| CL / Colgate-Palmolive Company | 0,01 | 14,69 | 0,67 | 11,33 | 0,3734 | 0,0115 | |||
| KMB / Kimberly-Clark Corporation | 0,01 | 13,74 | 0,66 | 2,96 | 0,3692 | -0,0172 | |||
| CF / CF Industries Holdings, Inc. | 0,01 | -7,35 | 0,66 | 9,27 | 0,3689 | 0,0047 | |||
| MO / Altria Group, Inc. | 0,01 | 6,92 | 0,66 | 4,44 | 0,3680 | -0,0119 | |||
| GIS / General Mills, Inc. | 0,01 | 26,25 | 0,65 | 9,40 | 0,3647 | 0,0052 | |||
| XOM / Exxon Mobil Corporation | 0,01 | 5,34 | 0,62 | -4,60 | 0,3481 | -0,0449 | |||
| CAG / Conagra Brands, Inc. | 0,03 | 0,60 | 0,3350 | 0,3350 | |||||
| KO / The Coca-Cola Company | 0,01 | 0,26 | 0,59 | -1,01 | 0,3308 | -0,0292 | |||
| TSLA / Tesla, Inc. | 0,00 | 4,71 | 0,54 | 28,37 | 0,3039 | 0,0485 | |||
| TMUS / T-Mobile US, Inc. | 0,00 | 0,40 | 0,48 | -10,45 | 0,2688 | -0,0544 | |||
| HRB / H&R Block, Inc. | 0,01 | 0,67 | 0,34 | 0,59 | 0,1902 | -0,0136 | |||
| NEE / NextEra Energy, Inc. | 0,00 | -0,38 | 0,33 | -2,40 | 0,1827 | -0,0191 | |||
| VXUS / Vanguard STAR Funds - Vanguard Total International Stock ETF | 0,00 | 0,71 | 0,28 | 12,30 | 0,1583 | 0,0060 | |||
| META / Meta Platforms, Inc. | 0,00 | 2,43 | 0,28 | 31,46 | 0,1570 | 0,0281 | |||
| CVX / Chevron Corporation | 0,00 | 3,77 | 0,27 | -11,11 | 0,1521 | -0,0325 | |||
| PANW / Palo Alto Networks, Inc. | 0,00 | 8,23 | 0,27 | 30,14 | 0,1521 | 0,0257 | |||
| CRH / CRH plc | 0,00 | -65,24 | 0,26 | -63,73 | 0,1427 | -0,2814 | |||
| LOW / Lowe's Companies, Inc. | 0,00 | 19,04 | 0,24 | 13,08 | 0,1357 | 0,0066 | |||
| BA / The Boeing Company | 0,00 | 0,24 | 0,1355 | 0,1355 | |||||
| PM / Philip Morris International Inc. | 0,00 | 0,23 | 0,1259 | 0,1259 | |||||
| JBL / Jabil Inc. | 0,00 | 0,22 | 0,1227 | 0,1227 | |||||
| DY / Dycom Industries, Inc. | 0,00 | 0,21 | 0,1198 | 0,1198 | |||||
| FLEX / Flex Ltd. | 0,00 | 0,20 | 0,1124 | 0,1124 | |||||
| MDLZ / Mondelez International, Inc. | 0,00 | -100,00 | 0,00 | 0,0000 | |||||
| BLK / BlackRock, Inc. | 0,00 | -100,00 | 0,00 | 0,0000 | |||||
| DVN / Devon Energy Corporation | 0,00 | -100,00 | 0,00 | 0,0000 |