Grundlæggende statistik
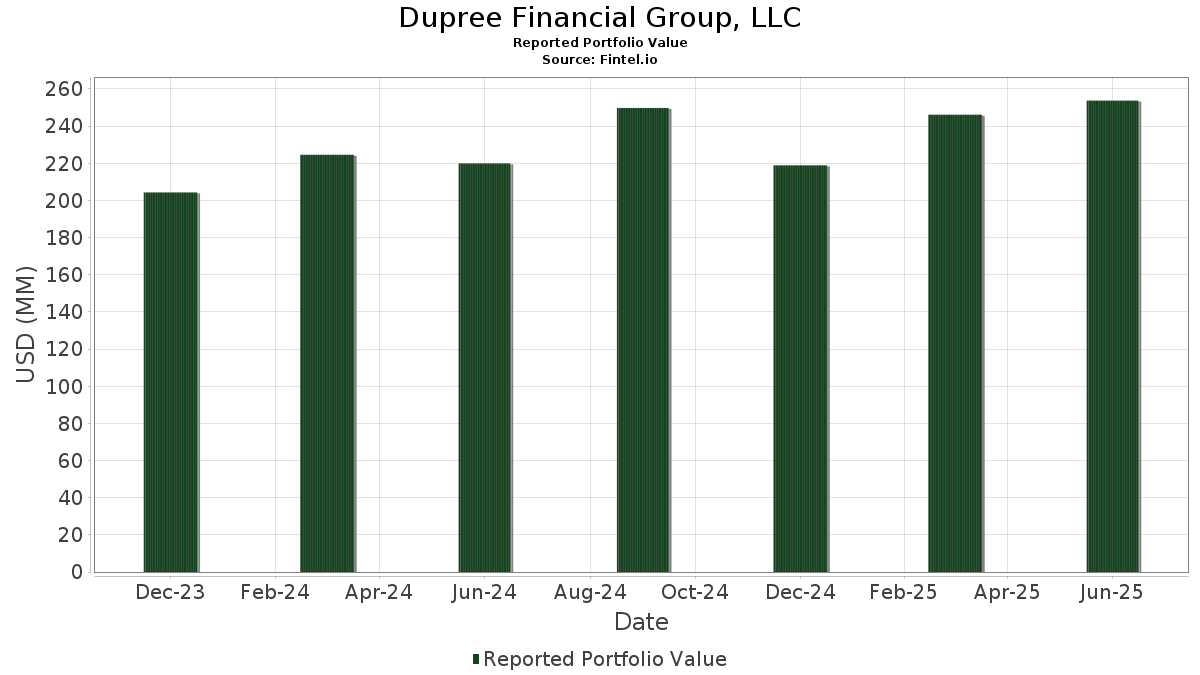
| Porteføljeværdi | $ 253.768.923 |
| Nuværende stillinger | 69 |
Seneste beholdninger, ydeevne, AUM (fra 13F, 13D)
Dupree Financial Group, LLC har afsløret 69 samlede besiddelser i deres seneste SEC-arkivering. Den seneste porteføljeværdi er beregnet til at være $ 253.768.923 USD. Faktiske aktiver under forvaltning (AUM) er denne værdi plus kontanter (som ikke er oplyst). Dupree Financial Group, LLCs største beholdninger er AGNC Investment Corp. (US:AGNC) , Enbridge Inc. - Preferred Stock (US:EBGEF) , British American Tobacco p.l.c. - Depositary Receipt (Common Stock) (US:BTI) , Kinder Morgan, Inc. (US:KMI) , and Cincinnati Financial Corporation (US:CINF) . Dupree Financial Group, LLCs nye stillinger omfatter Synchrony Financial (US:SYF) , Macy's, Inc. (US:M) , Meta Platforms, Inc. (US:META) , UnitedHealth Group Incorporated (US:UNH) , and Diamondback Energy, Inc. (US:FANG) .
Top øger dette kvartal
Vi bruger ændringen i porteføljeallokeringen, fordi dette er den mest meningsfulde metrik. Ændringer kan skyldes handler eller ændringer i aktiekurser.
| Sikkerhed | Aktier (MM) |
Værdi (MM$) |
Portefølje % | ΔPortefølje % |
|---|---|---|---|---|
| 0,39 | 11,38 | 4,4828 | 4,4828 | |
| 0,11 | 7,10 | 2,7980 | 2,7980 | |
| 0,52 | 6,12 | 2,4097 | 2,4097 | |
| 0,06 | 7,03 | 2,0323 | 2,0323 | |
| 0,01 | 4,29 | 1,6919 | 1,6919 | |
| 0,01 | 3,08 | 1,2121 | 1,2121 | |
| 0,02 | 2,92 | 1,1501 | 1,1501 | |
| 0,02 | 2,71 | 1,0667 | 1,0667 | |
| 0,02 | 5,92 | 1,7120 | 0,5610 | |
| 0,02 | 7,28 | 2,1048 | 0,5465 |
Top falder i dette kvartal
Vi bruger ændringen i porteføljeallokeringen, fordi dette er den mest meningsfulde metrik. Ændringer kan skyldes handler eller ændringer i aktiekurser.
| Sikkerhed | Aktier (MM) |
Værdi (MM$) |
Portefølje % | ΔPortefølje % |
|---|---|---|---|---|
| 0,33 | 15,06 | 4,3542 | -2,9983 | |
| 0,31 | 14,91 | 4,3107 | -2,3014 | |
| 0,22 | 9,66 | 2,7941 | -2,1973 | |
| 0,13 | 4,16 | 1,2028 | -1,9990 | |
| 0,12 | 6,89 | 1,9931 | -1,4467 | |
| 0,05 | 7,28 | 2,1053 | -1,4123 | |
| 0,24 | 6,10 | 1,7634 | -1,1333 | |
| 0,08 | 5,21 | 1,5054 | -1,1050 | |
| 0,00 | 9,74 | 3,8375 | -0,9997 | |
| 0,21 | 8,14 | 2,3532 | -0,9835 |
13F og Fondsarkivering
Denne formular blev indsendt den 2025-07-30 for rapporteringsperioden 2025-06-30. Klik på linkikonet for at se den fulde transaktionshistorik.
Opgrader for at låse op for premium-data og eksportere til Excel ![]() .
.
| Sikkerhed | Type | Gennemsnitlig aktiekurs | Aktier (MM) |
Δ Aktier (%) |
Δ Aktier (%) |
Værdi ($MM) |
Portefølje (%) |
ΔPortefølje (%) |
|
|---|---|---|---|---|---|---|---|---|---|
| AGNC / AGNC Investment Corp. | 2,21 | 9,87 | 20,35 | 5,39 | 8,0179 | 0,1758 | |||
| EBGEF / Enbridge Inc. - Preferred Stock | 0,33 | -18,66 | 15,06 | -16,81 | 4,3542 | -2,9983 | |||
| BTI / British American Tobacco p.l.c. - Depositary Receipt (Common Stock) | 0,31 | -19,95 | 14,91 | -8,42 | 4,3107 | -2,3014 | |||
| KMI / Kinder Morgan, Inc. | 0,39 | 11,38 | 4,4828 | 4,4828 | |||||
| CINF / Cincinnati Financial Corporation | 0,08 | 43,31 | 11,30 | 44,48 | 3,2689 | 0,0904 | |||
| MELI / MercadoLibre, Inc. | 0,00 | -38,96 | 9,74 | -18,22 | 3,8375 | -0,9997 | |||
| VZ / Verizon Communications Inc. | 0,22 | -17,56 | 9,66 | -21,36 | 2,7941 | -2,1973 | |||
| ORI / Old Republic International Corporation | 0,21 | 1,08 | 8,14 | -0,94 | 2,3532 | -0,9835 | |||
| CVX / Chevron Corporation | 0,05 | -1,77 | 7,28 | -15,93 | 2,1053 | -1,4123 | |||
| CMI / Cummins Inc. | 0,02 | 81,60 | 7,28 | 89,75 | 2,1048 | 0,5465 | |||
| SYF / Synchrony Financial | 0,11 | 7,10 | 2,7980 | 2,7980 | |||||
| EOG / EOG Resources, Inc. | 0,06 | 7,03 | 2,0323 | 2,0323 | |||||
| O / Realty Income Corporation | 0,12 | -18,04 | 6,89 | -18,60 | 1,9931 | -1,4467 | |||
| M / Macy's, Inc. | 0,52 | 6,12 | 2,4097 | 2,4097 | |||||
| KHC / The Kraft Heinz Company | 0,24 | 0,79 | 6,10 | -14,47 | 1,7634 | -1,1333 | |||
| NLY / Annaly Capital Management, Inc. | 0,32 | -1,23 | 5,94 | -8,48 | 1,7167 | -0,9182 | |||
| ITW / Illinois Tool Works Inc. | 0,02 | 109,58 | 5,92 | 108,97 | 1,7120 | 0,5610 | |||
| BP / BP p.l.c. - Depositary Receipt (Common Stock) | 0,19 | 110,70 | 5,65 | 86,64 | 1,6328 | 0,4037 | |||
| BXMT / Blackstone Mortgage Trust, Inc. | 0,29 | 3,52 | 5,55 | -0,38 | 1,6043 | -0,6576 | |||
| ASO / Academy Sports and Outdoors, Inc. | 0,12 | 103,07 | 5,53 | 99,53 | 1,5983 | 0,4729 | |||
| DHI / D.R. Horton, Inc. | 0,04 | 0,73 | 5,35 | 2,16 | 1,5456 | -0,5801 | |||
| WPC / W. P. Carey Inc. | 0,08 | -18,04 | 5,21 | -19,00 | 1,5054 | -1,1050 | |||
| T / AT&T Inc. | 0,17 | -20,63 | 5,03 | -18,80 | 1,9821 | -0,5336 | |||
| TSM / Taiwan Semiconductor Manufacturing Company Limited - Depositary Receipt (Common Stock) | 0,02 | -1,53 | 4,44 | 34,38 | 1,7481 | 0,4069 | |||
| META / Meta Platforms, Inc. | 0,01 | 4,29 | 1,6919 | 1,6919 | |||||
| CNQ / Canadian Natural Resources Limited | 0,13 | -48,24 | 4,16 | -47,23 | 1,2028 | -1,9990 | |||
| AAPL / Apple Inc. | 0,02 | -2,94 | 3,86 | -10,36 | 1,5214 | -0,2280 | |||
| BRK.B / Berkshire Hathaway Inc. | 0,01 | -5,04 | 3,73 | -13,39 | 1,0774 | -0,6700 | |||
| VIG / Vanguard Specialized Funds - Vanguard Dividend Appreciation ETF | 0,02 | -0,56 | 3,46 | 4,95 | 1,0003 | -0,3390 | |||
| BEN / Franklin Resources, Inc. | 0,14 | -0,67 | 3,24 | 23,09 | 0,9372 | -0,1326 | |||
| UNH / UnitedHealth Group Incorporated | 0,01 | 3,08 | 1,2121 | 1,2121 | |||||
| CAVA / CAVA Group, Inc. | 0,03 | 70,45 | 2,94 | 66,14 | 0,8514 | 0,1315 | |||
| FANG / Diamondback Energy, Inc. | 0,02 | 2,92 | 1,1501 | 1,1501 | |||||
| PLTR / Palantir Technologies Inc. | 0,02 | 2,71 | 1,0667 | 1,0667 | |||||
| AMZN / Amazon.com, Inc. | 0,01 | -2,53 | 2,44 | 12,40 | 0,9611 | 0,0796 | |||
| ANF / Abercrombie & Fitch Co. | 0,02 | 1,14 | 1,68 | 9,73 | 0,6626 | 0,0401 | |||
| FNDF / Schwab Strategic Trust - Schwab Fundamental International Equity ETF | 0,04 | -7,63 | 1,59 | 2,32 | 0,4595 | -0,1716 | |||
| RSP / Invesco Exchange-Traded Fund Trust - Invesco S&P 500 Equal Weight ETF | 0,01 | -3,00 | 1,40 | 1,81 | 0,4057 | -0,1543 | |||
| XOM / Exxon Mobil Corporation | 0,01 | -7,48 | 1,12 | -16,12 | 0,3237 | -0,2185 | |||
| MSFT / Microsoft Corporation | 0,00 | 25,49 | 1,01 | 66,28 | 0,3985 | 0,1515 | |||
| VOO / Vanguard Index Funds - Vanguard S&P 500 ETF | 0,00 | -1,27 | 0,92 | 9,09 | 0,2674 | -0,0768 | |||
| DVY / iShares Trust - iShares Select Dividend ETF | 0,01 | -2,13 | 0,80 | -3,16 | 0,2309 | -0,1042 | |||
| SPHQ / Invesco Exchange-Traded Fund Trust - Invesco S&P 500 Quality ETF | 0,01 | -1,41 | 0,78 | 5,95 | 0,2268 | -0,0740 | |||
| JPM / JPMorgan Chase & Co. | 0,00 | 0,00 | 0,74 | 18,33 | 0,2901 | 0,0371 | |||
| GJR / Strats Trust For Procter & Gambel Security - Preferred Security | 0,00 | 27,80 | 0,67 | 19,57 | 0,1944 | -0,0342 | |||
| FBND / Fidelity Merrimack Street Trust - Fidelity Total Bond ETF | 0,01 | -1,55 | 0,65 | -1,36 | 0,1894 | -0,0803 | |||
| IJR / iShares Trust - iShares Core S&P Small-Cap ETF | 0,01 | -2,54 | 0,65 | 1,87 | 0,1894 | -0,0718 | |||
| CSX / CSX Corporation | 0,02 | 0,00 | 0,60 | 11,05 | 0,1744 | -0,0466 | |||
| BYON / Beyond, Inc. | 0,09 | -1,22 | 0,59 | 17,30 | 0,1708 | -0,0340 | |||
| GE / General Electric Company | 0,00 | 2,39 | 0,50 | 31,91 | 0,1435 | -0,0096 | |||
| GNR / SPDR Index Shares Funds - SPDR S&P Global Natural Resources ETF | 0,01 | -1,71 | 0,49 | 0,00 | 0,1419 | -0,0572 | |||
| LLY / Eli Lilly and Company | 0,00 | 4,99 | 0,48 | -0,84 | 0,1874 | -0,0075 | |||
| NFLX / Netflix, Inc. | 0,00 | 0,00 | 0,47 | 43,64 | 0,1868 | 0,0527 | |||
| HD / The Home Depot, Inc. | 0,00 | 0,00 | 0,44 | 0,00 | 0,1277 | -0,0516 | |||
| NVDA / NVIDIA Corporation | 0,00 | 0,40 | 0,1596 | 0,1596 | |||||
| IGV / iShares Trust - iShares Expanded Tech-Software Sector ETF | 0,00 | -1,07 | 0,39 | 22,05 | 0,1136 | -0,0175 | |||
| MMM / 3M Company | 0,00 | -8,05 | 0,39 | -4,85 | 0,1136 | -0,0538 | |||
| PEP / PepsiCo, Inc. | 0,00 | 0,00 | 0,39 | -11,99 | 0,1534 | -0,0262 | |||
| MRK / Merck & Co., Inc. | 0,00 | -0,44 | 0,38 | -12,38 | 0,1087 | -0,0652 | |||
| DFAR / Dimensional ETF Trust - Dimensional US Real Estate ETF | 0,01 | -3,18 | 0,35 | -4,41 | 0,1005 | -0,0473 | |||
| AVGO / Broadcom Inc. | 0,00 | -5,91 | 0,33 | 55,50 | 0,1281 | 0,0429 | |||
| GEV / GE Vernova Inc. | 0,00 | 0,25 | 0,0997 | 0,0997 | |||||
| SR / Spire Inc. | 0,00 | 0,00 | 0,25 | -6,79 | 0,0975 | -0,0103 | |||
| KO / The Coca-Cola Company | 0,00 | -4,06 | 0,23 | -4,98 | 0,0663 | -0,0320 | |||
| IBM / International Business Machines Corporation | 0,00 | -35,03 | 0,23 | -22,95 | 0,0651 | -0,0537 | |||
| IVV / iShares Trust - iShares Core S&P 500 ETF | 0,00 | -13,59 | 0,22 | -4,33 | 0,0640 | -0,0300 | |||
| PZZA / Papa John's International, Inc. | 0,00 | 0,21 | 0,0599 | 0,0599 | |||||
| COST / Costco Wholesale Corporation | 0,00 | -25,54 | 0,21 | -22,05 | 0,0809 | -0,0260 | |||
| WMT / Walmart Inc. | 0,00 | 0,20 | 0,0799 | 0,0799 | |||||
| WBD / Warner Bros. Discovery, Inc. | 0,00 | -100,00 | 0,00 | 0,0000 | |||||
| TSLA / Tesla, Inc. | 0,00 | -100,00 | 0,00 | 0,0000 | |||||
| EG / Everest Group, Ltd. | 0,00 | -100,00 | 0,00 | 0,0000 | |||||
| UPS / United Parcel Service, Inc. | 0,00 | -100,00 | 0,00 | 0,0000 | |||||
| HUM / Humana Inc. | 0,00 | -100,00 | 0,00 | 0,0000 | |||||
| VVV / Valvoline Inc. | 0,00 | -100,00 | 0,00 | 0,0000 | |||||
| ONL / Orion Properties Inc. | 0,00 | -100,00 | 0,00 | 0,0000 | |||||
| CHCO / City Holding Company | 0,00 | -100,00 | 0,00 | 0,0000 | |||||
| EP.PRC / El Paso Energy Capital Trust I - Preferred Security | 0,00 | -100,00 | 0,00 | 0,0000 | |||||
| MPC / Marathon Petroleum Corporation | 0,00 | -100,00 | 0,00 | 0,0000 | |||||
| MBI / MBIA Inc. | 0,00 | -100,00 | 0,00 | 0,0000 | |||||
| RDDT / Reddit, Inc. | 0,00 | -100,00 | 0,00 | -100,00 | -0,5975 | ||||
| KIRK / Kirkland's, Inc. | 0,00 | -100,00 | 0,00 | 0,0000 |