Grundlæggende statistik
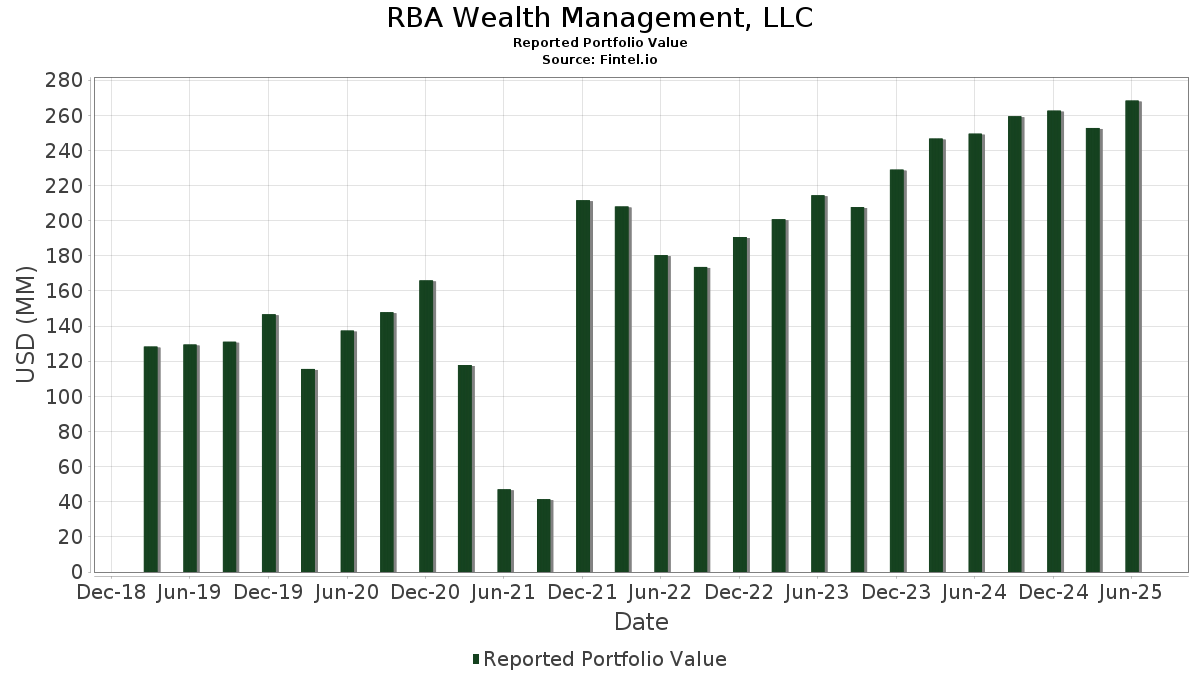
| Porteføljeværdi | $ 268.384.663 |
| Nuværende stillinger | 93 |
Seneste beholdninger, ydeevne, AUM (fra 13F, 13D)
RBA Wealth Management, LLC har afsløret 93 samlede besiddelser i deres seneste SEC-arkivering. Den seneste porteføljeværdi er beregnet til at være $ 268.384.663 USD. Faktiske aktiver under forvaltning (AUM) er denne værdi plus kontanter (som ikke er oplyst). RBA Wealth Management, LLCs største beholdninger er Microsoft Corporation (US:MSFT) , Broadcom Inc. (US:AVGO) , Apple Inc. (US:AAPL) , Alphabet Inc. (US:GOOGL) , and Visa Inc. (US:V) . RBA Wealth Management, LLCs nye stillinger omfatter Ingredion Incorporated (US:INGR) , NRG Energy, Inc. (US:NRG) , .
Top øger dette kvartal
Vi bruger ændringen i porteføljeallokeringen, fordi dette er den mest meningsfulde metrik. Ændringer kan skyldes handler eller ændringer i aktiekurser.
| Sikkerhed | Aktier (MM) |
Værdi (MM$) |
Portefølje % | ΔPortefølje % |
|---|---|---|---|---|
| 0,01 | 5,64 | 2,1016 | 2,1016 | |
| 0,03 | 8,97 | 3,3419 | 1,1394 | |
| 0,02 | 2,80 | 1,0429 | 1,0429 | |
| 0,01 | 2,33 | 0,8686 | 0,8686 | |
| 0,02 | 10,03 | 3,7384 | 0,6747 | |
| 0,01 | 6,97 | 2,5982 | 0,5139 | |
| 0,02 | 5,20 | 1,9392 | 0,4448 | |
| 0,03 | 5,21 | 1,9400 | 0,3402 | |
| 0,01 | 5,34 | 1,9911 | 0,2949 | |
| 0,01 | 5,93 | 2,2078 | 0,2927 |
Top falder i dette kvartal
Vi bruger ændringen i porteføljeallokeringen, fordi dette er den mest meningsfulde metrik. Ændringer kan skyldes handler eller ændringer i aktiekurser.
| Sikkerhed | Aktier (MM) |
Værdi (MM$) |
Portefølje % | ΔPortefølje % |
|---|---|---|---|---|
| 0,01 | 0,60 | 0,2222 | -1,7863 | |
| 0,00 | 5,69 | 2,1204 | -1,4317 | |
| 0,02 | 3,98 | 1,4835 | -0,5057 | |
| 0,04 | 8,65 | 3,2236 | -0,4469 | |
| 0,00 | 1,03 | 0,3839 | -0,4380 | |
| 0,02 | 5,11 | 1,9041 | -0,3341 | |
| 0,02 | 3,98 | 1,4844 | -0,3234 | |
| 0,06 | 5,91 | 2,2007 | -0,2987 | |
| 0,02 | 4,59 | 1,7088 | -0,2464 | |
| 0,02 | 7,61 | 2,8344 | -0,2374 |
13F og Fondsarkivering
Denne formular blev indsendt den 2025-07-17 for rapporteringsperioden 2025-06-30. Klik på linkikonet for at se den fulde transaktionshistorik.
Opgrader for at låse op for premium-data og eksportere til Excel ![]() .
.
| Sikkerhed | Type | Gennemsnitlig aktiekurs | Aktier (MM) |
Δ Aktier (%) |
Δ Aktier (%) |
Værdi ($MM) |
Portefølje (%) |
ΔPortefølje (%) |
|
|---|---|---|---|---|---|---|---|---|---|
| MSFT / Microsoft Corporation | 0,02 | -2,23 | 10,03 | 29,56 | 3,7384 | 0,6747 | |||
| AVGO / Broadcom Inc. | 0,03 | -2,15 | 8,97 | 61,11 | 3,3419 | 1,1394 | |||
| AAPL / Apple Inc. | 0,04 | 0,96 | 8,65 | -6,76 | 3,2236 | -0,4469 | |||
| GOOGL / Alphabet Inc. | 0,05 | -1,02 | 8,27 | 12,80 | 3,0827 | 0,1811 | |||
| V / Visa Inc. | 0,02 | -3,30 | 7,61 | -2,02 | 2,8344 | -0,2374 | |||
| WM / Waste Management, Inc. | 0,03 | -0,54 | 7,25 | -1,70 | 2,7002 | -0,2161 | |||
| META / Meta Platforms, Inc. | 0,01 | 3,36 | 6,97 | 32,37 | 2,5982 | 0,5139 | |||
| CMI / Cummins Inc. | 0,02 | 0,02 | 6,81 | 4,51 | 2,5384 | -0,0403 | |||
| BSX / Boston Scientific Corporation | 0,06 | -5,26 | 6,80 | 0,88 | 2,5336 | -0,1330 | |||
| MET / MetLife, Inc. | 0,08 | 0,15 | 6,24 | 0,32 | 2,3258 | -0,1359 | |||
| EWBC / East West Bancorp, Inc. | 0,06 | 1,53 | 6,18 | 14,21 | 2,3029 | 0,1623 | |||
| SNPS / Synopsys, Inc. | 0,01 | 0,15 | 5,93 | 19,73 | 2,2111 | 0,2503 | |||
| ASML / ASML Holding N.V. - Depositary Receipt (Common Stock) | 0,01 | 1,20 | 5,93 | 22,39 | 2,2078 | 0,2927 | |||
| ACGL / Arch Capital Group Ltd. | 0,06 | -1,25 | 5,91 | -6,51 | 2,2007 | -0,2987 | |||
| CBOE / Cboe Global Markets, Inc. | 0,03 | 4,55 | 5,86 | 7,73 | 2,1852 | 0,0319 | |||
| AZO / AutoZone, Inc. | 0,00 | -34,90 | 5,69 | -36,63 | 2,1204 | -1,4317 | |||
| GSCE / GS Connect S&P GSCI Enhanced Commodity Total Return ETN | 0,01 | 5,64 | 2,1016 | 2,1016 | |||||
| URI / United Rentals, Inc. | 0,01 | 3,67 | 5,34 | 24,63 | 1,9911 | 0,2949 | |||
| AMAT / Applied Materials, Inc. | 0,03 | 2,06 | 5,21 | 28,77 | 1,9400 | 0,3402 | |||
| TSM / Taiwan Semiconductor Manufacturing Company Limited - Depositary Receipt (Common Stock) | 0,02 | 0,98 | 5,20 | 37,78 | 1,9392 | 0,4448 | |||
| TMUS / T-Mobile US, Inc. | 0,02 | 1,11 | 5,11 | -9,67 | 1,9041 | -0,3341 | |||
| HD / The Home Depot, Inc. | 0,01 | 0,46 | 5,01 | 0,50 | 1,8651 | -0,1053 | |||
| AEP / American Electric Power Company, Inc. | 0,05 | 1,55 | 4,96 | -3,58 | 1,8489 | -0,1868 | |||
| QCOM / QUALCOMM Incorporated | 0,03 | 0,75 | 4,91 | 4,45 | 1,8288 | -0,0301 | |||
| GJR / Strats Trust For Procter & Gambel Security - Preferred Security | 0,03 | 1,77 | 4,86 | -4,86 | 1,8105 | -0,2099 | |||
| MDT / Medtronic plc | 0,05 | 1,30 | 4,65 | -1,75 | 1,7329 | -0,1394 | |||
| CRM / Salesforce, Inc. | 0,02 | 0,96 | 4,61 | 2,58 | 1,7161 | -0,0600 | |||
| EXP / Eagle Materials Inc. | 0,02 | 1,89 | 4,59 | -7,20 | 1,7088 | -0,2464 | |||
| EA / Electronic Arts Inc. | 0,03 | 0,65 | 4,53 | 11,24 | 1,6890 | 0,0766 | |||
| ADBE / Adobe Inc. | 0,01 | 1,85 | 4,47 | 2,74 | 1,6645 | -0,0556 | |||
| FIS / Fidelity National Information Services, Inc. | 0,05 | 1,20 | 4,43 | 10,33 | 1,6519 | 0,0622 | |||
| FLS / Flowserve Corporation | 0,08 | 0,88 | 4,26 | 8,15 | 1,5877 | 0,0288 | |||
| CI / The Cigna Group | 0,01 | 5,06 | 4,16 | 5,56 | 1,5503 | -0,0090 | |||
| PVH / PVH Corp. | 0,06 | 1,23 | 4,04 | 7,42 | 1,5044 | 0,0176 | |||
| PLD / Prologis, Inc. | 0,04 | 0,30 | 4,01 | -5,70 | 1,4934 | -0,1877 | |||
| TRGP / Targa Resources Corp. | 0,02 | 0,40 | 3,98 | -12,83 | 1,4844 | -0,3234 | |||
| BDX / Becton, Dickinson and Company | 0,02 | 5,30 | 3,98 | -20,82 | 1,4835 | -0,5057 | |||
| KBH / KB Home | 0,07 | 2,67 | 3,50 | -6,44 | 1,3058 | -0,1758 | |||
| VGT / Vanguard World Fund - Vanguard Information Technology ETF | 0,01 | -0,19 | 3,40 | 22,08 | 1,2651 | 0,1646 | |||
| MHK / Mohawk Industries, Inc. | 0,03 | 3,59 | 3,33 | -4,88 | 1,2412 | -0,1442 | |||
| NXPI / NXP Semiconductors N.V. | 0,01 | 2,66 | 3,20 | 18,01 | 1,1939 | 0,1198 | |||
| INGR / Ingredion Incorporated | 0,02 | 2,80 | 1,0429 | 1,0429 | |||||
| TFX / Teleflex Incorporated | 0,02 | 6,23 | 2,69 | -9,03 | 1,0022 | -0,1673 | |||
| EOG / EOG Resources, Inc. | 0,02 | 5,31 | 2,59 | -1,78 | 0,9642 | -0,0780 | |||
| ACN / Accenture plc | 0,01 | 12,98 | 2,47 | 8,18 | 0,9218 | 0,0174 | |||
| NRG / NRG Energy, Inc. | 0,01 | 2,33 | 0,8686 | 0,8686 | |||||
| VICI / VICI Properties Inc. | 0,06 | 2,63 | 2,06 | 2,59 | 0,7662 | -0,0269 | |||
| BND / Vanguard Bond Index Funds - Vanguard Total Bond Market ETF | 0,02 | -0,68 | 1,62 | -0,43 | 0,6033 | -0,0401 | |||
| AGG / iShares Trust - iShares Core U.S. Aggregate Bond ETF | 0,02 | -2,24 | 1,60 | -1,97 | 0,5948 | -0,0493 | |||
| VFH / Vanguard World Fund - Vanguard Financials ETF | 0,01 | 4,56 | 1,52 | 11,41 | 0,5677 | 0,0267 | |||
| TGT / Target Corporation | 0,02 | 10,75 | 1,51 | 4,71 | 0,5632 | -0,0080 | |||
| BRK.A / Berkshire Hathaway Inc. | 0,00 | 0,00 | 1,46 | -8,71 | 0,5431 | -0,0886 | |||
| CVX / Chevron Corporation | 0,01 | -7,10 | 1,29 | -20,48 | 0,4804 | -0,1611 | |||
| AMZN / Amazon.com, Inc. | 0,01 | 0,02 | 1,18 | 15,36 | 0,4395 | 0,0349 | |||
| VCR / Vanguard World Fund - Vanguard Consumer Discretionary ETF | 0,00 | 7,82 | 1,07 | 20,02 | 0,4001 | 0,0462 | |||
| VHT / Vanguard World Fund - Vanguard Health Care ETF | 0,00 | 3,67 | 1,03 | -2,83 | 0,3845 | -0,0353 | |||
| UNH / UnitedHealth Group Incorporated | 0,00 | -16,74 | 1,03 | -50,41 | 0,3839 | -0,4380 | |||
| VIS / Vanguard World Fund - Vanguard Industrials ETF | 0,00 | 2,32 | 1,00 | 15,89 | 0,3722 | 0,0308 | |||
| VOX / Vanguard World Fund - Vanguard Communication Services ETF | 0,01 | -0,68 | 0,97 | 14,54 | 0,3611 | 0,0262 | |||
| JPM / JPMorgan Chase & Co. | 0,00 | -1,00 | 0,95 | 17,04 | 0,3535 | 0,0328 | |||
| WMT / Walmart Inc. | 0,01 | -10,59 | 0,87 | -0,46 | 0,3237 | -0,0214 | |||
| TSLA / Tesla, Inc. | 0,00 | 0,93 | 0,83 | 23,65 | 0,3081 | 0,0437 | |||
| SCHG / Schwab Strategic Trust - Schwab U.S. Large-Cap Growth ETF | 0,02 | 2,82 | 0,65 | 19,89 | 0,2406 | 0,0276 | |||
| CSCO / Cisco Systems, Inc. | 0,01 | -89,55 | 0,60 | -88,26 | 0,2222 | -1,7863 | |||
| NVDA / NVIDIA Corporation | 0,00 | 3,83 | 0,56 | 51,62 | 0,2090 | 0,0624 | |||
| OTTR / Otter Tail Corporation | 0,01 | -3,85 | 0,53 | -7,89 | 0,1959 | -0,0296 | |||
| VDC / Vanguard World Fund - Vanguard Consumer Staples ETF | 0,00 | -2,67 | 0,49 | -2,60 | 0,1816 | -0,0163 | |||
| IBM / International Business Machines Corporation | 0,00 | -16,36 | 0,48 | -0,83 | 0,1786 | -0,0127 | |||
| LMT / Lockheed Martin Corporation | 0,00 | -27,55 | 0,47 | -24,92 | 0,1743 | -0,0720 | |||
| SCHZ / Schwab Strategic Trust - Schwab U.S. Aggregate Bond ETF | 0,02 | 2,86 | 0,41 | 3,27 | 0,1528 | -0,0044 | |||
| DIS / The Walt Disney Company | 0,00 | -5,50 | 0,40 | 18,69 | 0,1493 | 0,0158 | |||
| QQQ / Invesco QQQ Trust, Series 1 | 0,00 | 0,56 | 0,40 | 18,51 | 0,1480 | 0,0152 | |||
| COST / Costco Wholesale Corporation | 0,00 | -7,08 | 0,39 | -2,74 | 0,1454 | -0,0133 | |||
| SCHM / Schwab Strategic Trust - Schwab U.S. Mid-Cap ETF | 0,01 | 2,67 | 0,38 | 9,86 | 0,1414 | 0,0048 | |||
| SPYG / SPDR Series Trust - SPDR Portfolio S&P 500 Growth ETF | 0,00 | 1,37 | 0,37 | 20,32 | 0,1390 | 0,0163 | |||
| SPY / SPDR S&P 500 ETF | 0,00 | -7,75 | 0,35 | 1,73 | 0,1315 | -0,0055 | |||
| VDE / Vanguard World Fund - Vanguard Energy ETF | 0,00 | 13,19 | 0,35 | 3,83 | 0,1314 | -0,0028 | |||
| CB / Chubb Limited | 0,00 | -1,53 | 0,33 | -5,65 | 0,1247 | -0,0154 | |||
| PEP / PepsiCo, Inc. | 0,00 | -19,54 | 0,30 | -29,21 | 0,1130 | -0,0563 | |||
| SCHA / Schwab Strategic Trust - Schwab U.S. Small-Cap ETF | 0,01 | 5,67 | 0,30 | 13,96 | 0,1128 | 0,0078 | |||
| TECK / Teck Resources Limited | 0,01 | -9,87 | 0,30 | 0,00 | 0,1111 | -0,0070 | |||
| CPRT / Copart, Inc. | 0,01 | 0,00 | 0,27 | -13,38 | 0,1016 | -0,0228 | |||
| IAGG / iShares Trust - iShares Core International Aggregate Bond ETF | 0,01 | 7,42 | 0,26 | 9,54 | 0,0986 | 0,0032 | |||
| SCHV / Schwab Strategic Trust - Schwab U.S. Large-Cap Value ETF | 0,01 | 0,37 | 0,26 | 4,49 | 0,0956 | -0,0016 | |||
| SCHF / Schwab Strategic Trust - Schwab International Equity ETF | 0,01 | -0,95 | 0,26 | 10,39 | 0,0953 | 0,0039 | |||
| VNQ / Vanguard Specialized Funds - Vanguard Real Estate ETF | 0,00 | 4,63 | 0,26 | 2,82 | 0,0953 | -0,0030 | |||
| VPU / Vanguard World Fund - Vanguard Utilities ETF | 0,00 | 4,64 | 0,25 | 8,09 | 0,0949 | 0,0017 | |||
| JEPI / J.P. Morgan Exchange-Traded Fund Trust - JPMorgan Equity Premium Income ETF | 0,00 | -5,11 | 0,25 | -5,66 | 0,0933 | -0,0116 | |||
| MCD / McDonald's Corporation | 0,00 | -0,71 | 0,24 | -6,87 | 0,0909 | -0,0130 | |||
| BRK.B / Berkshire Hathaway Inc. | 0,00 | -7,89 | 0,24 | -15,90 | 0,0887 | -0,0234 | |||
| RJF / Raymond James Financial, Inc. | 0,00 | -2,81 | 0,23 | 7,37 | 0,0870 | 0,0009 | |||
| FDX / FedEx Corporation | 0,00 | -1,00 | 0,22 | -7,82 | 0,0837 | -0,0126 | |||
| VAW / Vanguard World Fund - Vanguard Materials ETF | 0,00 | 1,29 | 0,21 | 4,41 | 0,0797 | -0,0013 | |||
| COP / ConocoPhillips | 0,00 | -100,00 | 0,00 | 0,0000 | |||||
| JNJ / Johnson & Johnson | 0,00 | -100,00 | 0,00 | 0,0000 | |||||
| SPGI / S&P Global Inc. | 0,00 | -100,00 | 0,00 | 0,0000 | |||||
| XOM / Exxon Mobil Corporation | 0,00 | -100,00 | 0,00 | 0,0000 |