Grundlæggende statistik
| Institutionelle aktier (lange) | 3.014.072.444 - 78,63% (ex 13D/G) - change of -236,66MM shares -7,28% MRQ |
| Institutionel værdi (lang) | $ 48.788.210 USD ($1000) |
Institutionelt ejerskab og aktionærer
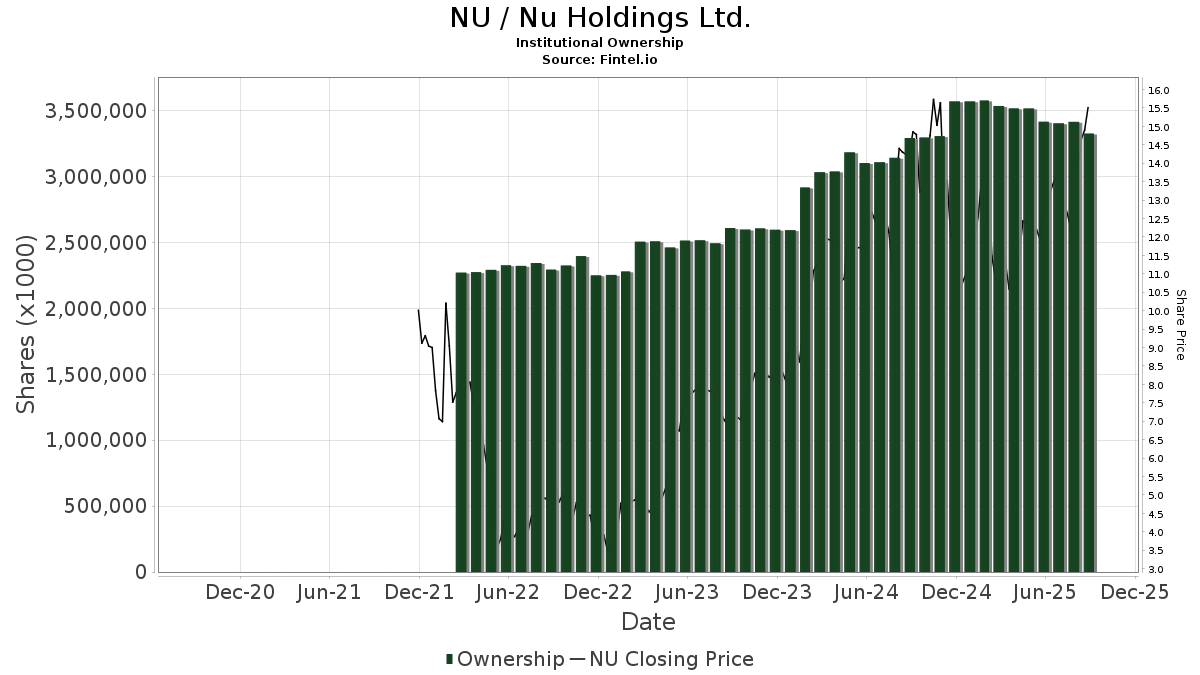
Nu Holdings Ltd. (US:NU) har 1023 institutionelle ejere og aktionærer, der har indsendt 13D/G- eller 13F-formularer til Securities Exchange Commission (SEC). Disse institutioner har i alt 3,014,077,312 aktier. Største aktionærer omfatter BlackRock, Inc., Baillie Gifford & Co, Capital Research Global Investors, Morgan Stanley, State Street Corp, Jpmorgan Chase & Co, Wcm Investment Management, Llc, Fmr Llc, NEWFX - NEW WORLD FUND INC Class A, and Coatue Management Llc .
Nu Holdings Ltd. (NYSE:NU) institutionel ejerskabsstruktur viser aktuelle positioner i virksomheden efter institutioner og fonde, samt seneste ændringer i positionsstørrelse. Større aktionærer kan omfatte individuelle investorer, investeringsforeninger, hedgefonde eller institutioner. Skema 13D angiver, at investoren besidder (eller besidder) mere end 5 % af virksomheden og har til hensigt (eller har til hensigt at) aktivt at forfølge en ændring i forretningsstrategi. Skema 13G indikerer en passiv investering på over 5%.
The share price as of March 20, 2026 is 13,95 / share. Previously, on March 20, 2025, the share price was 11,40 / share. This represents an increase of 22,37% over that period.
Fondens stemningsscore
Fund Sentiment Score (fka Ownership Accumulation Score) finder de aktier, der bliver mest købt af fonde. Det er resultatet af en sofistikeret, multi-faktor kvantitativ model, der identificerer virksomheder med de højeste niveauer af institutionel akkumulering. Scoringsmodellen bruger en kombination af den samlede stigning i oplyste ejere, ændringerne i porteføljeallokeringer i disse ejere og andre målinger. Tallet går fra 0 til 100, hvor højere tal indikerer et højere niveau af akkumulering for sine jævnaldrende, og 50 er gennemsnittet.
Opdateringsfrekvens: Dagligt
Se Ownership Explorer, som giver en liste over højest rangerende virksomheder.
AI+ Ask Fintel’s AI assistant about Nu Holdings Ltd..
Select a question to share a public post with an AI-crafted answer.
Thinking of good questions…
Institutionel Put/Call-forhold
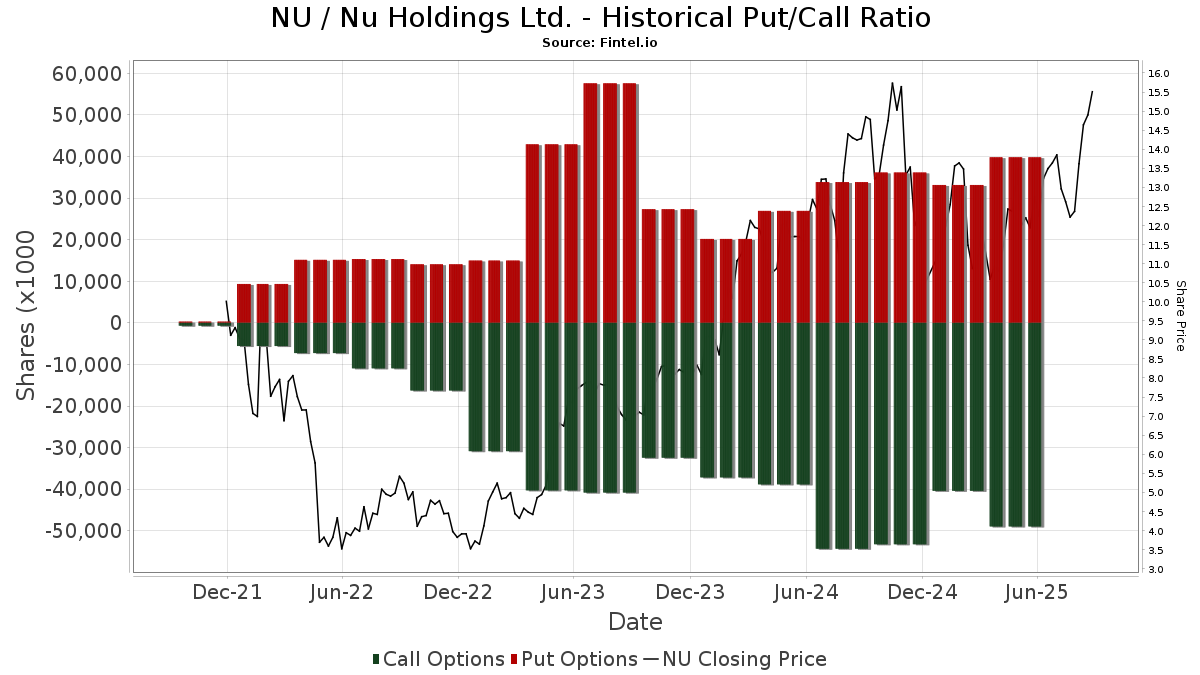
Ud over at indberette standardaktie- og gældsudstedelser skal institutter med mere end 100 mill. aktiver under forvaltning også oplyse deres put- og call-optionsbeholdninger. Da salgsoptioner generelt indikerer negativ stemning, og købsoptioner indikerer positiv stemning, kan vi få en fornemmelse af den overordnede institutionelle stemning ved at plotte forholdet mellem put og kald. Diagrammet til højre viser det historiske put/call-forhold for dette instrument.
Brug af Put/Call Ratio som en indikator for investorernes stemning overvinder en af de vigtigste mangler ved at bruge totalt institutionelt ejerskab, som er, at en betydelig mængde af aktiver under forvaltning investeres passivt for at spore indekser. Passivt forvaltede fonde køber typisk ikke optioner, så indikatoren for put/call-forholdet følger mere nøje følelsen af aktivt forvaltede fonde.
13D/G-arkivering
Vi præsenterer 13D/G ansøgninger separat fra 13F ansøgninger på grund af den forskellige behandling af SEC. 13D/G-ansøgninger kan indgives af grupper af investorer (med én ledende), hvorimod 13F-ansøgninger ikke kan. Dette resulterer i situationer, hvor en investor kan indsende en 13D/G, der rapporterer én værdi for de samlede aktier (der repræsenterer alle de aktier, der ejes af investorgruppen), men derefter indsender en 13F, der rapporterer en anden værdi for de samlede aktier (der udelukkende repræsenterer deres egne) ejendomsret). Det betyder, at aktieejerskab af 13D/G-arkiver og 13F-arkiveringer ofte ikke er direkte sammenlignelige, så vi præsenterer dem separat.
Bemærk: Fra den 16. maj 2021 viser vi ikke længere ejere, der ikke har indsendt en 13D/G inden for det seneste år. Tidligere viste vi den fulde historie af 13D/G-arkiver. Generelt skal enheder, der er forpligtet til at indgive 13D/G-ansøgninger, indgive mindst årligt, før de indsender en afsluttende ansøgning. Dog forlader fonde nogle gange positioner uden at indsende en afsluttende ansøgning (dvs. de afvikler), så visning af den fulde historie resulterede nogle gange i forvirring om det nuværende ejerskab. For at undgå forvirring viser vi nu kun 'aktuelle' ejere - det vil sige - ejere, der har anmeldt inden for det seneste år.
Upgrade to unlock premium data.
| Fil dato | Form | Investor | Forrige Aktier |
Seneste Aktier |
Δ Aktier (Procent) |
Ejendomsret (Procent) |
Δ Ejerskab (Procent) |
|
|---|---|---|---|---|---|---|---|---|
| 2025-11-13 | Capital Research Global Investors | 194,880,670 | 184,607,140 | -5.27 | 4.90 | -5.77 | ||
| 2025-10-17 | Rua California Ltd. | 937,344,645 | 905,579,578 | -3.39 | 19.16 | -4.20 | ||
| 2025-05-14 | SC US (TTGP), LTD. | 252,320,306 | 109,190,574 | -56.73 | 2.90 | -58.57 | ||
| 2025-04-30 | BAILLIE GIFFORD & CO | 210,103,451 | 265,160,474 | 26.20 | 7.00 | 22.81 |
13F og NPORT arkivering
Detaljer om 13F-arkivering er gratis. Detaljer om NP-ansøgninger kræver et premium-medlemskab. Grønne rækker angiver nye positioner. Røde rækker angiver lukkede positioner. Klik på linket ikon for at se den fulde transaktionshistorik.
Opgrader
for at låse premium-data op og eksportere til Excel ![]() .
.
Important Note
In an effort to reduce load times for our mobile users, we are testing some ways to deliver lighter pages.
In this first test, we will deliver only the most recent 750 transactions (out of 1281 for this stock). If you are interested in loading *all* the transactions for this company, click the "load all" button below. This is just a test and if you don't like it, please let us know by submitting some gentle feedback via the link at the bottom of this page.
Load All| Fil dato | Kilde | Investor | Type | Gennemsnitlig pris (Øst) |
Aktier | Δ Aktier (%) |
Rapporteret Værdi ($1000) |
Δ Værdi (%) |
Port Alloc (%) |
|
|---|---|---|---|---|---|---|---|---|---|---|
| 2026-01-16 | 13F | Perigon Wealth Management, LLC | 21.659 | 6,86 | 363 | 11,73 | ||||
| 2025-11-14 | 13F | SummitTX Capital, L.P. | 0 | -100,00 | 0 | |||||
| 2026-02-11 | 13F | Fore Capital, LLC | Put | 0 | -100,00 | 0 | -100,00 | |||
| 2026-02-13 | 13F | Glen Eagle Advisors, LLC | 0 | -100,00 | 0 | |||||
| 2025-10-08 | 13F | Country Club Bank /gfn | 149.246 | -0,15 | 2.380 | 20,20 | ||||
| 2026-02-11 | 13F | Los Angeles Capital Management Llc | 8.377.099 | 54,07 | 134.536 | 54,55 | ||||
| 2026-02-13 | 13F | Kids Capital Management, L.p. | 420.000 | 0,00 | 7.031 | 4,55 | ||||
| 2026-02-17 | 13F | Scientech Research LLC | 0 | -100,00 | 0 | |||||
| 2026-02-12 | 13F | California Public Employees Retirement System | 5.904.974 | 2,50 | 98.849 | 7,17 | ||||
| 2026-01-09 | 13F | SG Americas Securities, LLC | 613.424 | 619,39 | 10 | 900,00 | ||||
| 2026-01-27 | 13F | Zurcher Kantonalbank (Zurich Cantonalbank) | 850.924 | 3,88 | 14.244 | 8,62 | ||||
| 2026-02-02 | 13F | Ping Capital Management, Inc. | 13.600 | 228 | ||||||
| 2026-02-04 | 13F | INCA Investments LLC | 1.534.540 | 2,88 | 25.688 | 7,57 | ||||
| 2026-02-06 | 13F | Tortoise Investment Management, LLC | 0 | -100,00 | 0 | -100,00 | ||||
| 2026-02-06 | 13F | Pathway Financial Advisers, LLC | 10.040 | -3,86 | 168 | 0,60 | ||||
| 2026-02-11 | 13F | ARK Investment Management LLC | 1.327.232 | -5,71 | 22.218 | -1,42 | ||||
| 2026-01-05 | 13F | Park National Corp /oh/ | 16.623 | -1,43 | 278 | 2,96 | ||||
| 2025-11-14 | 13F | Capitolis Liquid Global Markets LLC | 0 | -100,00 | 0 | |||||
| 2026-02-10 | 13F | Triglav Skladi, D.o.o. | 88.247 | 76,49 | 1.477 | 84,63 | ||||
| 2025-11-14 | 13F | Point72 Asia (Singapore) Pte. Ltd. | 0 | -100,00 | 0 | |||||
| 2026-01-20 | 13F | Sheets Smith Wealth Management | 25.992 | 0,00 | 435 | 4,57 | ||||
| 2026-02-03 | 13F | Harel Insurance Investments & Financial Services Ltd. | 10.000 | 0 | ||||||
| 2026-02-05 | 13F | Allworth Financial LP | 6.631 | 90,11 | 111 | 101,82 | ||||
| 2026-02-12 | 13F | ROSS\JOHNSON & Associates LLC | 10 | 0 | ||||||
| 2025-09-25 | NP | PWJAX - PGIM Jennison International Opportunities Fund Class A | 6.727.178 | 14,75 | 82.206 | 12,81 | ||||
| 2026-01-21 | 13F | Oak Thistle LLC | 23.634 | 396 | ||||||
| 2025-09-26 | NP | FBCGX - Fidelity Blue Chip Growth K6 Fund This fund is a listed as child fund of Fmr Llc and if that institution has disclosed ownership in this security, then these positions will not be double counted when calculating total shares and total value | 235.700 | 2.880 | ||||||
| 2025-09-26 | NP | FBGRX - Fidelity Blue Chip Growth Fund This fund is a listed as child fund of Fmr Llc and if that institution has disclosed ownership in this security, then these positions will not be double counted when calculating total shares and total value | 1.052.623 | 12.863 | ||||||
| 2026-02-17 | 13F | Alphadyne Asset Management, LLC | 2.642 | 44 | ||||||
| 2026-02-11 | 13F | Krane Funds Advisors LLC | 16.834 | 0,00 | 282 | 12,40 | ||||
| 2026-02-17 | 13F | Alphadyne Asset Management, LLC | Call | 375.600 | 6.288 | |||||
| 2026-02-17 | 13F | Alphadyne Asset Management, LLC | Put | 418.700 | 7.009 | |||||
| 2025-09-24 | NP | GLOF - iShares Edge MSCI Multifactor Global ETF | 13.431 | 9,71 | 164 | 7,89 | ||||
| 2025-10-08 | 13F | Sheets Smith Investment Management | 61.621 | 987 | ||||||
| 2026-02-06 | 13F | Pinnbrook Capital Management Lp | Call | 894.000 | 14.966 | |||||
| 2025-09-24 | NP | RVRB - Reverb ETF | 303 | -9,01 | 4 | -25,00 | ||||
| 2026-02-10 | 13F | Kentucky Retirement Systems | 210.014 | 0,00 | 3.516 | 4,55 | ||||
| 2026-02-17 | 13F | Ribbit Management Company, LLC | 28.111.640 | 0,00 | 470.589 | 4,56 | ||||
| 2025-11-14 | 13F | Wetherby Asset Management Inc | 33.430 | -16,75 | 535 | -2,73 | ||||
| 2026-01-23 | 13F | Transcend Wealth Collective, Llc | 17.776 | 2,58 | 298 | 7,22 | ||||
| 2026-01-05 | 13F | Chesapeake Asset Management Llc | 0 | -100,00 | 0 | |||||
| 2026-02-12 | 13F | Rossby Financial, LCC | 27 | 0,00 | 0 | |||||
| 2026-02-11 | 13F | Meeder Asset Management Inc | 734 | 0,14 | 12 | 9,09 | ||||
| 2026-02-02 | 13F | Oppenheimer & Co Inc | 76.134 | 0,17 | 1.274 | 4,77 | ||||
| 2026-02-06 | 13F | Pinnbrook Capital Management Lp | 82.060 | 1.374 | ||||||
| 2026-02-12 | 13F | New York State Common Retirement Fund | 4.206.553 | 1,24 | 70.418 | 5,86 | ||||
| 2026-03-13 | 13F | ARP Global Capital Ltd | 336.197 | 5.628 | ||||||
| 2026-03-16 | 13F | Osbon Capital Management Llc | 13.557 | 227 | ||||||
| 2026-02-17 | 13F | Orbis Allan Gray Ltd | 3.923.704 | -85,63 | 65.683 | -84,97 | ||||
| 2026-02-13 | 13F | Laurion Capital Management LP | Call | 0 | -100,00 | 0 | ||||
| 2026-02-17 | 13F | Oaktree Fund Advisors, LLC | 242.850 | 2,36 | 4.065 | 7,03 | ||||
| 2026-02-17 | 13F | Advisory Services Network, LLC | 127.693 | 4,60 | 2.138 | 9,37 | ||||
| 2026-02-13 | 13F | Headlands Technologies LLC | 136.671 | 2.288 | ||||||
| 2026-01-26 | 13F | Moran Wealth Management, LLC | 300.413 | 7,95 | 5.029 | 12,86 | ||||
| 2026-02-23 | 13F | Wealth Preservation Advisors, LLC | 35 | 0,00 | 1 | |||||
| 2025-11-14 | 13F | Turim 21 Investimentos Ltda. | 0 | -100,00 | 0 | |||||
| 2026-02-17 | 13F | Optiver Holding B.V. | 1.095.120 | 813,83 | 18.332 | 855,79 | ||||
| 2026-02-13 | 13F | Sterling Capital Management LLC | 139.782 | -2,50 | 2.340 | 1,92 | ||||
| 2025-09-26 | NP | FHKFX - Fidelity Series Emerging Markets Fund This fund is a listed as child fund of Fmr Llc and if that institution has disclosed ownership in this security, then these positions will not be double counted when calculating total shares and total value | 1.500.493 | -39,26 | 18.336 | -40,29 | ||||
| 2025-09-26 | NP | RTNAX - Tax-Managed International Equity Fund Class A | 719.301 | 48,71 | 8.790 | 46,19 | ||||
| 2026-01-08 | 13F | Wealth Enhancement Advisory Services, Llc | Call | 10.000 | 63 | |||||
| 2026-02-10 | 13F | Bank of New York Mellon Corp | 7.661.818 | -1,68 | 128.259 | 2,80 | ||||
| 2026-02-13 | 13F | Golden State Wealth Management, LLC | 71 | 0,00 | 1 | 0,00 | ||||
| 2026-02-17 | 13F | Norinchukin Bank, The | 14.341 | 18,68 | 240 | 24,35 | ||||
| 2026-02-09 | 13F | Geode Capital Management, Llc | 28.208.035 | 5,72 | 468.915 | 10,65 | ||||
| 2026-01-08 | 13F | Wealth Enhancement Advisory Services, Llc | 340.480 | -0,36 | 6.081 | 17,62 | ||||
| 2026-02-11 | 13F | Fore Capital, LLC | Call | 140.000 | 100,00 | 2.344 | 109,20 | |||
| 2026-02-17 | 13F | Crosslink Capital Inc | 1.656.595 | 27.731 | ||||||
| 2026-02-03 | 13F | Investment Management Associates Inc /adv | 928.723 | 86,36 | 15.547 | 94,86 | ||||
| 2026-01-28 | 13F | WPG Advisers, LLC | 3.546 | 17,15 | 59 | 22,92 | ||||
| 2026-02-09 | 13F | Keating Financial Advisory Services, Inc. | 5.515 | 92 | ||||||
| 2026-02-13 | 13F | Brown Advisory Inc | 33.685 | 39,37 | 564 | 45,85 | ||||
| 2026-02-13 | 13F | Ieq Capital, Llc | 4.574.388 | -5,63 | 76.575 | -1,33 | ||||
| 2026-02-11 | 13F | Fore Capital, LLC | 35.000 | 586 | ||||||
| 2026-01-21 | 13F | Yousif Capital Management, Llc | 95.093 | 0,46 | 1.614 | 6,47 | ||||
| 2026-02-04 | 13F | Legacy Financial Advisors, Inc. | 14.027 | 18,37 | 235 | 23,81 | ||||
| 2025-11-12 | 13F | Buckingham Strategic Partners | 0 | -100,00 | 0 | |||||
| 2026-01-27 | 13F/A | Capital Performance Advisors Llp | 19.269 | 323 | ||||||
| 2026-02-11 | 13F | Axiom International Investors Llc /de | 8.320.628 | 14,27 | 139.287 | 19,48 | ||||
| 2025-11-12 | 13F | Ameriflex Group, Inc. | 0 | -100,00 | 0 | |||||
| 2026-01-21 | 13F | Country Trust Bank | 100 | 0,00 | 2 | 0,00 | ||||
| 2025-09-25 | NP | HSDEX - Hartford Schroders Diversified Emerging Markets Fund Class SDR | 0 | -100,00 | 0 | -100,00 | ||||
| 2026-02-06 | 13F | Gsa Capital Partners Llp | 92.783 | -14,60 | 2 | 0,00 | ||||
| 2026-02-13 | 13F | Laurion Capital Management LP | Put | 0 | -100,00 | 0 | ||||
| 2026-02-17 | 13F | Stokes Family Office, LLC | 55.027 | 0,05 | 921 | 4,66 | ||||
| 2026-01-28 | 13F | Campbell Capital Management Inc | 387.390 | 0,30 | 6.485 | 4,87 | ||||
| 2026-01-16 | 13F | FNY Investment Advisers, LLC | 0 | -100,00 | 0 | |||||
| 2026-02-10 | 13F | Verus Capital Partners, Llc | 75.200 | 25,68 | 1.259 | 31,45 | ||||
| 2026-01-30 | 13F | R Squared Ltd | 0 | -100,00 | 0 | |||||
| 2025-09-25 | NP | EMRSX - JPMorgan Emerging Markets Research Enhanced Equity Fund Class R6 | 631.096 | -19,96 | 7.712 | -21,32 | ||||
| 2026-02-17 | 13F | Vinva Investment Management Ltd | 147.293 | 571,04 | 2.486 | 610,29 | ||||
| 2025-09-26 | NP | RMYAX - Multi-Strategy Income Fund Class A | 6.430 | 79 | ||||||
| 2026-02-02 | 13F | Horizon Investments, LLC | 17.646 | 8,55 | 295 | 13,46 | ||||
| 2026-02-19 | 13F | Atomi Financial Group, Inc. | 67.241 | 20,14 | 1.126 | 25,56 | ||||
| 2026-02-17 | 13F | General Equity Holdings LP | 584.400 | -7,88 | 9.783 | -3,68 | ||||
| 2026-02-17 | 13F | Jones Financial Companies Lllp | 88.456 | 32,83 | 1.481 | 40,95 | ||||
| 2026-02-09 | 13F | Cary Street Partner Investment Advisory Llc | 316 | 5 | ||||||
| 2026-01-30 | 13F | Trifecta Capital Advisors, LLC | 236 | 4 | ||||||
| 2026-01-23 | 13F | LOM Asset Management Ltd | 1.500 | 25 | ||||||
| 2025-11-14 | 13F | Teza Capital Management LLC | 0 | -100,00 | 0 | |||||
| 2026-02-03 | 13F | We Are One Seven, LLC | 13.067 | -0,65 | 219 | 3,81 | ||||
| 2026-02-17 | 13F | Voloridge Investment Management, Llc | 3.485.387 | 144,25 | 58.345 | 199,54 | ||||
| 2026-01-27 | 13F | Ninety One UK Ltd | 7.853.707 | 9,08 | 131.471 | 14,06 | ||||
| 2025-11-07 | 13F | Synovus Financial Corp | 0 | -100,00 | 0 | |||||
| 2026-01-29 | 13F | Quent Capital, LLC | 1.485 | 0,00 | 25 | 4,35 | ||||
| 2026-02-06 | 13F | Wisconsin Capital Management Llc | 68.284 | 1,09 | 1.143 | 5,74 | ||||
| 2026-02-17 | 13F | Polar Capital Holdings Plc | 6.472.724 | 3,45 | 108.353 | 8,17 | ||||
| 2025-11-14 | 13F | Fourth Sail Capital LP | 0 | -100,00 | 0 | -100,00 | ||||
| 2025-09-29 | NP | CRLSX - CATHOLIC RESPONSIBLE INVESTMENTS INTERNATIONAL EQUITY FUND Institutional Shares | 1.162.722 | 6,40 | 14.208 | 4,60 | ||||
| 2026-02-13 | 13F | Resources Investment Advisors, LLC. | 78.963 | 2,40 | 1.322 | 7,05 | ||||
| 2025-11-14 | 13F | Point72 Hong Kong Ltd | 0 | -100,00 | 0 | |||||
| 2026-02-17 | 13F | Atom Investors LP | 257.023 | 4.303 | ||||||
| 2026-02-11 | 13F | Clearbridge Investments, LLC | 3.281.682 | 54.935 | ||||||
| 2026-02-19 | 13F | First Growth Capital LLC | 17.174 | 299 | ||||||
| 2026-02-17 | 13F | Oaktree Capital Management Lp | 4.479.175 | -0,88 | 74.981 | 3,64 | ||||
| 2026-02-17 | 13F | Aster Capital Management (DIFC) Ltd | 14.525 | 243 | ||||||
| 2026-02-18 | 13F | Warther Private Wealth, LLC | 1.030.169 | -22,37 | 17.245 | -18,83 | ||||
| 2026-02-12 | 13F | Cliffwater LLC | 9.485 | 73,34 | 159 | 81,61 | ||||
| 2026-02-17 | 13F | Foxhaven Asset Management, LP | 6.817.430 | 114.124 | ||||||
| 2026-02-05 | 13F | Mason & Associates Inc | 29.975 | -0,97 | 502 | 3,51 | ||||
| 2025-10-15 | 13F | Vontobel Holding Ltd. | Call | 0 | -100,00 | 0 | -100,00 | |||
| 2025-11-12 | 13F | Orland Properties Ltd | 0 | -100,00 | 0 | |||||
| 2026-02-17 | 13F | Evergreen Quality Fund GP, Ltd. | 0 | -100,00 | 0 | |||||
| 2026-02-13 | 13F | Bay Colony Advisory Group, Inc d/b/a Bay Colony Advisors | 17.653 | 296 | ||||||
| 2025-10-15 | 13F | Vontobel Holding Ltd. | Put | 0 | -100,00 | 0 | -100,00 | |||
| 2026-02-13 | 13F | 71 West Capital Partners | 638.683 | 10.692 | ||||||
| 2026-02-13 | 13F | Platform Technology Partners | 18.030 | -4,60 | 302 | -0,33 | ||||
| 2026-02-12 | 13F | Andra AP-fonden | 1.474.600 | -45,41 | 24.685 | -42,93 | ||||
| 2025-09-23 | NP | ARKF - ARK Fintech Innovation ETF | 1.456.440 | 18,92 | 17.798 | 16,91 | ||||
| 2025-09-24 | NP | CRBN - iShares MSCI ACWI Low Carbon Target ETF | 40.279 | 36,79 | 492 | 34,43 | ||||
| 2026-02-03 | 13F | Indivisible Partners | 25.151 | 421 | ||||||
| 2025-11-14 | 13F | Quantessence Capital LLC | 0 | -100,00 | 0 | -100,00 | ||||
| 2026-02-13 | 13F | Southeast Asset Advisors Inc. | 0 | -100,00 | 0 | |||||
| 2026-02-17 | 13F | Artisan Partners Limited Partnership | 8.361.955 | -20,03 | 139.979 | -16,38 | ||||
| 2026-02-10 | 13F | Acadian Asset Management Llc | 910.891 | 10,24 | 15 | 15,38 | ||||
| 2026-02-13 | 13F | Natixis | 24.284 | -87,39 | 407 | -86,84 | ||||
| 2026-02-17 | 13F | Core Wealth Partners LLC | 14.000 | 3,70 | 234 | 8,33 | ||||
| 2026-02-13 | 13F | Aptus Capital Advisors, LLC | 19.008 | 3,39 | 318 | 8,16 | ||||
| 2026-02-09 | 13F | Harbour Investments, Inc. | 37.465 | 55,06 | 627 | 62,44 | ||||
| 2026-02-17 | 13F | PDT Partners, LLC | 675.000 | 0,00 | 11.300 | 4,56 | ||||
| 2026-02-11 | 13F | Capital Wealth Planning, LLC | 175.435 | 2.937 | ||||||
| 2026-02-09 | 13F | Blue Owl Capital Holdings LP | 173.873 | 0,00 | 2.911 | 4,56 | ||||
| 2025-09-26 | NP | FSSGX - Fidelity SAI Sustainable Emerging Markets Equity Fund | 16.049 | -33,98 | 196 | -35,10 | ||||
| 2025-09-26 | NP | FEQHX - Fidelity Hedged Equity Fund | 6.579 | 80 | ||||||
| 2026-02-13 | 13F | Stifel Financial Corp | 771.803 | 11,82 | 12.920 | 16,91 | ||||
| 2026-02-17 | 13F | Alta Park Capital, LP | 3.384.592 | -25,44 | 56.658 | -22,04 | ||||
| 2026-01-08 | 13F | Versant Capital Management, Inc | 10.044 | 74,16 | 168 | 82,61 | ||||
| 2026-02-06 | 13F | Princeton Capital Management Llc | 14.737 | -35,71 | 247 | -32,79 | ||||
| 2026-02-11 | 13F | Accuvest Global Advisors | 13.560 | 227 | ||||||
| 2026-02-14 | 13F | Adalta Capital Management LLC | 183.100 | 2,18 | 3.065 | 6,87 | ||||
| 2025-11-13 | 13F | Sagil Capital Llp | 0 | -100,00 | 0 | -100,00 | ||||
| 2026-01-06 | 13F | Arlington Capital Management, Inc. | 18.192 | -15,16 | 305 | -11,37 | ||||
| 2026-02-11 | 13F | Explore Capital Management, LLC | 335.950 | -44,56 | 5.624 | -42,04 | ||||
| 2026-01-29 | 13F | Vanguard Group Inc | 24.814.878 | 4,36 | 415.401 | 9,12 | ||||
| 2026-01-12 | 13F | Focus Financial Network, Inc. | 15.438 | 0,00 | 258 | 4,45 | ||||
| 2025-09-26 | NP | TRPWX - TIAA-CREF Mid-Cap Growth Fund Institutional Class | 0 | -100,00 | 0 | -100,00 | ||||
| 2026-02-06 | 13F | Leonteq Securities AG | 67.029 | 0,10 | 1.122 | 4,66 | ||||
| 2026-02-06 | 13F | Fairtree Asset Management (Pty) Ltd | 166.845 | 60,44 | 2.793 | 67,79 | ||||
| 2026-02-14 | 13F | Militia Capital Partners, LP | 80.000 | 1.339 | ||||||
| 2026-02-17 | 13F | Garden State Investment Advisory Services LLC | 13.605 | -16,96 | 228 | -13,36 | ||||
| 2026-01-23 | 13F | Legacy Bridge, LLC | 68.355 | -0,44 | 1.144 | 4,09 | ||||
| 2026-02-11 | 13F | Fiera Capital Corp | 1.199.583 | 101,64 | 20.081 | 110,85 | ||||
| 2025-09-24 | NP | FXO - First Trust Financials AlphaDEX Fund This fund is a listed as child fund of First Trust Advisors Lp and if that institution has disclosed ownership in this security, then these positions will not be double counted when calculating total shares and total value | 1.980.602 | 196,62 | 24.203 | 140,22 | ||||
| 2026-02-17 | 13F | Twinbeech Capital Lp | 0 | -100,00 | 0 | |||||
| 2026-02-17 | 13F | BTG Pactual Asset Management US LLC | 57.766 | 404,29 | 967 | 428,42 | ||||
| 2026-02-13 | 13F | Entropy Technologies, LP | 61.849 | -86,04 | 1.035 | -85,41 | ||||
| 2026-02-17 | 13F | Bank Of America Corp /de/ | Put | 0 | -100,00 | 0 | ||||
| 2025-10-31 | 13F | Cullen/frost Bankers, Inc. | 0 | -100,00 | 0 | |||||
| 2026-02-17 | 13F | Magnetar Financial LLC | 17.932 | 300 | ||||||
| 2026-02-03 | 13F | Sequoia Financial Advisors, LLC | 179.537 | 1,58 | 3.005 | 6,22 | ||||
| 2026-02-17 | 13F | Bank Of America Corp /de/ | Call | 0 | -100,00 | 0 | ||||
| 2026-01-23 | 13F | Robeco Institutional Asset Management B.V. | 13.558.273 | 10,00 | 226.965 | 15,02 | ||||
| 2026-02-11 | 13F | Capital World Investors | 10.448.217 | 0,99 | 174.903 | 5,60 | ||||
| 2026-02-12 | 13F | Lansforsakringar Fondforvaltning AB (publ) | 739.255 | 12,82 | 12.375 | 17,97 | ||||
| 2026-02-13 | 13F | Maplelane Capital, Llc | 1.560.000 | 26.114 | ||||||
| 2026-02-17 | 13F | Ravenswood Partners LP | 897.204 | 1,61 | 15.019 | 6,25 | ||||
| 2026-02-17 | 13F | Fred Alger Management, Llc | 805.006 | -11,68 | 13.476 | -7,66 | ||||
| 2026-02-09 | 13F | Coldstream Capital Management Inc | 33.629 | 23,65 | 563 | 29,20 | ||||
| 2026-02-04 | 13F | C WorldWide Group Holding A/S | 311.792 | 1.045,33 | 5 | |||||
| 2026-02-05 | 13F | Thrivent Financial For Lutherans | 406.967 | 0,07 | 7 | 0,00 | ||||
| 2026-01-27 | 13F | TD Waterhouse Canada Inc. | 9.044 | 23,48 | 151 | 17,97 | ||||
| 2026-02-12 | 13F | Penserra Capital Management LLC | 293.034 | 24,00 | 5 | 33,33 | ||||
| 2025-09-23 | NP | PGEIX - Polen Global Emerging Markets Growth Fund Institutional Class | 20.724 | 0,00 | 253 | -1,56 | ||||
| 2025-09-26 | NP | RSEAX - U.S. Strategic Equity Fund Class A | 258.902 | 537,05 | 3.164 | 526,34 | ||||
| 2026-02-17 | 13F | Cantor Fitzgerald, L. P. | 12.900 | -92,17 | 216 | -91,85 | ||||
| 2026-02-11 | 13F | Franklin Resources Inc | 2.199.284 | -25,41 | 36.816 | -22,01 | ||||
| 2026-02-17 | 13F | Captrust Financial Advisors | 189.462 | 2,57 | 3.172 | 7,24 | ||||
| 2026-02-03 | 13F | Crossmark Global Holdings, Inc. | 90.004 | -18,48 | 1.507 | -14,77 | ||||
| 2025-11-14 | 13F | WealthTrak Capital Management LLC | 0 | -100,00 | 0 | |||||
| 2026-01-27 | 13F | Private Wealth Partners, LLC | 13.900 | 0,00 | 233 | 4,50 | ||||
| 2026-02-17 | 13F | Untitled Investments Lp | 1.729.812 | -12,62 | 28.957 | -8,64 | ||||
| 2026-02-06 | 13F | Envestnet Portfolio Solutions, Inc. | 19.455 | 30,30 | 326 | 35,98 | ||||
| 2026-02-12 | 13F | Hm Payson & Co | 563 | 12,60 | 9 | 12,50 | ||||
| 2025-09-25 | NP | JEMA - JPMorgan Emerging Markets Equity Core ETF | 99.485 | -80,37 | 1.216 | -80,71 | ||||
| 2025-09-26 | NP | FDCAX - Fidelity Capital Appreciation Fund This fund is a listed as child fund of Fmr Llc and if that institution has disclosed ownership in this security, then these positions will not be double counted when calculating total shares and total value | 1.998.036 | 24.416 | ||||||
| 2025-09-26 | NP | PCEMX - PACE International Emerging Markets Equity Investments Class P | 224.640 | 47,54 | 2.745 | 45,08 | ||||
| 2026-02-11 | 13F | Loup Funds, LLC | 997.890 | 16.705 | ||||||
| 2026-02-04 | 13F | Schwartz Investment Counsel Inc | 217.600 | 0,00 | 3.643 | 4,57 | ||||
| 2026-02-03 | 13F | SBI Securities Co., Ltd. | 259.796 | 77,45 | 4.349 | 85,57 | ||||
| 2026-02-12 | 13F | Federated Hermes, Inc. | 505.603 | -41,98 | 8.464 | -39,34 | ||||
| 2026-02-13 | 13F | Element Pointe Advisors, Llc | 24.195 | 0,00 | 405 | 4,65 | ||||
| 2026-01-20 | 13F | Toth Financial Advisory Corp | 51.520 | 3.289,47 | 862 | 3.491,67 | ||||
| 2026-02-17 | 13F | California State Teachers Retirement System | 1.595.463 | -0,90 | 26.708 | 3,62 | ||||
| 2025-09-22 | NP | MMITX - Multi-Manager International Equity Fund Class P Shares | 530.623 | -8,34 | 6.484 | -9,89 | ||||
| 2026-02-13 | 13F | Schf (gpe), Llc | 0 | -100,00 | 0 | |||||
| 2025-09-29 | NP | PRFZ - Invesco FTSE RAFI US 1500 Small-Mid ETF This fund is a listed as child fund of Invesco Ltd. and if that institution has disclosed ownership in this security, then these positions will not be double counted when calculating total shares and total value | 205.606 | -34,43 | 2.513 | -35,54 | ||||
| 2026-02-12 | 13F | Hrt Financial Lp | 121.785 | -83,18 | 2 | -81,82 | ||||
| 2026-02-17 | 13F | Whale Rock Capital Management LLC | 10.755.918 | -13,39 | 180.054 | -9,44 | ||||
| 2026-02-12 | 13F | JT Stratford LLC | 195.899 | 3,33 | 3.279 | 8,04 | ||||
| 2026-02-13 | 13F | Bridgefront Capital, LLC | 84.361 | 151,10 | 1.412 | 162,94 | ||||
| 2026-02-12 | 13F | Barings Llc | 1.584.505 | -0,11 | 26.525 | 4,44 | ||||
| 2026-02-13 | 13F | Greenline Wealth Management LLC | 295 | 5 | ||||||
| 2025-09-24 | NP | SWLGX - Schwab U.S. Large-Cap Growth Index Fund This fund is a listed as child fund of Charles Schwab Investment Management Inc and if that institution has disclosed ownership in this security, then these positions will not be double counted when calculating total shares and total value | 402.191 | 5,40 | 4.915 | 3,61 | ||||
| 2026-02-11 | 13F | Metis Global Partners, LLC | 22.799 | -0,87 | 382 | 3,53 | ||||
| 2026-02-13 | 13F | Partners Capital Investment Group, Llp | 58.993 | -12,97 | 988 | -9,03 | ||||
| 2026-02-05 | 13F | AustralianSuper Pty Ltd | 4.326.998 | 129,42 | 72.434 | 139,88 | ||||
| 2026-02-17 | 13F | Legend Capital Advisors LLC | 1.392.916 | 23.317 | ||||||
| 2025-11-03 | 13F | Townsquare Capital Llc | 0 | -100,00 | 0 | |||||
| 2026-02-11 | 13F | BIT Capital GmbH | 92.527 | 1.549 | ||||||
| 2026-02-10 | 13F | Intellectus Partners, LLC | 69.990 | 174,04 | 1.172 | 187,01 | ||||
| 2026-02-12 | 13F | Wealthspire Advisors, LLC | 0 | -100,00 | 0 | |||||
| 2026-02-24 | 13F | Bell Investment Advisors, Inc | 716 | 240,95 | 12 | 266,67 | ||||
| 2025-11-12 | 13F | Compass Group Llc | 118.786 | -0,38 | 1.902 | 16,27 | ||||
| 2026-02-10 | 13F | Axq Capital, Lp | 0 | -100,00 | 0 | |||||
| 2026-01-08 | 13F | Adirondack Trust Co | 255 | 4 | ||||||
| 2026-02-04 | 13F | Bensler, LLC | 123.988 | 2.076 | ||||||
| 2026-02-11 | 13F | Jpmorgan Chase & Co | 80.761.115 | -13,52 | 1.351.941 | -9,58 | ||||
| 2026-02-10 | 13F | BW Gestao de Investimentos Ltda. | 0 | -100,00 | 0 | |||||
| 2026-01-29 | 13F | Matthews International Capital Management Llc | 432.150 | 218,31 | 7.234 | 232,90 | ||||
| 2025-09-24 | NP | PPUMX - LargeCap Growth Fund I R-3 | 113.223 | -31,80 | 1.384 | -32,96 | ||||
| 2026-02-12 | 13F | Federation des caisses Desjardins du Quebec | 270.219 | 10,17 | 4.523 | 15,21 | ||||
| 2026-02-13 | 13F | Sands Capital Management, Llc | 44.423.895 | -12,14 | 743.656 | -8,13 | ||||
| 2026-02-03 | 13F | Maxi Investments CY Ltd | 783.000 | 85,55 | 13 | 116,67 | ||||
| 2025-11-13 | 13F | Clear Street Markets Llc | 0 | -100,00 | 0 | -100,00 | ||||
| 2026-02-06 | 13F | Berbice Capital Management LLC | 8.000 | 0,00 | 134 | 3,91 | ||||
| 2026-02-12 | 13F | Jasper Ridge Partners, L.P. | 254.790 | 0,00 | 4.265 | 4,56 | ||||
| 2026-01-20 | 13F | Perpetual Ltd | 2.787.570 | 110,67 | 46.664 | 120,27 | ||||
| 2026-01-28 | 13F | Klp Kapitalforvaltning As | 763.300 | 0,00 | 12.778 | 4,56 | ||||
| 2026-02-19 | 13F | Invesco Ltd. | 6.889.699 | 33,62 | 115.334 | 39,71 | ||||
| 2026-02-17 | 13F | Point72 Asset Management, L.P. | 3.189.175 | 410,82 | 53.387 | 434,13 | ||||
| 2026-02-12 | 13F | Longitude (Cayman) Ltd. | Call | 330.000 | 5.524 | |||||
| 2026-02-17 | 13F | Greenland Capital Management LP | 61.500 | 1.030 | ||||||
| 2026-02-13 | 13F | Police & Firemen's Retirement System of New Jersey | 914.814 | -2,99 | 15.314 | 1,44 | ||||
| 2026-02-17 | 13F | Point72 Asset Management, L.P. | Put | 304.300 | 79,42 | 5.094 | 87,59 | |||
| 2026-02-17 | 13F | Point72 Asset Management, L.P. | Call | 116.400 | 165,15 | 1.949 | 177,49 | |||
| 2026-02-17 | 13F | Numerai GP LLC | 44.181 | 328,73 | 740 | 350,61 | ||||
| 2026-02-24 | 13F | DGS Capital Management, LLC | 0 | -100,00 | 0 | -100,00 | ||||
| 2026-02-10 | 13F | Clear Harbor Asset Management, LLC | 41.099 | -18,10 | 688 | -14,45 | ||||
| 2026-02-17 | 13F | HighVista Strategies LLC | 62.570 | -42,77 | 1.047 | -40,17 | ||||
| 2026-02-17 | 13F | TCG Advisory Services, LLC | 11.378 | 190 | ||||||
| 2026-02-11 | 13F | Kontiki Capital Management (HK) Ltd. | 34.197.238 | -10,32 | 572.462 | -6,23 | ||||
| 2025-09-24 | NP | BLACKROCK FUNDS - iShares Russell Mid-Cap Index Fund Institutional | 0 | -100,00 | 0 | -100,00 | ||||
| 2026-02-05 | 13F | IMG Wealth Management, Inc. | 0 | -100,00 | 0 | |||||
| 2026-02-17 | 13F | Parallax Volatility Advisers, L.P. | Put | 1.044.600 | -16,62 | 17.487 | -12,82 | |||
| 2026-02-10 | 13F | Nomura Asset Management Co Ltd | 1.887.606 | -3,14 | 31.599 | 1,28 | ||||
| 2026-02-17 | 13F | Parallax Volatility Advisers, L.P. | Call | 3.874.100 | 43,92 | 64.852 | 50,49 | |||
| 2026-02-11 | 13F | Tradition Wealth Management, LLC | 53.794 | 61,20 | 901 | 68,54 | ||||
| 2025-09-26 | NP | FSGEX - Fidelity Series Global ex U.S. Index Fund This fund is a listed as child fund of Fmr Llc and if that institution has disclosed ownership in this security, then these positions will not be double counted when calculating total shares and total value | 5.880.471 | 0,24 | 71.859 | -1,46 | ||||
| 2026-01-23 | 13F | Tectonic Advisors Llc | 14.336 | -1,58 | 240 | 2,58 | ||||
| 2025-09-26 | NP | BLACKROCK GLOBAL ALLOCATION FUND, INC. - BLACKROCK GLOBAL ALLOCATION FUND, INC. Investor A This fund is a listed as child fund of BlackRock, Inc. and if that institution has disclosed ownership in this security, then these positions will not be double counted when calculating total shares and total value | Short | -212.327 | -119,28 | 121 | -97,39 | |||
| 2026-02-04 | 13F | Aubrey Capital Management Ltd | 1.123.500 | 18.809 | ||||||
| 2025-11-14 | 13F | Capstone Investment Advisors, Llc | 0 | -100,00 | 0 | -100,00 | ||||
| 2026-01-16 | 13F | Hillman Co | 8.000 | 134 | ||||||
| 2025-09-26 | NP | FSUMX - Fidelity Series Sustainable U.S. Market Fund | 1.382 | 10,47 | 17 | 6,67 | ||||
| 2026-02-11 | 13F | Capital International Investors | 8.004.823 | 0,95 | 134.001 | 5,56 | ||||
| 2026-02-11 | 13F | Prudential Plc | 172.623 | 2,64 | 2.890 | 7,32 | ||||
| 2025-09-24 | NP | AAARX - Strategic Allocation: Aggressive Fund R Class This fund is a listed as child fund of American Century Companies Inc and if that institution has disclosed ownership in this security, then these positions will not be double counted when calculating total shares and total value | 15.973 | -73,22 | 195 | -73,68 | ||||
| 2026-02-17 | 13F | Nwi Management Lp | Call | 7.000.000 | 16,67 | 117 | 21,88 | |||
| 2026-02-04 | 13F | Swiss Life Asset Management Ltd | 396.988 | 18,14 | 6.646 | 23,54 | ||||
| 2026-02-17 | 13F | Nwi Management Lp | 2.201.400 | -44,98 | 37 | -43,75 | ||||
| 2026-02-17 | 13F | Millennium Management Llc | Put | 554.300 | -8,32 | 9.279 | -4,14 | |||
| 2026-02-09 | 13F | Shufro Rose & Co Llc | 17.045 | 0,00 | 285 | 63,79 | ||||
| 2026-02-17 | 13F | Millennium Management Llc | 2.846.199 | -53,02 | 47.645 | -50,88 | ||||
| 2026-01-13 | 13F | Granite Group Advisors, LLC | 15.299 | -0,84 | 256 | 3,64 | ||||
| 2026-01-30 | 13F | Pekin Hardy Strauss, Inc. | 38.700 | 648 | ||||||
| 2026-01-20 | 13F | Myriad Asset Management US LP | 42.738 | -66,68 | 715 | -65,17 | ||||
| 2026-02-17 | 13F | Millennium Management Llc | Call | 1.583.900 | 0,64 | 26.514 | 5,22 | |||
| 2025-09-23 | NP | EXOSX - Overseas Series Class I | 608.648 | 7.438 | ||||||
| 2026-02-17 | 13F | Nomura Holdings Inc | Call | 54.300 | 909 | |||||
| 2025-11-12 | 13F | Transce3nd, LLC | 0 | -100,00 | 0 | |||||
| 2026-02-05 | 13F | Td Private Client Wealth Llc | 190 | 45,04 | 3 | 50,00 | ||||
| 2025-09-23 | NP | GEBAX - Goldman Sachs ESG Emerging Markets Equity Fund Class A Shares | 17.481 | 39,60 | 214 | 37,42 | ||||
| 2026-02-13 | 13F | Nfj Investment Group, Llc | 105.046 | 1.474,19 | 1.758 | 1.558,49 | ||||
| 2026-01-20 | 13F | Thurston, Springer, Miller, Herd & Titak, Inc. | 750 | 50,00 | 13 | 50,00 | ||||
| 2026-02-13 | 13F | Diametric Capital, LP | 59.587 | 201,32 | 997 | 215,51 | ||||
| 2026-02-13 | 13F | Ossiam | 516.978 | 1,19 | 8.654 | 5,81 | ||||
| 2026-02-04 | 13F | HighPoint Advisor Group LLC | 11.795 | 197 | ||||||
| 2026-02-10 | 13F | Winthrop Capital Management, LLC | 421 | 0,00 | 0 | |||||
| 2026-02-12 | 13F | Raiffeisen Bank International AG | 197.760 | 3.338 | ||||||
| 2026-02-13 | 13F | MayTech Global Investments, LLC | 1.688.819 | 0,96 | 28.271 | 5,58 | ||||
| 2026-02-09 | 13F | William Blair Investment Management, Llc | 18.699.367 | -3,86 | 313.027 | 0,53 | ||||
| 2026-02-13 | 13F | Verition Fund Management LLC | 287.543 | 27,03 | 4.813 | 32,85 | ||||
| 2026-02-17 | 13F | Ninepoint Partners LP | 37.733 | 439,43 | 632 | 468,47 | ||||
| 2025-11-04 | 13F/A | Lingohr & Partner Asset Management GmbH | 83.514 | -16,81 | 1 | 0,00 | ||||
| 2026-02-13 | 13F | Verition Fund Management LLC | Put | 110.500 | -77,90 | 1.850 | -76,90 | |||
| 2026-02-12 | 13F | Skandinaviska Enskilda Banken AB (publ) | 2.121.310 | 45,40 | 35.543 | 52,22 | ||||
| 2026-02-17 | 13F | Wiley Bros.-aintree Capital, Llc | 24.503 | 5,62 | 411 | 10,78 | ||||
| 2025-09-25 | NP | JETIX - abrdn Global Equity Impact Fund Institutional Class | 51.143 | -6,23 | 625 | -7,83 | ||||
| 2026-02-17 | 13F | D1 Capital Partners L.P. | 0 | -100,00 | 0 | |||||
| 2026-01-23 | 13F | Ritholtz Wealth Management | 16.130 | 52,21 | 270 | 59,76 | ||||
| 2026-02-17 | 13F | EFG International AG | 37.925 | 636 | ||||||
| 2026-03-03 | 13F/A | Caitong International Asset Management Co., Ltd | 25 | 150,00 | 0 | |||||
| 2026-02-13 | 13F | Candriam Luxembourg S.C.A. | 5.695.700 | 16,95 | 95.350 | 22,29 | ||||
| 2025-11-14 | 13F | Binnacle Investments Inc | 958 | 16,12 | 15 | 36,36 | ||||
| 2026-02-12 | 13F | Renaissance Technologies Llc | 22.735.260 | 41,74 | 380.608 | 48,20 | ||||
| 2026-02-13 | 13F | AlTi Global, Inc. | 64.136 | 3,49 | 1.074 | 8,17 | ||||
| 2026-02-03 | 13F | NewEdge Wealth, LLC | 67.298 | 1,34 | 1.127 | 4,94 | ||||
| 2026-02-13 | 13F | Quarry LP | 2.109 | 23,91 | 35 | 29,63 | ||||
| 2026-02-17 | 13F | Voleon Capital Management Lp | 906.217 | 181,48 | 15.170 | 194,33 | ||||
| 2026-02-14 | 13F | Rockefeller Capital Management L.P. | 156.334 | -2,61 | 2.617 | 1,87 | ||||
| 2026-02-12 | 13F | Voya Investment Management Llc | 3.088.561 | 4,52 | 51.703 | 9,29 | ||||
| 2026-02-17 | 13F | Warren Averett Asset Management, LLC | 12.242 | 205 | ||||||
| 2026-01-27 | 13F | Regions Financial Corp | 64.395 | 76,89 | 1.078 | 85,05 | ||||
| 2026-02-06 | 13F | EverSource Wealth Advisors, LLC | 4.091 | 8,11 | 68 | 13,33 | ||||
| 2026-02-13 | 13F | NLB Skladi, upravljanje premozenja, d.o.o. | 572.130 | 9.577 | ||||||
| 2026-02-19 | 13F | Mcguire Capital Advisors Inc | 500 | 8 | ||||||
| 2026-02-24 | 13F | MidFirst Bank | 500 | 8 | ||||||
| 2025-09-24 | NP | ACWX - iShares MSCI ACWI ex U.S. ETF | 690.214 | 0,00 | 8.434 | -1,69 | ||||
| 2026-02-13 | 13F | Williams Jones Wealth Management, LLC. | 50.755 | 2,02 | 850 | 6,66 | ||||
| 2026-02-13 | 13F | Itau Unibanco Holding S.A. | 12.592.559 | 88,39 | 210.799 | 96,98 | ||||
| 2026-01-12 | 13F | Canvas Wealth Advisors, LLC | 17.848 | -6,49 | 299 | 2,05 | ||||
| 2026-02-13 | 13F | University of Illinois Foundation | 305.000 | 5.106 | ||||||
| 2026-02-17 | 13F | Metavasi Capital LP | 559.475 | 0,00 | 9.366 | 4,56 | ||||
| 2025-11-14 | 13F | Dynamo Administracao de Recursos Ltda. | 991.524 | -0,75 | 15.874 | 15,82 | ||||
| 2026-01-28 | 13F | United Asset Strategies, Inc. | 53.379 | 1,53 | 894 | 6,18 | ||||
| 2026-02-17 | 13F/A | Northwest & Ethical Investments L.P. | 282.633 | 0,00 | 4.731 | 4,58 | ||||
| 2026-01-23 | 13F | Diversify Advisory Services, LLC | 47.705 | 107,43 | 792 | 113,78 | ||||
| 2026-01-23 | 13F | Carnegie Capital Asset Management, LLC | 605.983 | 1,64 | 10.144 | 6,29 | ||||
| 2026-02-09 | 13F | Fisher Asset Management, LLC | 10.242.185 | -1,88 | 171.454 | 2,60 | ||||
| 2026-02-26 | 13F | Anchor Investment Management, LLC | 2.400 | 0,00 | 40 | 5,26 | ||||
| 2026-02-10 | 13F | Envestnet Asset Management Inc | 3.357.412 | 5,08 | 56.203 | 9,87 | ||||
| 2026-02-17 | 13F | Russell Investments Group, Ltd. | 10.994.156 | 15,33 | 184.119 | 20,65 | ||||
| 2025-10-20 | 13F | Ascent Group, LLC | 0 | -100,00 | 0 | |||||
| 2025-09-26 | NP | FTIHX - Fidelity Total International Index Fund This fund is a listed as child fund of Fmr Llc and if that institution has disclosed ownership in this security, then these positions will not be double counted when calculating total shares and total value | 1.491.563 | 5,10 | 18.227 | 3,32 | ||||
| 2026-02-13 | 13F | Van Eck Associates Corp | 1.011.467 | 253,99 | 17 | 300,00 | ||||
| 2026-01-29 | 13F | State Of Michigan Retirement System | 540.800 | 42,05 | 9.053 | 48,52 | ||||
| 2026-01-27 | 13F | Belpointe Asset Management LLC | 106.367 | 29,63 | 1.781 | 35,57 | ||||
| 2026-02-09 | 13F | Prospera Financial Services Inc | 103.806 | 1.738 | ||||||
| 2026-02-11 | 13F | Inceptionr Llc | 31.449 | 526 | ||||||
| 2026-01-13 | 13F | Mather Group, Llc. | 0 | -100,00 | 0 | |||||
| 2026-02-10 | 13F | Rothschild Investment Llc | Call | 0 | -100,00 | 0 | -100,00 | |||
| 2026-01-30 | 13F | Rachor Investment Advisory Services, LLC | 1.141 | 19 | ||||||
| 2026-01-22 | 13F | Personal Cfo Solutions, Llc | 47.037 | -3,57 | 787 | 0,90 | ||||
| 2025-11-12 | 13F | CIBC Bancorp USA Inc. | 655.954 | 10.502 | ||||||
| 2026-01-26 | 13F | MBM Wealth Consultants, LLC | 50.284 | 1,22 | 842 | 5,79 | ||||
| 2026-02-03 | 13F | Pilgrim Partners Asia Pte Ltd | 71.000 | 0,00 | 1.189 | 4,58 | ||||
| 2026-02-02 | 13F | Danske Bank A/s | 5.074.732 | 515,04 | 84.951 | 543,13 | ||||
| 2026-02-17 | 13F | Snowden Capital Advisors LLC | 96.231 | 4,95 | 1.611 | 9,67 | ||||
| 2025-11-14 | 13F | Strategic Wealth Partners, Ltd. | 656 | 0,00 | 11 | 11,11 | ||||
| 2026-01-16 | 13F | Matauro, Llc | 147.078 | 804,59 | 2.462 | 846,92 | ||||
| 2026-01-15 | 13F | Westmount Partners, LLC | 22.351 | -24,01 | 374 | -16,14 | ||||
| 2026-02-03 | 13F | Morse Asset Management, Inc | 1.825 | 31 | ||||||
| 2026-01-16 | 13F | Udine Wealth Management, Inc. | 216.160 | 1,75 | 4 | -99,91 | ||||
| 2026-02-05 | 13F | Pinnacle Associates Ltd | 10.755 | 0,00 | 180 | 4,65 | ||||
| 2026-02-10 | 13F | Kentucky Retirement Systems Insurance Trust Fund | 88.029 | 0,00 | 1.474 | 4,54 | ||||
| 2026-01-07 | 13F | Magnus Financial Group LLC | 78.957 | -0,01 | 1.322 | 4,51 | ||||
| 2026-01-23 | 13F | Gibbs Wealth Management | 21.707 | -14,07 | 379 | -6,19 | ||||
| 2026-02-13 | 13F | National Bank Of Canada /fi/ | 1.566.578 | 22,16 | 26.228 | 27,76 | ||||
| 2026-02-10 | 13F | Dynasty Wealth Management, Llc | 28.508 | 4,72 | 477 | 9,66 | ||||
| 2026-02-10 | 13F | Goldman Sachs Group Inc | Put | 10.391.800 | 54,41 | 173.959 | 61,45 | |||
| 2026-02-17 | 13F | Quantitative Investment Management, LLC | 98.290 | -58,04 | 2 | -66,67 | ||||
| 2026-01-21 | 13F | Canton Hathaway, LLC | 4.013 | 67 | ||||||
| 2026-02-10 | 13F | Goldman Sachs Group Inc | 33.733.024 | -1,01 | 564.691 | 3,50 | ||||
| 2026-02-10 | 13F | Goldman Sachs Group Inc | Call | 50.000 | -88,89 | 837 | -88,38 | |||
| 2026-02-17 | 13F | EdgePoint Investment Group Inc. | 17.012 | 25,34 | 285 | 30,88 | ||||
| 2026-03-11 | 13F | Larry Mathis Financial Planning, LLC | 43.100 | 721 | ||||||
| 2025-10-24 | 13F | Opal Wealth Advisors, LLC | 0 | -100,00 | 0 | |||||
| 2026-02-09 | 13F | Unison Asset Management LLC | 1.313.149 | 2,37 | 21.984 | 7,05 | ||||
| 2026-02-12 | 13F | Ensign Peak Advisors, Inc | 167.000 | 0,00 | 2.796 | 4,56 | ||||
| 2026-02-17 | 13F | Citadel Advisors Llc | Put | 9.597.900 | -31,07 | 160.669 | -27,92 | |||
| 2025-09-26 | NP | TEMRX - TIAA-CREF Emerging Markets Equity Fund Retail Class | 0 | -100,00 | 0 | -100,00 | ||||
| 2026-02-10 | 13F | Eurizon SLJ Capital Ltd | 104.164 | 1.744 | ||||||
| 2026-02-17 | 13F | Citadel Advisors Llc | 710.961 | -71,89 | 11.901 | -70,61 | ||||
| 2026-02-17 | 13F | Citadel Advisors Llc | Call | 15.380.600 | -14,77 | 257.471 | -10,89 | |||
| 2026-02-17 | 13F | Balyasny Asset Management Llc | 0 | -100,00 | 0 | |||||
| 2026-01-13 | 13F | Stephens Consulting, LLC | 100 | 0,00 | 2 | 0,00 | ||||
| 2026-02-17 | 13F | Canada Pension Plan Investment Board | 19.668.362 | -23,36 | 329.248 | -19,87 | ||||
| 2026-02-17 | 13F | Nissay Asset Management Corp /japan/ /adv | 521.686 | 876,04 | 8.733 | 921,40 | ||||
| 2026-02-18 | 13F | VGI Partners Ltd | 201.390 | 1.751,86 | 3.371 | 1.837,36 | ||||
| 2026-02-17 | 13F | Think Investments LP | Call | 1.700.000 | 28.458 | |||||
| 2026-01-16 | 13F | PFS Partners, LLC | 518 | 0,00 | 9 | 0,00 | ||||
| 2025-11-13 | 13F | Riggs Asset Managment Co. Inc. | 0 | -100,00 | 0 | -100,00 | ||||
| 2026-02-17 | 13F | Polymer Capital Management (US) LLC | 16.892 | 5,65 | 283 | 10,59 | ||||
| 2026-01-21 | 13F | Portside Wealth Group, LLC | 14.374 | -9,31 | 241 | -5,14 | ||||
| 2026-01-28 | 13F | One River Asset Management, LLC | Call | 88.300 | 1.478 | |||||
| 2026-01-28 | 13F | One River Asset Management, LLC | Put | 88.300 | 1.478 | |||||
| 2026-02-17 | 13F | Limestone Investment Advisors LP | 28.277 | 0,00 | 473 | 4,65 | ||||
| 2025-09-23 | NP | GEMHX - Goldman Sachs Emerging Markets Equity ex. China Fund Class A Shares | 11.716 | 89,52 | 143 | 88,16 | ||||
| 2025-09-26 | NP | EEMO - Invesco S&P Emerging Markets Momentum ETF This fund is a listed as child fund of Invesco Ltd. and if that institution has disclosed ownership in this security, then these positions will not be double counted when calculating total shares and total value | 11.850 | -0,16 | 145 | -2,04 | ||||
| 2026-02-02 | 13F | CENTRAL TRUST Co | 14.400 | 148,28 | 241 | 161,96 | ||||
| 2026-02-17 | 13F | Limestone Investment Advisors LP | Call | 34.000 | -45,25 | 569 | -42,76 | |||
| 2026-01-15 | 13F | Nisa Investment Advisors, Llc | 210.695 | -3,22 | 3.527 | 1,21 | ||||
| 2026-02-17 | 13F | Limestone Investment Advisors LP | Put | 37.200 | -67,02 | 623 | -65,54 | |||
| 2025-09-24 | NP | SWMIX - Laudus International MarketMasters Fund Select Shares | 149.385 | 36,55 | 1.825 | 34,29 | ||||
| 2025-09-26 | NP | DAACX - Diversified Equity Fund | 11.407 | -33,64 | 139 | -38,77 | ||||
| 2026-02-17 | 13F | Lazard Asset Management Llc | 1.771.570 | 23,79 | 29.656 | 29,43 | ||||
| 2025-09-26 | NP | FPADX - Fidelity Emerging Markets Index Fund This fund is a listed as child fund of Fmr Llc and if that institution has disclosed ownership in this security, then these positions will not be double counted when calculating total shares and total value | 3.591.198 | 5,84 | 43.884 | 4,05 | ||||
| 2026-02-10 | 13F | Fideuram Asset Management (Ireland) dac | 50.433 | 714 | ||||||
| 2025-11-06 | 13F | Financial Advocates Investment Management | 0 | -100,00 | 0 | -100,00 | ||||
| 2026-02-13 | 13F | Ubs Asset Management Americas Inc | 20.820.175 | 5,42 | 348.530 | 10,23 | ||||
| 2026-02-09 | 13F | Wcm Investment Management, Llc | 73.938.595 | -0,73 | 1.248.083 | 5,06 | ||||
| 2026-02-17 | 13F | Susquehanna Fundamental Investments, Llc | 19.600 | 328 | ||||||
| 2025-09-23 | NP | SLANX - DWS Latin America Equity Fund Class A | 84.526 | -79,75 | 1.033 | -83,61 | ||||
| 2025-12-15 | 13F/A | Hudson Bay Capital Management LP | 0 | -100,00 | 0 | -100,00 | ||||
| 2026-02-17 | 13F | Glenmede Trust Co Na | 95.945 | -44,94 | 1.606 | -9,98 | ||||
| 2025-11-07 | 13F | Sierra Ocean, Llc | 0 | -100,00 | 0 | |||||
| 2026-02-11 | 13F | O'shaughnessy Asset Management, Llc | 216.966 | 43,07 | 3.632 | 49,65 | ||||
| 2026-02-12 | 13F | Mount Yale Investment Advisors, LLC | 19.979 | 334 | ||||||
| 2026-02-05 | 13F | Mount Lucas Management LP | 47.100 | -5,80 | 788 | -1,50 | ||||
| 2026-02-10 | 13F | a16z Perennial Management, L.P. | 13.748.400 | -2,74 | 230.148 | 1,70 | ||||
| 2026-02-12 | 13F | Long Walk Management Lp | 3.792.000 | 10,55 | 63.478 | 15,60 | ||||
| 2026-01-13 | 13F | Norden Group Llc | 12.778 | 214 | ||||||
| 2026-02-13 | 13F | JustInvest LLC | 83.129 | 8,12 | 1.392 | 13,09 | ||||
| 2026-01-26 | 13F | Private Trust Co Na | 1.219 | 0,00 | 20 | 5,26 | ||||
| 2026-02-10 | 13F | Rothschild Investment Llc | 24.550 | 2,15 | 411 | 6,77 | ||||
| 2025-10-24 | 13F | Hemington Wealth Management | 370 | 0,00 | 0 | |||||
| 2025-11-14 | 13F | ExodusPoint Capital Management, LP | 473.107 | -50,49 | 7.574 | 58.161,54 | ||||
| 2026-02-12 | 13F | Advisors Asset Management, Inc. | 96.831 | 31,96 | 1.621 | 37,99 | ||||
| 2026-02-11 | 13F | LTS Liquid Investments LLC | 748.367 | 12.528 | ||||||
| 2026-01-26 | 13F | KBC Group NV | 1.041.615 | 12,98 | 17 | 21,43 | ||||
| 2026-01-30 | 13F | Interchange Capital Partners, LLC | 45.409 | 11,50 | 760 | 16,56 | ||||
| 2026-02-10 | 13F | Channing Global Advisors, Llc | 90 | 2 | ||||||
| 2026-01-05 | 13F | GAMMA Investing LLC | 11.988 | 18,74 | 201 | 24,22 | ||||
| 2026-02-13 | 13F | Wbi Investments, Inc. | 30.295 | 507 | ||||||
| 2026-02-13 | 13F | Thornburg Investment Management Inc | 1.069.535 | -10,23 | 17.904 | -6,13 | ||||
| 2026-01-23 | 13F | Sumitomo Mitsui Trust Holdings, Inc. | 12.820.231 | -6,39 | 214.611 | -2,12 | ||||
| 2026-01-23 | 13F | Farther Finance Advisors, LLC | 16.994 | 83,16 | 284 | 91,89 | ||||
| 2026-02-09 | 13F | Kestra Investment Management, LLC | 11.733 | 196 | ||||||
| 2026-02-17 | 13F | Liontrust Investment Partners LLP | 793.271 | 64,05 | 13.279 | 71,54 | ||||
| 2026-02-09 | 13F | Huntington National Bank | 2.529 | 3,61 | 42 | 7,69 | ||||
| 2026-01-20 | 13F | J2 Capital Management Inc | 33.988 | -4,30 | 569 | 0,00 | ||||
| 2025-09-25 | NP | PQEMX - PGIM QMA Emerging Markets Equity Fund Class R6 | 4.400 | 54 | ||||||
| 2026-02-02 | 13F | Equitable Trust Co | 178.505 | -0,58 | 2.988 | 3,97 | ||||
| 2026-02-02 | 13F | Varma Mutual Pension Insurance Co | 424.600 | 10,60 | 7.108 | 15,64 | ||||
| 2025-11-12 | 13F | Edgestream Partners, L.P. | 0 | -100,00 | 0 | |||||
| 2026-02-05 | 13F | High Note Wealth, LLC | 10 | 0,00 | 0 | |||||
| 2026-02-13 | 13F | First Trust Advisors Lp | 3.410.577 | 63,31 | 57.093 | 70,75 | ||||
| 2025-11-14 | 13F | Alpine Global Management, LLC | 0 | -100,00 | 0 | |||||
| 2026-02-06 | 13F | Americana Partners, LLC | 47.698 | 48,17 | 798 | 54,95 | ||||
| 2026-01-07 | 13F | Aventura Private Wealth, LLC | 8.895 | 0,00 | 149 | 4,23 | ||||
| 2026-02-13 | 13F | Banco Santander, S.A. | 75.521 | 23,70 | 1.264 | 29,38 | ||||
| 2025-11-14 | 13F | Ulysses Management LLC | 0 | -100,00 | 0 | |||||
| 2025-11-21 | 13F/A | Royal Bank Of Canada | Put | 0 | -100,00 | 0 | -100,00 | |||
| 2026-01-30 | 13F | Jennison Associates Llc | 39.370.791 | 82,60 | 659.067 | 90,93 | ||||
| 2026-02-06 | 13F | Saranac Partners Ltd | 0 | -100,00 | 0 | -100,00 | ||||
| 2026-02-13 | 13F | Fortis Capital Management LLC | 28.441 | 65,36 | 476 | 73,09 | ||||
| 2026-02-17 | 13F | Hood River Capital Management LLC | 930 | 16 | ||||||
| 2026-02-10 | 13F | Norges Bank | 45.626.792 | 763.792 | ||||||
| 2026-01-30 | 13F/A | M&t Bank Corp | 282.863 | 1,07 | 4.735 | 5,69 | ||||
| 2026-02-13 | 13F | Barclays Plc | 9.855.032 | -16,41 | 164.973 | -12,59 | ||||
| 2026-02-10 | 13F | DiMeo Schneider & Associates, L.L.C. | 17.962 | 301 | ||||||
| 2025-09-26 | NP | FSMDX - Fidelity Mid Cap Index Fund This fund is a listed as child fund of Fmr Llc and if that institution has disclosed ownership in this security, then these positions will not be double counted when calculating total shares and total value | 0 | -100,00 | 0 | -100,00 | ||||
| 2025-09-26 | NP | ALMRX - Alger MidCap Growth Institutional Fund Class I | 0 | -100,00 | 0 | -100,00 | ||||
| 2026-02-13 | 13F | Mlp3, Llc | 26.595 | 445 | ||||||
| 2026-02-13 | 13F | Public Sector Pension Investment Board | 0 | -100,00 | 0 | |||||
| 2026-02-12 | 13F | BRYN MAWR TRUST Co | 973 | -91,84 | 16 | -91,62 | ||||
| 2026-02-03 | 13F | Bluebird Wealth Management LLC | 24.224 | 406 | ||||||
| 2026-02-13 | 13F | LTS One Management LP | 866.500 | -13,35 | 14.505 | -9,40 | ||||
| 2026-02-13 | 13F | Centaurus Financial, Inc. | 0 | -100,00 | 0 | |||||
| 2026-01-13 | 13F | Matrix Trust Co | 33.506 | 1 | ||||||
| 2026-02-12 | 13F | Polen Capital Management Llc | 0 | -100,00 | 0 | |||||
| 2026-02-17 | 13F | Modern Wealth Management, LLC | 0 | -100,00 | 0 | |||||
| 2025-09-24 | NP | DYNF - BlackRock U.S. Equity Factor Rotation ETF This fund is a listed as child fund of BlackRock, Inc. and if that institution has disclosed ownership in this security, then these positions will not be double counted when calculating total shares and total value | 315 | 0,00 | 4 | 0,00 | ||||
| 2025-10-29 | 13F/A | J.Safra Asset Management Corp | 0 | -100,00 | 0 | |||||
| 2026-01-14 | 13F | Spire Wealth Management | 182 | 23,81 | 3 | 50,00 | ||||
| 2026-01-13 | 13F | CoreCap Advisors, LLC | 20 | 0,00 | 0 | |||||
| 2026-01-28 | 13F | Teacher Retirement System Of Texas | 420.406 | -12,78 | 7.038 | -8,80 | ||||
| 2026-02-10 | 13F | Daiwa Securities Group Inc. | 340.882 | 89,43 | 6 | 150,00 | ||||
| 2026-02-13 | 13F | Aigen Investment Management, Lp | 0 | -100,00 | 0 | |||||
| 2026-01-14 | 13F | Exchange Traded Concepts, Llc | Put | 0 | -100,00 | 0 | -100,00 | |||
| 2026-02-03 | 13F | BHK Investment Advisors, LLC | 30.000 | 502 | ||||||
| 2026-02-06 | 13F | TPG Financial Advisors, LLC | 80.832 | -13,37 | 1.353 | -9,38 | ||||
| 2026-01-29 | 13F | Rakuten Securities, Inc. | 46.051 | 82,56 | 771 | 91,07 | ||||
| 2026-02-12 | 13F | LWM Advisory Services, LLC | 30.210 | -26,46 | 506 | -23,14 | ||||
| 2026-02-12 | 13F | Principal Securities, Inc. | 0 | -100,00 | 0 | |||||
| 2025-10-10 | 13F | Focused Wealth Management, Inc | 0 | -100,00 | 0 | |||||
| 2025-10-10 | 13F | Focused Wealth Management, Inc | Call | 0 | -100,00 | 0 | ||||
| 2025-11-13 | 13F | Banco BTG Pactual S.A. | Call | 0 | -100,00 | 0 | -100,00 | |||
| 2026-01-29 | 13F | UMA Financial Services, Inc. | 4.032 | 143,92 | 67 | 157,69 | ||||
| 2026-02-11 | 13F | Picton Mahoney Asset Management | 78.428 | 1.313 | ||||||
| 2026-01-12 | 13F | Legacy Wealth Asset Management, LLC | 49.473 | -2,25 | 828 | 2,22 | ||||
| 2026-02-12 | 13F | Pitcairn Co | 0 | -100,00 | 0 | |||||
| 2026-03-04 | 13F | SHP Wealth Management | 112 | 2 | ||||||
| 2026-02-13 | 13F | Rafferty Asset Management, LLC | 0 | -100,00 | 0 | |||||
| 2026-02-05 | 13F/A | Truxt Investmentos Ltda. | 1.385.745 | 22.186 | ||||||
| 2026-02-17 | 13F | Laird Norton Trust Company, Llc | 181.234 | 3.034 | ||||||
| 2026-02-13 | 13F | Walleye Trading LLC | Call | 1.382.700 | 29,21 | 23.146 | 35,10 | |||
| 2025-10-02 | 13F | TT International Asset Management LTD | 0 | -100,00 | 0 | |||||
| 2026-02-13 | 13F | Inspire Advisors, LLC | 25.361 | -39,75 | 425 | -37,00 | ||||
| 2025-09-25 | NP | TIER - T. Rowe Price International Equity Research ETF | 1.900 | 23 | ||||||
| 2026-02-17 | 13F | Main Street Financial Solutions, LLC | 0 | -100,00 | 0 | |||||
| 2026-02-17 | 13F | Utah Retirement Systems | 552.690 | 0,00 | 9.252 | 4,57 | ||||
| 2026-02-04 | 13F | Blackhawk Capital Partners LLC. | 13.627 | 228 | ||||||
| 2026-02-10 | 13F/A | Northwestern Mutual Wealth Management Co | 18.957 | 28,85 | 317 | 34,89 | ||||
| 2026-02-17 | 13F | FIL Ltd | 25.705.380 | -6,75 | 430.308 | -2,50 | ||||
| 2025-11-10 | 13F | Dakota Wealth Management | 0 | -100,00 | 0 | |||||
| 2026-02-12 | 13F | NZS Capital, LLC | 3.066.393 | 0,93 | 51.331 | 5,53 | ||||
| 2026-02-13 | 13F | Granville Capital, Inc. | 31.473 | 527 | ||||||
| 2026-02-17 | 13F | Jain Global LLC | 636.015 | 26,44 | 10.647 | 32,20 | ||||
| 2026-02-17 | 13F | Kemnay Advisory Services Inc. | 1.417 | 24 | ||||||
| 2026-02-12 | 13F | Empire Financial Management Company, LLC | 91.044 | 1,12 | 1.524 | 5,76 | ||||
| 2026-02-19 | 13F | TMB Capital Partners, LLC | 11.211 | 188 | ||||||
| 2026-02-09 | 13F | Bleakley Financial Group, LLC | 38.447 | 13,74 | 644 | 18,85 | ||||
| 2026-02-17 | 13F | Avala Global LP | 5.765.200 | 19,84 | 96.509 | 25,31 | ||||
| 2025-09-29 | NP | DUBS - Aptus Large Cap Enhanced Yield ETF | 16.915 | -2,12 | 207 | -3,74 | ||||
| 2026-01-30 | 13F | Us Bancorp \de\ | 219.867 | 2,99 | 3.681 | 7,67 | ||||
| 2026-02-12 | 13F | Quadrant Capital Group Llc | 60.016 | 0,36 | 1.005 | 4,91 | ||||
| 2026-02-13 | 13F | Sands Capital Ventures, LLC | 6.861.399 | -4,38 | 114.860 | -0,02 | ||||
| 2026-02-17 | 13F | Graham Capital Management, L.P. | 302.035 | -33,60 | 5.056 | -30,57 | ||||
| 2025-11-21 | 13F | Nebula Research & Development LLC | 0 | -100,00 | 0 | |||||
| 2026-02-06 | 13F | Vestmark Advisory Solutions, Inc. | 70.714 | 93,23 | 1.184 | 102,22 | ||||
| 2026-02-13 | 13F | Eschler Asset Management LLP | 70.000 | -18,24 | 1.172 | -14,53 | ||||
| 2026-02-05 | 13F | Amalgamated Bank | 310.387 | 15,07 | 5 | 25,00 | ||||
| 2026-01-16 | 13F | Crewe Advisors LLC | 98 | 2 | ||||||
| 2026-02-13 | 13F | Rhumbline Advisers | 3.559.894 | -2,57 | 59.593 | 1,87 | ||||
| 2025-11-25 | 13F/A | BlueCrest Capital Management Ltd | Call | 0 | -100,00 | 0 | -100,00 | |||
| 2026-02-04 | 13F | Proem Advisors LLC | 425.614 | 0,00 | 7.125 | 4,55 | ||||
| 2026-02-11 | 13F | Empowered Funds, LLC | 323.214 | 40,87 | 5.411 | 47,29 | ||||
| 2026-02-17 | 13F | Moore Capital Management, Lp | 614.240 | -82,26 | 10.282 | -81,45 | ||||
| 2026-02-17 | 13F | Wellington Management Group Llp | 2.792.652 | 2,29 | 46.749 | 6,95 | ||||
| 2026-01-30 | 13F | State of New Jersey Common Pension Fund D | 2.069.304 | 0,00 | 34.640 | 4,56 | ||||
| 2025-11-14 | 13F | AXA Investment Managers S.A. | 184.095 | 2.947 | ||||||
| 2026-01-20 | 13F | AdvisorNet Financial, Inc | 34.523 | -1,71 | 578 | 2,67 | ||||
| 2026-02-11 | 13F | Cerity Partners LLC | 1.208.164 | 92,10 | 20.225 | 100,87 | ||||
| 2026-02-17 | 13F | Ardsley Advisory Partners Lp | 640.000 | 2,40 | 10.707 | 7,01 | ||||
| 2026-02-23 | 13F | Mv Capital Management, Inc. | 19 | 0,00 | 0 | |||||
| 2026-02-03 | 13F | Orion Capital Management LLC | 23.900 | 12,21 | 400 | 17,30 | ||||
| 2026-02-17 | 13F | Atreides Management, LP | 3.272.998 | 30,43 | 54.790 | 36,38 | ||||
| 2026-02-05 | 13F | ANTIPODES PARTNERS Ltd | 3.407.926 | -2,41 | 57.053 | 2,04 | ||||
| 2026-02-13 | 13F | Colony Group, LLC | 6.205.330 | 39,23 | 103.877 | 45,58 | ||||
| 2026-02-17 | 13F | Bamco Inc /ny/ | 3.335.290 | 91,82 | 55.833 | 100,57 | ||||
| 2026-01-29 | 13F | Ariose Capital Management Ltd | 0 | -100,00 | 0 | |||||
| 2026-02-03 | 13F | Ethic Inc. | 67.526 | 2,07 | 1.130 | 6,70 | ||||
| 2026-02-17 | 13F | Driehaus Capital Management Llc | 7.706.057 | 91,85 | 128.999 | 100,60 | ||||
| 2026-02-06 | 13F | Cumberland Partners Ltd | 285.000 | 137,50 | 4.771 | 148,31 | ||||
| 2026-01-07 | 13F | Harbour Capital Advisors, LLC | 87.595 | -5,20 | 1.491 | 6,66 | ||||
| 2026-02-17 | 13F | Engle Capital Management, L.P. | 393.000 | -40,71 | 6.579 | -38,01 | ||||
| 2026-01-09 | 13F | Assenagon Asset Management S.A. | 27.590.473 | 71,35 | 461.865 | 79,16 | ||||
| 2026-02-17 | 13F | Cederberg Capital Ltd | 382.900 | 0,00 | 6 | 0,00 | ||||
| 2025-09-25 | NP | TBDAX - PGIM JENNISON DIVERSIFIED GROWTH FUND Class A | 55.343 | -16,25 | 676 | -17,66 | ||||
| 2026-02-05 | 13F | Center for Financial Planning, Inc. | 3.787 | 0,00 | 63 | 5,00 | ||||
| 2026-02-17 | 13F | Credit Agricole S A | 1.340.284 | 5,82 | 22.436 | 10,65 | ||||
| 2026-01-20 | 13F | Cigna Investments Inc /new | 86.161 | -2,24 | 1 | 0,00 | ||||
| 2026-02-05 | 13F | PBCay One RSC Ltd | 539.130 | 9.025 | ||||||
| 2026-01-26 | 13F | Mirae Asset Global Investments Co., Ltd. | 162.132 | 4,83 | 2.714 | 9,61 | ||||
| 2026-01-30 | 13F | Citizens Financial Group Inc/ri | 69.817 | -0,36 | 1.169 | 4,19 | ||||
| 2026-02-17 | 13F | Squadra Investments - Gestao De Recursos Ltda. | Put | 3.061.800 | 524,86 | 51.255 | 553,42 | |||
| 2025-09-26 | NP | EPASX - EP Emerging Markets Small Companies Fund Class A | 135.000 | 1.650 | ||||||
| 2026-02-17 | 13F | Squadra Investments - Gestao De Recursos Ltda. | 9.144.786 | -20,85 | 153.084 | -17,25 | ||||
| 2026-02-13 | 13F | Toroso Investments, LLC | 3.317.337 | -7,85 | 55.532 | -3,65 | ||||
| 2026-02-10 | 13F | Root Financial Partners, LLC | 326 | 23,95 | 5 | 25,00 | ||||
| 2026-02-06 | 13F | Copia Wealth Management | 129 | 2 | ||||||
| 2026-02-05 | 13F | Western Wealth Management, LLC | 26.115 | -3,86 | 437 | 0,69 | ||||
| 2026-02-12 | 13F | Dimensional Fund Advisors Lp | 27.404 | -9,87 | 459 | -5,76 | ||||
| 2026-02-13 | 13F | Toroso Investments, LLC | Put | 354.100 | 5.928 | |||||
| 2025-11-17 | 13F | Sender Co & Partners, Inc. | 0 | -100,00 | 0 | -100,00 | ||||
| 2026-02-09 | 13F | Emerald Advisers, Llc | 20.752 | -4,30 | 347 | 0,00 | ||||
| 2026-02-17 | 13F | Seldon Capital Lp | 666.652 | 0,00 | 11.160 | 4,55 | ||||
| 2026-02-17 | 13F | ThornTree Capital Partners LP | 2.340.774 | -14,07 | 39.185 | -10,15 | ||||
| 2026-01-27 | 13F | Genoa Capital Gestora de Recursos Ltda. | 231.103 | 3.869 | ||||||
| 2026-02-10 | 13F | Glynn Capital Management Llc | 1.222.151 | -12,23 | 20.459 | -8,23 | ||||
| 2025-09-24 | NP | BlackRock ETF Trust - BlackRock Future Financial and Technology ETF This fund is a listed as child fund of BlackRock, Inc. and if that institution has disclosed ownership in this security, then these positions will not be double counted when calculating total shares and total value | 28.469 | 26,75 | 348 | 24,37 | ||||
| 2026-02-13 | 13F | Walleye Capital LLC | Call | 80.100 | -11,20 | 1.341 | -7,20 | |||
| 2026-02-13 | 13F | Knollwood Investment Advisory, LLC | 59.800 | 0,00 | 1.001 | 4,60 | ||||
| 2026-02-17 | 13F | Man Group plc | 7.529.936 | 27,50 | 126.051 | 33,32 | ||||
| 2026-02-10 | 13F | Parametrica Management Ltd | 154.368 | 34,98 | 2.584 | 41,20 | ||||
| 2026-02-13 | 13F | Walleye Capital LLC | Put | 94.300 | 230,88 | 1.579 | 246,05 | |||
| 2026-02-17 | 13F | Aquatic Capital Management LLC | 0 | -100,00 | 0 | |||||
| 2026-02-11 | 13F | Capital International Inc /ca/ | 1.016.110 | 0,62 | 17.010 | 5,20 | ||||
| 2026-02-13 | 13F | Walleye Capital LLC | 774.363 | -57,41 | 12.963 | -55,47 | ||||
| 2025-11-12 | 13F | CMT Capital Markets Trading GmbH | 0 | -100,00 | 0 | |||||
| 2025-09-29 | NP | LMBO - Direxion Daily Crypto Industry Bull 2X Shares | 21.861 | 61,59 | 267 | 58,93 | ||||
| 2025-10-30 | 13F | Twin Peaks Wealth Advisors, LLC | 0 | -100,00 | 0 | -100,00 | ||||
| 2026-02-06 | 13F | Global Retirement Partners, LLC | 16.245 | -15,31 | 272 | -11,73 | ||||
| 2026-02-12 | 13F | Integrated Quantitative Investments LLC | 113.357 | 1.898 | ||||||
| 2025-09-26 | NP | REMSX - Emerging Markets Fund Class S | 288.706 | 47,57 | 3.528 | 45,08 | ||||
| 2026-02-06 | 13F | AMF Pensionsforsakring AB | 322.639 | 28,21 | 5.401 | 34,06 | ||||
| 2026-01-23 | 13F | Aspect Partners, LLC | 244 | 0,00 | 4 | 33,33 | ||||
| 2026-02-17 | 13F | Lone Pine Capital Llc | 29.630.237 | 16,62 | 496.010 | 21,94 | ||||
| 2026-01-15 | 13F | Highline Wealth Partners Llc | 366 | 7,65 | 6 | 20,00 | ||||
| 2026-02-14 | 13F | American Trust | 12.099 | 203 | ||||||
| 2026-01-21 | 13F | Sowell Financial Services LLC | 12.952 | 4,85 | 217 | 9,64 | ||||
| 2026-02-17 | 13F | Alliancebernstein L.p. | 6.937.660 | 26,65 | 116.136 | 32,42 | ||||
| 2026-02-14 | 13F | Whipplewood Advisors, LLC | 300 | 5 | ||||||
| 2026-02-10 | 13F | Savant Capital, LLC | 14.219 | -83,56 | 238 | -82,82 | ||||
| 2026-02-17 | 13F | Discovery Capital Management, Llc / Ct | 427.300 | -38,21 | 7.153 | -35,38 | ||||
| 2026-01-29 | 13F | D.a. Davidson & Co. | 13.922 | -4,94 | 233 | -0,43 | ||||
| 2026-02-03 | 13F | D.B. Root & Company, LLC | 10.588 | 177 | ||||||
| 2026-02-13 | 13F | Parkside Financial Bank & Trust | 1.073 | 2,88 | 18 | 6,25 | ||||
| 2026-02-17 | 13F | Signature Equity Partners, LLC | 101 | 2 | ||||||
| 2026-02-10 | 13F | National Pension Service | 873.882 | 5,65 | 14.629 | 10,47 | ||||
| 2026-02-13 | 13F | Marshall Wace, Llp | 31.476.485 | 526.916 | ||||||
| 2025-10-31 | 13F | Whittier Trust Co Of Nevada Inc | 0 | -100,00 | 0 | |||||
| 2025-11-14 | 13F | Point72 (DIFC) Ltd | 29.225 | -97,05 | 468 | -96,57 | ||||
| 2025-09-26 | NP | FZILX - Fidelity ZERO International Index Fund This fund is a listed as child fund of Fmr Llc and if that institution has disclosed ownership in this security, then these positions will not be double counted when calculating total shares and total value | 637.620 | 10,96 | 7.792 | 9,09 | ||||
| 2026-02-11 | 13F | CenterBook Partners LP | 233.562 | 3.910 | ||||||
| 2025-09-25 | NP | NEWFX - NEW WORLD FUND INC Class A | 61.097.771 | -6,95 | 746.615 | -8,52 | ||||
| 2025-11-14 | 13F | Point72 (DIFC) Ltd | Put | 28.600 | -75,93 | 458 | -71,95 | |||
| 2026-02-13 | 13F | Charles Schwab Investment Management Inc | 504.920 | 8,22 | 8.452 | 13,16 | ||||
| 2025-11-14 | 13F | Point72 (DIFC) Ltd | Call | 32.000 | -79,54 | 512 | -76,13 | |||
| 2025-09-25 | NP | Clough Global Opportunities Fund | 0 | -100,00 | 0 | -100,00 | ||||
| 2025-09-25 | NP | Clough Global Equity Fund | 0 | -100,00 | 0 | -100,00 | ||||
| 2026-02-17 | 13F | Advisor Group Holdings, Inc. | 149.460 | -15,79 | 2.502 | -9,38 | ||||
| 2026-02-12 | 13F | APG Asset Management N.V. | 1.797.354 | -1,10 | 25.619 | 3,46 | ||||
| 2026-01-28 | 13F | M&t Bank Corp | Call | 3 | 0 | |||||
| 2025-09-25 | NP | PDEAX - PGIM JENNISON EMERGING MARKETS EQUITY OPPORTUNITIES FUND Class A | 1.243.812 | -25,14 | 15.199 | -26,40 | ||||
| 2026-02-11 | 13F | Investors Towarzystwo Funduszy Inwestycyjnych Spolka Akcyjna | 154.510 | 2.586 | ||||||
| 2025-09-24 | NP | AACRX - Strategic Allocation: Conservative Fund R Class This fund is a listed as child fund of American Century Companies Inc and if that institution has disclosed ownership in this security, then these positions will not be double counted when calculating total shares and total value | 3.577 | -73,23 | 44 | -74,10 | ||||
| 2026-02-12 | 13F | Insigneo Advisory Services, Llc | 34.053 | -63,29 | 570 | -61,62 | ||||
| 2026-02-17 | 13F | Trexquant Investment LP | 746.555 | -46,11 | 12.497 | -43,65 | ||||
| 2026-02-04 | 13F | Ameritas Advisory Services, LLC | 22.615 | 13,07 | 379 | 18,13 | ||||
| 2026-02-17 | 13F | Mirabella Financial Services Llp | 333.946 | 5.590 | ||||||
| 2025-09-26 | NP | FDKFX - Fidelity International Discovery K6 Fund This fund is a listed as child fund of Fmr Llc and if that institution has disclosed ownership in this security, then these positions will not be double counted when calculating total shares and total value | 98.628 | 0,00 | 1.205 | -1,63 | ||||
| 2026-02-11 | 13F | Group One Trading, L.p. | 233.459 | -36,18 | 3.908 | -33,27 | ||||
| 2025-11-17 | 13F | LGT Financial Advisors LLC | 0 | -100,00 | 0 | |||||
| 2025-09-24 | NP | BLACKROCK FUNDS - BlackRock Advantage Emerging Markets Fund Investor A Shares | 7.796 | -11,22 | 95 | -28,03 | ||||
| 2025-09-25 | NP | RPGEX - T. Rowe Price Global Growth Stock Fund This fund is a listed as child fund of Price T Rowe Associates Inc /md/ and if that institution has disclosed ownership in this security, then these positions will not be double counted when calculating total shares and total value | 308.750 | -30,49 | 3.773 | -31,67 | ||||
| 2026-02-17 | 13F | Duquesne Family Office LLC | 0 | -100,00 | 0 | -100,00 | ||||
| 2025-09-23 | NP | LBGAX - ClearBridge Mid Cap Growth Fund Class A This fund is a listed as child fund of Clearbridge, Llc and if that institution has disclosed ownership in this security, then these positions will not be double counted when calculating total shares and total value | 0 | -100,00 | 0 | -100,00 | ||||
| 2026-02-17 | 13F | Two Sigma Securities, Llc | 43.157 | 722 | ||||||
| 2025-11-14 | 13F | Axa S.a. | 0 | -100,00 | 0 | |||||
| 2026-02-11 | 13F | Gordian Capital Singapore Pte Ltd | 142.000 | 18,33 | 2.377 | 23,74 | ||||
| 2026-02-17 | 13F | Dynamo Internacional Gestao De Recursos Ltda. | 710.777 | -2,60 | 11.898 | 1,85 | ||||
| 2025-09-29 | NP | LFGY - YieldMax(TM) Crypto Industry & Tech Portfolio Option Income ETF | 0 | -100,00 | 0 | -100,00 | ||||
| 2025-11-14 | 13F | Sc Us (ttgp), Ltd. | 0 | -100,00 | 0 | -100,00 | ||||
| 2025-09-26 | NP | ALGAX - Alger International Focus Fund Class A | 197.528 | 62,59 | 2.414 | 59,80 | ||||
| 2026-02-13 | 13F | Victory Capital Management Inc | 0 | -100,00 | 0 | |||||
| 2025-09-25 | NP | PRJAX - PGIM Jennison Global Opportunities Fund Class A | 7.187.587 | 19,27 | 87.832 | 17,25 | ||||
| 2026-02-12 | 13F | Steward Partners Investment Advisory, Llc | 265.692 | 70,54 | 4.448 | 78,31 | ||||
| 2026-01-23 | 13F | Westside Investment Management, Inc. | 1.300 | 11,88 | 22 | 29,41 | ||||
| 2026-02-17 | 13F | Interval Partners, LP | 263.788 | 4.416 | ||||||
| 2026-02-09 | 13F | Atlantic Trust, LLC | 367 | 56,84 | 6 | 100,00 | ||||
| 2026-02-10 | 13F | Td Asset Management Inc | 808.952 | -13,06 | 13.542 | -9,10 | ||||
| 2025-11-14 | 13F | Saba Capital Management, L.P. | 0 | -100,00 | 0 | -100,00 | ||||
| 2026-02-17 | 13F | Royal Bank Of Canada | 1.413.390 | -73,01 | 23.660 | -71,78 | ||||
| 2026-02-17 | 13F | Comprehensive Financial Management LLC | 3.854.648 | 0,00 | 64.527 | 4,56 | ||||
| 2026-02-02 | 13F | Triasima Portfolio Management inc. | 163.386 | 4,44 | 2.735 | 9,23 | ||||
| 2026-02-10 | 13F | FDx Advisors, Inc. | 0 | -100,00 | 0 | |||||
| 2026-02-11 | 13F | United Financial Planning Group LLC | 719 | 12 | ||||||
| 2026-01-23 | 13F/A | Greenup Street Wealth Management Llc | 213.268 | 3.570 | ||||||
| 2026-02-13 | 13F | Storgate, LLC | 14.077 | 236 | ||||||
| 2026-02-13 | 13F | Marcho Partners LLP | 1.102.515 | -38,92 | 18.456 | -36,13 | ||||
| 2025-09-26 | NP | PBAIX - Blackrock Tactical Opportunities Fund Institutional This fund is a listed as child fund of BlackRock, Inc. and if that institution has disclosed ownership in this security, then these positions will not be double counted when calculating total shares and total value | 80.379 | 0,00 | 982 | -1,70 | ||||
| 2026-02-09 | 13F | Cary Street Partners Financial Llc | 16.061 | -0,71 | 269 | 3,88 | ||||
| 2026-02-12 | 13F | Great Lakes Advisors, Llc | 284.278 | 1,73 | 4.759 | 6,37 | ||||
| 2025-11-12 | 13F | Barclays Plc | Call | 0 | -100,00 | 0 | -100,00 | |||
| 2026-02-10 | 13F | State of Wyoming | 54.091 | -12,42 | 905 | -8,40 | ||||
| 2025-10-14 | 13F | Northwest Wealth Management, Llc | 0 | -100,00 | 0 | |||||
| 2026-01-29 | 13F | Calamos Advisors LLC | 40.900 | 685 | ||||||
| 2026-02-11 | 13F | GFS Advisors, LLC | 573.780 | 9.605 | ||||||
| 2025-10-22 | 13F | Constellation Investimentos e Participacoes Ltda | 1.324.373 | -4,41 | 21.203 | 11,54 | ||||
| 2026-02-04 | 13F | Hallmark Capital Management Inc | 228 | 4 | ||||||
| 2026-02-06 | 13F | Covestor Ltd | 10.072 | -17,40 | 0 | |||||
| 2026-02-23 | 13F | Kera Capital Partners, Inc. | 630.649 | 9,35 | 11.194 | 21,24 | ||||
| 2025-09-26 | NP | TIEIX - TIAA-CREF Equity Index Fund Institutional Class | 2.839.590 | 0,61 | 34.700 | -1,09 | ||||
| 2026-01-29 | 13F | Sava Infond d.o.o. | 185.700 | -2,62 | 3.109 | 1,80 | ||||
| 2025-11-14 | 13F | 1858 Wealth Management, Llc | 113.841 | -5,18 | 1.823 | 10,63 | ||||
| 2026-01-29 | 13F | Calamos Wealth Management LLC | 455.631 | -9,96 | 7.627 | -5,85 | ||||
| 2025-09-23 | NP | POIIX - Polen International Growth Fund Institutional Class | 283.249 | -18,14 | 3.461 | -19,53 | ||||
| 2026-02-12 | 13F | Jane Street Group, Llc | Call | 4.722.600 | 17,78 | 79.056 | 23,15 | |||
| 2025-09-25 | NP | ABEMX - Aberdeen Emerging Markets Fund Institutional Class | 771.019 | -8,39 | 9.422 | -9,94 | ||||
| 2025-09-25 | NP | GLLAX - Aberdeen Global Equity Fund Class A | 165.644 | -12,57 | 2.024 | -14,02 | ||||
| 2026-02-12 | 13F | Jane Street Group, Llc | 6.714.815 | 36,36 | 112.406 | 42,57 | ||||
| 2026-02-12 | 13F | Jane Street Group, Llc | Put | 3.247.200 | 12,55 | 54.358 | 17,68 | |||
| 2026-01-08 | 13F | Tuttle Tactical Management LLC | 0 | -100,00 | 0 | |||||
| 2026-02-06 | 13F | Banque Cantonale Vaudoise | 250.328 | -19,72 | 4.191 | 104.675,00 | ||||
| 2026-02-11 | 13F | Zions Bancorporation, National Association /ut/ | 1.601 | 27 | ||||||
| 2025-11-12 | 13F | Barclays Plc | Put | 0 | -100,00 | 0 | -100,00 | |||
| 2026-01-15 | 13F | Allspring Global Investments Holdings, LLC | 22.813 | 41,51 | 388 | 59,02 | ||||
| 2025-09-25 | NP | JEMSX - JPMorgan Emerging Markets Equity Fund Class I | 7.343.855 | 35,60 | 89.742 | 33,31 | ||||
| 2026-02-13 | 13F | Mariner, LLC | 3.834.527 | 59,92 | 64.192 | 67,21 | ||||
| 2026-02-20 | 13F | Larch Capital Partners Llc | 36.190.501 | 605.829 | ||||||
| 2025-11-13 | 13F | Total Investment Management Inc | 0 | -100,00 | 0 | |||||
| 2026-01-27 | 13F | Fortis Capital Advisors, LLC | 106.367 | 29,63 | 1.781 | 35,57 | ||||
| 2026-01-23 | 13F | Factory Mutual Insurance Co | 147.832 | 0,00 | 2.475 | 4,56 | ||||
| 2026-02-13 | 13F | SPX Equities Gestao de Recursos Ltda | 0 | -100,00 | 0 | |||||
| 2026-02-13 | 13F | USS Investment Management Ltd | 3.711.004 | 12,18 | 62.178 | 17,43 | ||||
| 2026-02-13 | 13F | Quinn Opportunity Partners LLC | 10.000 | 167 | ||||||
| 2026-01-07 | 13F | Stonekeep Investments, LLC | 0 | -100,00 | 0 | |||||
| 2026-02-13 | 13F | University Of Texas/texas Am Investment Managment Co | 65.513 | 1.097 | ||||||
| 2025-09-22 | NP | GSEQX - Goldman Sachs Multi-Manager Global Equity Fund Class R6 Shares | 144.898 | -0,68 | 1.771 | -2,37 | ||||
| 2025-09-26 | NP | BFRE - Westwood LBRTY Global Equity ETF | 412 | -19,22 | 5 | -16,67 | ||||
| 2026-01-14 | 13F | Petredis Investment Advisors Llc | 214.413 | -1,09 | 3.589 | 3,43 | ||||
| 2025-10-31 | 13F | Whittier Trust Co | 0 | -100,00 | 0 | |||||
| 2025-09-25 | NP | IEMFX - T. Rowe Price Institutional Emerging Markets Equity Fund This fund is a listed as child fund of Price T Rowe Associates Inc /md/ and if that institution has disclosed ownership in this security, then these positions will not be double counted when calculating total shares and total value | 385.229 | 13,39 | 4.707 | 11,49 | ||||
| 2026-01-08 | 13F | Grove Bank & Trust | 516 | 80,42 | 9 | 100,00 | ||||
| 2026-02-12 | 13F | Sit Investment Associates Inc | 0 | -100,00 | 0 | |||||
| 2026-02-13 | 13F | MYDA Advisors LLC | 162.000 | 54,29 | 2.712 | 61,27 | ||||
| 2026-01-12 | 13F | Abound Wealth Management | 26 | 0,00 | 0 | |||||
| 2026-01-23 | 13F | Paragon Capital Management Inc | 108.770 | -11,55 | 1.821 | -7,52 | ||||
| 2025-11-12 | 13F | Fox Run Management, L.l.c. | 0 | -100,00 | 0 | |||||
| 2025-09-25 | NP | CBLS - Clough Hedged Equity ETF | 67.293 | -22,11 | 822 | -23,39 | ||||
| 2025-09-26 | NP | SPECX - Alger Spectra Fund Class A | 303.230 | 3.705 | ||||||
| 2026-01-28 | 13F | Geneos Wealth Management Inc. | 19.007 | 0,00 | 318 | 4,61 | ||||
| 2026-02-04 | 13F | Heritage Wealth Management, Inc. /CA/ | 10.000 | 0,00 | 167 | 4,38 | ||||
| 2026-01-28 | 13F | DekaBank Deutsche Girozentrale | 79.585 | 0,00 | 1 | 0,00 | ||||
| 2026-02-13 | 13F | Keystone Investors Pte Ltd | 459.366 | 64,00 | 7.690 | 71,48 | ||||
| 2025-09-25 | NP | JCTR - JPMorgan Carbon Transition U.S. Equity ETF | 706 | 0,00 | 9 | 0,00 | ||||
| 2026-01-14 | 13F | Exchange Traded Concepts, Llc | 2.075.844 | -12,07 | 34.750 | -8,06 | ||||
| 2026-02-11 | 13F | Simplex Trading, Llc | 858.285 | 1,10 | 14.368 | 110.415,38 | ||||
| 2026-02-13 | 13F | First National Bank Of Omaha | 150.670 | 2.543 | ||||||
| 2025-09-26 | NP | Invesco Exchange-Traded Fund Trust II - Invesco MSCI Global Climate 500 ETF | 72.235 | 12,50 | 883 | 10,53 | ||||
| 2026-02-02 | 13F | MN Wealth Advisors, LLC | 11.363 | 190 | ||||||
| 2026-02-24 | 13F | Tru Independence Asset Management 2, Llc | 20.000 | 335 | ||||||
| 2026-02-12 | 13F | Gerber Kawasaki Wealth & Investment Management | 0 | -100,00 | 0 | |||||
| 2026-02-05 | 13F | North Dakota State Investment Board | 117.777 | 1.972 | ||||||
| 2026-02-17 | 13F | Cresset Asset Management, LLC | 24.776 | 8,81 | 415 | 13,74 | ||||
| 2026-02-06 | 13F/A | Rathbone Brothers plc | 194.281 | 30,63 | 3.252 | 36,58 | ||||
| 2026-02-06 | 13F | Creative Financial Designs Inc /adv | 10 | 0,00 | 0 | |||||
| 2026-02-12 | 13F | Qtron Investments LLC | 0 | -100,00 | 0 | |||||
| 2025-09-24 | NP | BLACKROCK FUNDS - iShares Total U.S. Stock Market Index Fund Investor A | 216.461 | -2,23 | 2.645 | -3,89 | ||||
| 2026-01-26 | 13F | Cwm, Llc | 91.594 | 4,93 | 2 | 0,00 | ||||
| 2026-02-13 | 13F | Heron Bay Capital Management | 23.714 | -0,99 | 397 | 3,39 | ||||
| 2026-01-27 | 13F | First Horizon Corp | 296 | 41,63 | 5 | 33,33 | ||||
| 2026-02-06 | 13F | Resona Asset Management Co.,Ltd. | 865.762 | -4,61 | 14.482 | -0,28 | ||||
| 2026-02-13 | 13F | Walleye Trading LLC | 0 | -100,00 | 0 | -100,00 | ||||
| 2025-10-22 | 13F | Penbrook Management LLC | 0 | -100,00 | 0 | -100,00 | ||||
| 2026-01-20 | 13F | American National Bank | 943 | 0,00 | 16 | 0,00 | ||||
| 2026-02-11 | 13F | Jessup Wealth Management, Inc | 4.423 | 74 | ||||||
| 2026-02-03 | 13F | Sumitomo Mitsui DS Asset Management Company, Ltd | 183.619 | 2,26 | 3.074 | 6,92 | ||||
| 2026-02-06 | 13F | Handelsbanken Fonder AB | 1.788.146 | 22,10 | 30 | 26,09 | ||||
| 2026-02-10 | 13F | Commonwealth Of Pennsylvania Public School Empls Retrmt Sys | 338.087 | 10,67 | 5.660 | 15,73 | ||||
| 2026-02-13 | 13F | 1832 Asset Management L.P. | 6.249.070 | 11,43 | 104.609 | 16,51 | ||||
| 2026-02-17 | 13F | Dragoneer Investment Group, LLC | 4.954.299 | 0,00 | 82.935 | 4,56 | ||||
| 2026-02-06 | 13F | Mizuho Markets Cayman LP | 577.977 | 9.675 | ||||||
| 2025-09-25 | NP | RPGAX - T. Rowe Price Global Allocation Fund, Inc. This fund is a listed as child fund of Price T Rowe Associates Inc /md/ and if that institution has disclosed ownership in this security, then these positions will not be double counted when calculating total shares and total value | 30.080 | 18,52 | 368 | 16,51 | ||||
| 2026-01-22 | 13F | Cache Advisors, LLC | 271.662 | 87,04 | 4.548 | 95,57 | ||||
| 2026-02-04 | 13F | Pensionmark Financial Group, Llc | 15.579 | 20,38 | 244 | 17,39 | ||||
| 2025-09-26 | NP | FSBDX - Fidelity Series Blue Chip Growth Fund This fund is a listed as child fund of Fmr Llc and if that institution has disclosed ownership in this security, then these positions will not be double counted when calculating total shares and total value | 194.300 | 2.374 | ||||||
| 2026-01-26 | 13F | PDS Planning, Inc | 15.702 | 1,93 | 263 | 6,50 | ||||
| 2026-02-17 | 13F | TB Capital Gestao de Recursos Ltda. | 493.152 | 40,89 | 8.255 | 47,31 | ||||
| 2026-02-13 | 13F | MAI Capital Management | 36.367 | 2,07 | 609 | 6,67 | ||||
| 2026-01-14 | 13F | Jfs Wealth Advisors, Llc | 750 | 0,00 | 13 | 0,00 | ||||
| 2026-01-15 | 13F | Trust Co | 33 | 1 | ||||||
| 2025-09-25 | NP | PRMSX - T. Rowe Price Emerging Markets Stock Fund This fund is a listed as child fund of Price T Rowe Associates Inc /md/ and if that institution has disclosed ownership in this security, then these positions will not be double counted when calculating total shares and total value | 4.260.559 | 26,00 | 52.064 | 23,87 | ||||
| 2026-02-13 | 13F | Y-Intercept (Hong Kong) Ltd | 841.549 | -50,08 | 14.088 | -47,80 | ||||
| 2025-10-29 | 13F | Glass Jacobson Investment Advisors llc | 0 | -100,00 | 0 | |||||
| 2025-09-26 | NP | FIGRX - Fidelity International Discovery Fund This fund is a listed as child fund of Fmr Llc and if that institution has disclosed ownership in this security, then these positions will not be double counted when calculating total shares and total value | 1.990.930 | 0,00 | 24.329 | -1,69 | ||||
| 2026-01-23 | 13F | Sage Investment Counsel LLC | 11.000 | 0,00 | 184 | 4,55 | ||||
| 2026-02-17 | 13F | Boothbay Fund Management, Llc | 133.474 | -46,10 | 2.234 | -43,64 | ||||
| 2026-02-19 | 13F/A | Vancity Investment Management Ltd | 15.978 | -1,02 | 0 | |||||
| 2026-01-21 | 13F | Aaron Wealth Advisors LLC | 36.415 | 63,08 | 610 | 70,59 | ||||
| 2026-02-17 | 13F | Susquehanna International Group, Llp | Put | 7.244.100 | 7,93 | 121.266 | 12,86 | |||
| 2025-09-29 | NP | CEPI - REX Crypto Equity Premium Income ETF | 216.884 | 35,29 | 2.650 | 33,03 | ||||
| 2026-02-17 | 13F | Susquehanna International Group, Llp | Call | 13.461.200 | 2,78 | 225.340 | 7,46 | |||
| 2026-02-13 | 13F | Sei Investments Co | 7.701.658 | -18,99 | 128.926 | -15,29 | ||||
| 2026-02-13 | 13F | SurgoCap Partners LP | 10.520.395 | -24,88 | 176.111 | -21,46 | ||||
| 2026-02-17 | 13F | Susquehanna International Group, Llp | 1.290.042 | 60,36 | 21.595 | 67,68 | ||||
| 2026-02-13 | 13F | Flow Traders U.s. Llc | 131.455 | 249,20 | 2 | |||||
| 2025-09-25 | NP | SCVEX - Hartford Schroders International Stock Fund Class A | 7.895.147 | 5,91 | 96.479 | 4,12 |