Grundlæggende statistik
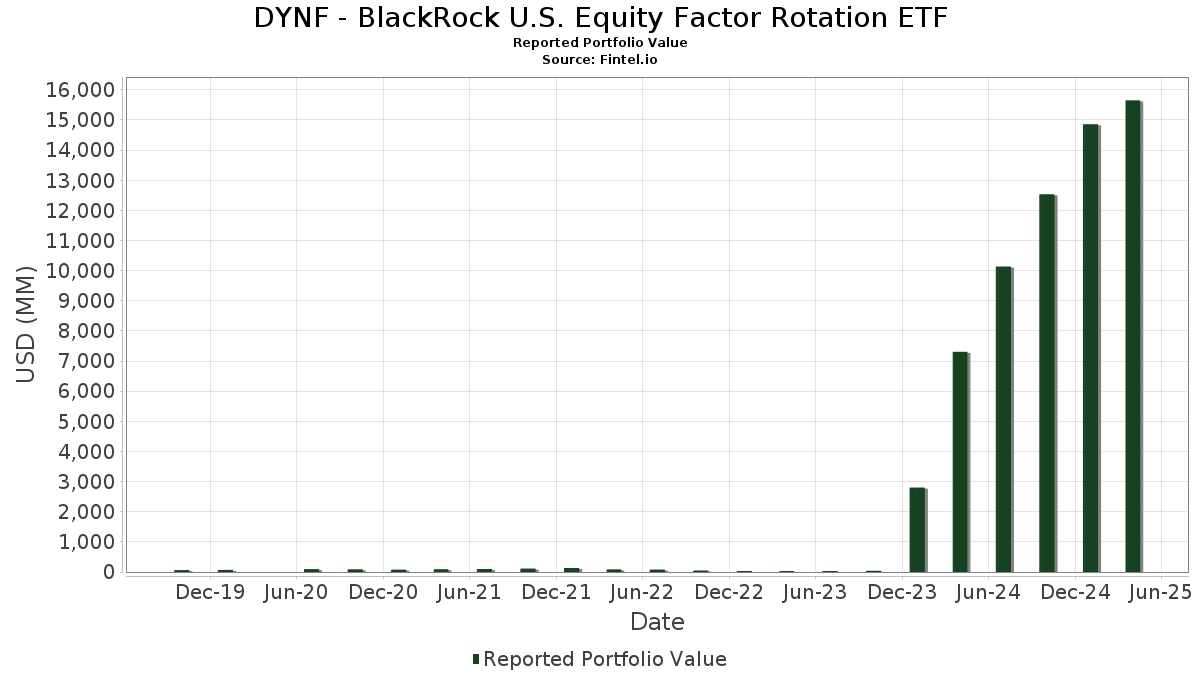
| Porteføljeværdi | $ 21.449.901.428 |
| Nuværende stillinger | 118 |
Seneste beholdninger, ydeevne, AUM (fra 13F, 13D)
DYNF - BlackRock U.S. Equity Factor Rotation ETF har afsløret 118 samlede besiddelser i deres seneste SEC-arkivering. Den seneste porteføljeværdi er beregnet til at være $ 21.449.901.428 USD. Faktiske aktiver under forvaltning (AUM) er denne værdi plus kontanter (som ikke er oplyst). DYNF - BlackRock U.S. Equity Factor Rotation ETFs største beholdninger er NVIDIA Corporation (US:NVDA) , Microsoft Corporation (US:MSFT) , Apple Inc. (US:AAPL) , Amazon.com, Inc. (US:AMZN) , and JPMorgan Chase & Co. (US:JPM) . DYNF - BlackRock U.S. Equity Factor Rotation ETFs nye stillinger omfatter Strategy Inc (US:MSTR) , Exelixis, Inc. (US:EXEL) , .
Top øger dette kvartal
Vi bruger ændringen i porteføljeallokeringen, fordi dette er den mest meningsfulde metrik. Ændringer kan skyldes handler eller ændringer i aktiekurser.
| Sikkerhed | Aktier (MM) |
Værdi (MM$) |
Portefølje % | ΔPortefølje % |
|---|---|---|---|---|
| NVDA / NVIDIA Corporation | 10,52 | 1.870,89 | 8,7205 | 2,3959 |
| MSFT / Microsoft Corporation | 3,40 | 1.811,24 | 8,4424 | 1,2340 |
| PH / Parker-Hannifin Corporation | 0,68 | 501,10 | 2,3357 | 1,2324 |
| BRK.B / Berkshire Hathaway Inc. | 1,22 | 577,56 | 2,6921 | 1,0422 |
| JPM / JPMorgan Chase & Co. | 3,01 | 891,30 | 4,1545 | 1,0235 |
| O / Realty Income Corporation | 3,60 | 201,88 | 0,9410 | 0,9410 |
| BAC / Bank of America Corporation | 7,60 | 359,04 | 1,6735 | 0,8491 |
| META / Meta Platforms, Inc. | 1,15 | 890,35 | 4,1501 | 0,7634 |
| CMCSA / Comcast Corporation | 7,43 | 246,99 | 1,1513 | 0,6645 |
| WELL / Welltower Inc. | 0,72 | 118,99 | 0,5546 | 0,5546 |
Top falder i dette kvartal
Vi bruger ændringen i porteføljeallokeringen, fordi dette er den mest meningsfulde metrik. Ændringer kan skyldes handler eller ændringer i aktiekurser.
| Sikkerhed | Aktier (MM) |
Værdi (MM$) |
Portefølje % | ΔPortefølje % |
|---|---|---|---|---|
| PG / The Procter & Gamble Company | 0,70 | 105,77 | 0,4930 | -1,7696 |
| CSCO / Cisco Systems, Inc. | 9,46 | 644,36 | 3,0034 | -1,5842 |
| COP / ConocoPhillips | 0,10 | 9,47 | 0,0441 | -1,4508 |
| JNJ / Johnson & Johnson | 2,04 | 335,25 | 1,5627 | -1,3724 |
| US0669225197 / BlackRock Cash Funds: Institutional, SL Agency Shares | 0,57 | 0,57 | 0,0027 | -1,1993 |
| SO / The Southern Company | 0,00 | 0,10 | 0,0005 | -0,9948 |
| MDT / Medtronic plc | 0,40 | 35,72 | 0,1665 | -0,9081 |
| KO / The Coca-Cola Company | 0,00 | 0,08 | 0,0004 | -0,8511 |
| AAPL / Apple Inc. | 6,96 | 1.444,25 | 6,7319 | -0,8278 |
| APH / Amphenol Corporation | 0,71 | 75,56 | 0,3522 | -0,7207 |
13F og Fondsarkivering
Denne formular blev indsendt den 2025-09-24 for rapporteringsperioden 2025-07-31. Klik på linkikonet for at se den fulde transaktionshistorik.
Opgrader for at låse op for premium-data og eksportere til Excel ![]() .
.
| Sikkerhed | Type | Gennemsnitlig aktiekurs | Aktier (MM) |
Δ Aktier (%) |
Værdi ($MM) |
ΔVærdi (%) |
Portefølje (%) |
ΔPortefølje (%) |
|
|---|---|---|---|---|---|---|---|---|---|
| NVDA / NVIDIA Corporation | 10,52 | 17,15 | 1.870,89 | 91,30 | 8,7205 | 2,3959 | |||
| MSFT / Microsoft Corporation | 3,40 | 20,39 | 1.811,24 | 62,50 | 8,4424 | 1,2340 | |||
| AAPL / Apple Inc. | 6,96 | 26,49 | 1.444,25 | 23,55 | 6,7319 | -0,8278 | |||
| AMZN / Amazon.com, Inc. | 4,34 | 16,58 | 1.015,02 | 48,00 | 4,7311 | 0,2957 | |||
| JPM / JPMorgan Chase & Co. | 3,01 | 52,02 | 891,30 | 84,10 | 4,1545 | 1,0235 | |||
| META / Meta Platforms, Inc. | 1,15 | 20,68 | 890,35 | 70,02 | 4,1501 | 0,7634 | |||
| CSCO / Cisco Systems, Inc. | 9,46 | -22,98 | 644,36 | -9,17 | 3,0034 | -1,5842 | |||
| GOOGL / Alphabet Inc. | 3,09 | 20,41 | 592,17 | 45,51 | 2,7602 | 0,1283 | |||
| BRK.B / Berkshire Hathaway Inc. | 1,22 | 155,83 | 577,56 | 126,39 | 2,6921 | 1,0422 | |||
| PH / Parker-Hannifin Corporation | 0,68 | 142,82 | 501,10 | 193,73 | 2,3357 | 1,2324 | |||
| AVGO / Broadcom Inc. | 1,63 | 20,39 | 479,40 | 83,71 | 2,2345 | 0,5469 | |||
| COF / Capital One Financial Corporation | 2,18 | 18,72 | 468,20 | 41,60 | 2,1823 | 0,0440 | |||
| COST / Costco Wholesale Corporation | 0,45 | 10,36 | 426,43 | 4,27 | 1,9877 | -0,6572 | |||
| NFLX / Netflix, Inc. | 0,36 | 20,40 | 417,49 | 23,34 | 1,9460 | -0,2430 | |||
| CRM / Salesforce, Inc. | 1,49 | 62,88 | 384,34 | 56,59 | 1,7915 | 0,2041 | |||
| TSLA / Tesla, Inc. | 1,23 | 84,41 | 379,72 | 101,48 | 1,7699 | 0,5511 | |||
| XOM / Exxon Mobil Corporation | 3,39 | 20,39 | 378,13 | 27,24 | 1,7625 | -0,1593 | |||
| DUK / Duke Energy Corporation | 3,07 | 7,23 | 373,12 | 6,89 | 1,7392 | -0,5182 | |||
| GOOG / Alphabet Inc. | 1,90 | 15,36 | 365,49 | 38,29 | 1,7036 | -0,0057 | |||
| BAC / Bank of America Corporation | 7,60 | 137,60 | 359,04 | 181,63 | 1,6735 | 0,8491 | |||
| HIG / The Hartford Insurance Group, Inc. | 2,81 | 0,00 | 349,57 | 1,40 | 1,6294 | -0,6001 | |||
| BKNG / Booking Holdings Inc. | 0,06 | 20,38 | 337,60 | 29,94 | 1,5736 | -0,1067 | |||
| JNJ / Johnson & Johnson | 2,04 | -29,91 | 335,25 | -26,13 | 1,5627 | -1,3724 | |||
| C / Citigroup Inc. | 3,30 | 1,89 | 309,41 | 39,62 | 1,4422 | 0,0090 | |||
| TRV / The Travelers Companies, Inc. | 1,08 | 18,19 | 281,11 | 16,45 | 1,3103 | -0,2509 | |||
| T / AT&T Inc. | 9,64 | 20,40 | 264,12 | 19,14 | 1,2311 | -0,2026 | |||
| WMT / Walmart Inc. | 2,63 | 67,20 | 257,67 | 68,46 | 1,2010 | 0,2118 | |||
| CMCSA / Comcast Corporation | 7,43 | 237,76 | 246,99 | 228,18 | 1,1513 | 0,6645 | |||
| PLD / Prologis, Inc. | 2,22 | 866,35 | 237,41 | 714,51 | 1,1066 | 0,0657 | |||
| O / Realty Income Corporation | 3,60 | 201,88 | 0,9410 | 0,9410 | |||||
| ETN / Eaton Corporation plc | 0,51 | 20,36 | 194,82 | 57,31 | 0,9081 | 0,1071 | |||
| V / Visa Inc. | 0,56 | 20,41 | 193,13 | 20,40 | 0,9002 | -0,1372 | |||
| BSX / Boston Scientific Corporation | 1,73 | 20,38 | 181,79 | 22,78 | 0,8473 | -0,1102 | |||
| TT / Trane Technologies plc | 0,41 | 20,30 | 178,57 | 37,49 | 0,8323 | -0,0076 | |||
| US0669224778 / BlackRock Cash Funds: Treasury, SL Agency Shares | 170,52 | 152,73 | 170,52 | 152,73 | 0,7948 | 0,3585 | |||
| AMAT / Applied Materials, Inc. | 0,94 | 20,45 | 169,34 | 43,90 | 0,7893 | 0,0283 | |||
| HD / The Home Depot, Inc. | 0,44 | 20,45 | 162,95 | 22,80 | 0,7595 | -0,0986 | |||
| PGR / The Progressive Corporation | 0,66 | 14,96 | 159,12 | -1,24 | 0,7417 | -0,3002 | |||
| CAT / Caterpillar Inc. | 0,35 | -13,33 | 153,28 | 22,75 | 0,7145 | -0,0931 | |||
| RTX / RTX Corporation | 0,96 | 20,46 | 150,54 | 50,48 | 0,7017 | 0,0547 | |||
| PFE / Pfizer Inc. | 6,33 | 20,39 | 147,45 | 14,86 | 0,6873 | -0,1429 | |||
| NOW / ServiceNow, Inc. | 0,15 | 31,57 | 142,00 | 29,93 | 0,6619 | -0,0449 | |||
| MA / Mastercard Incorporated | 0,24 | 20,17 | 135,81 | 24,21 | 0,6330 | -0,0741 | |||
| PLTR / Palantir Technologies Inc. | 0,85 | 132,56 | 133,92 | 210,93 | 0,6242 | 0,3457 | |||
| ISRG / Intuitive Surgical, Inc. | 0,28 | 36,74 | 132,81 | 27,54 | 0,6191 | -0,0544 | |||
| VZ / Verizon Communications Inc. | 3,02 | 17,34 | 129,04 | 13,88 | 0,6015 | -0,1314 | |||
| GE / General Electric Company | 0,46 | -3,67 | 123,91 | 29,57 | 0,5776 | -0,0409 | |||
| GSCE / GS Connect S&P GSCI Enhanced Commodity Total Return ETN | 0,17 | 30,55 | 122,68 | 72,53 | 0,5718 | 0,1120 | |||
| WELL / Welltower Inc. | 0,72 | 118,99 | 0,5546 | 0,5546 | |||||
| TMO / Thermo Fisher Scientific Inc. | 0,25 | 116,77 | 0,5443 | 0,5443 | |||||
| NEE / NextEra Energy, Inc. | 1,52 | 83,42 | 108,03 | 94,88 | 0,5036 | 0,1450 | |||
| PG / The Procter & Gamble Company | 0,70 | -67,34 | 105,77 | -69,77 | 0,4930 | -1,7696 | |||
| AMD / Advanced Micro Devices, Inc. | 0,58 | 601.339,58 | 101,80 | 1.130.988,89 | 0,4745 | 0,4744 | |||
| GILD / Gilead Sciences, Inc. | 0,75 | 88,31 | 83,97 | 98,47 | 0,3914 | 0,1178 | |||
| APH / Amphenol Corporation | 0,71 | -67,09 | 75,56 | -54,45 | 0,3522 | -0,7207 | |||
| HLT / Hilton Worldwide Holdings Inc. | 0,27 | -36,27 | 73,63 | -24,23 | 0,3432 | -0,2852 | |||
| NEM / Newmont Corporation | 1,02 | 63,08 | 0,2940 | 0,2940 | |||||
| LLY / Eli Lilly and Company | 0,09 | 20,19 | 62,91 | -1,06 | 0,2932 | -0,1180 | |||
| GEV / GE Vernova Inc. | 0,09 | 17.971,23 | 60,14 | 78.001,30 | 0,2803 | 0,2793 | |||
| EXC / Exelon Corporation | 1,26 | 20,34 | 56,60 | 15,31 | 0,2638 | -0,0536 | |||
| RCL / Royal Caribbean Cruises Ltd. | 0,17 | -11,65 | 53,19 | 30,68 | 0,2479 | -0,0153 | |||
| ADP / Automatic Data Processing, Inc. | 0,15 | 20,48 | 46,72 | 24,05 | 0,2178 | -0,0258 | |||
| ORCL / Oracle Corporation | 0,18 | 733,38 | 46,36 | 1.403,24 | 0,2161 | 0,1961 | |||
| UNH / UnitedHealth Group Incorporated | 0,16 | -7,78 | 39,98 | -44,07 | 0,1864 | -0,2759 | |||
| UNP / Union Pacific Corporation | 0,17 | 37,03 | 0,1726 | 0,1726 | |||||
| MDT / Medtronic plc | 0,40 | -79,81 | 35,72 | -78,50 | 0,1665 | -0,9081 | |||
| ALL / The Allstate Corporation | 0,15 | 20,12 | 31,50 | 23,06 | 0,1468 | -0,0187 | |||
| MSTR / Strategy Inc | 0,07 | 29,96 | 0,1396 | 0,1396 | |||||
| UBER / Uber Technologies, Inc. | 0,30 | 7.443,64 | 26,65 | 10.189,58 | 0,1242 | 0,1217 | |||
| DIS / The Walt Disney Company | 0,21 | 20,24 | 24,80 | 57,47 | 0,1156 | 0,0137 | |||
| WFC / Wells Fargo & Company | 0,31 | 26.213,02 | 24,61 | 29.912,20 | 0,1147 | 0,1142 | |||
| ABBV / AbbVie Inc. | 0,12 | -34,85 | 22,92 | -36,88 | 0,1068 | -0,1280 | |||
| GM / General Motors Company | 0,42 | -83,74 | 22,18 | -80,83 | 0,1034 | -0,6448 | |||
| CRH / CRH plc | 0,23 | 20,29 | 22,04 | 20,32 | 0,1027 | -0,0157 | |||
| APP / AppLovin Corporation | 0,04 | 4.144,13 | 17,36 | 6.078,29 | 0,0809 | 0,0791 | |||
| HON / Honeywell International Inc. | 0,06 | 21,49 | 13,05 | 28,33 | 0,0608 | -0,0049 | |||
| LEN / Lennar Corporation | 0,11 | 20,48 | 12,85 | 24,45 | 0,0599 | -0,0069 | |||
| FTNT / Fortinet, Inc. | 0,10 | 24.102,47 | 9,79 | 42.473,91 | 0,0456 | 0,0454 | |||
| COP / ConocoPhillips | 0,10 | -73,45 | 9,47 | -77,38 | 0,0441 | -1,4508 | |||
| HBAN / Huntington Bancshares Incorporated | 0,33 | 981.967,65 | 5,49 | 0,0256 | 0,0252 | ||||
| FOXA / Fox Corporation | 0,08 | 31.280,45 | 4,65 | 66.385,71 | 0,0217 | 0,0042 | |||
| EXEL / Exelixis, Inc. | 0,12 | 4,39 | 0,0205 | 0,0205 | |||||
| VICI / VICI Properties Inc. | 0,11 | 20,88 | 3,43 | 23,08 | 0,0160 | -0,0020 | |||
| CVNA / Carvana Co. | 0,01 | 5.820,00 | 2,89 | 14.335,00 | 0,0135 | -0,0019 | |||
| NRG / NRG Energy, Inc. | 0,01 | -99,11 | 0,85 | -98,65 | 0,0040 | -0,4028 | |||
| US0669225197 / BlackRock Cash Funds: Institutional, SL Agency Shares | 0,57 | -99,69 | 0,57 | -99,69 | 0,0027 | -1,1993 | |||
| QCOM / QUALCOMM Incorporated | 0,00 | -99,31 | 0,41 | -99,32 | 0,0019 | -0,3838 | |||
| PM / Philip Morris International Inc. | 0,00 | -99,31 | 0,38 | -99,34 | 0,0017 | -0,3681 | |||
| TMUS / T-Mobile US, Inc. | 0,00 | -99,30 | 0,20 | -99,32 | 0,0009 | -0,1889 | |||
| IBM / International Business Machines Corporation | 0,00 | -99,30 | 0,18 | -99,27 | 0,0008 | -0,1559 | |||
| MRK / Merck & Co., Inc. | 0,00 | -99,30 | 0,12 | -99,37 | 0,0005 | -0,1179 | |||
| SO / The Southern Company | 0,00 | -99,94 | 0,10 | -99,94 | 0,0005 | -0,9948 | |||
| KO / The Coca-Cola Company | 0,00 | -99,94 | 0,08 | -99,94 | 0,0004 | -0,8511 | |||
| VST / Vistra Corp. | 0,00 | 0,00 | 0,07 | 60,00 | 0,0003 | 0,0000 | |||
| CVX / Chevron Corporation | 0,00 | -99,94 | 0,07 | -99,93 | 0,0003 | -0,6214 | |||
| WTW / Willis Towers Watson Public Limited Company | 0,00 | 0,00 | 0,06 | 3,51 | 0,0003 | -0,0001 | |||
| DOV / Dover Corporation | 0,00 | -90,85 | 0,05 | -91,39 | 0,0002 | -0,0041 | |||
| MCD / McDonald's Corporation | 0,00 | 0,00 | 0,05 | -6,25 | 0,0002 | -0,0001 | |||
| DOW / Dow Inc. | 0,00 | -3,26 | 0,03 | -57,75 | 0,0001 | -0,0975 | |||
| ARE / Alexandria Real Estate Equities, Inc. | 0,00 | -99,90 | 0,03 | -99,90 | 0,0001 | -0,1763 | |||
| NTNX / Nutanix, Inc. | 0,00 | 0,00 | 0,01 | 0,00 | 0,0000 | -0,0000 | |||
| INTU / Intuit Inc. | 0,00 | 0,00 | 0,01 | 20,00 | 0,0000 | -0,0000 | |||
| VLO / Valero Energy Corporation | 0,00 | 0,00 | 0,01 | 20,00 | 0,0000 | -0,0000 | |||
| HPE / Hewlett Packard Enterprise Company | 0,00 | 0,00 | 0,01 | 25,00 | 0,0000 | -0,0000 | |||
| DELL / Dell Technologies Inc. | 0,00 | 0,00 | 0,01 | 25,00 | 0,0000 | 0,0000 | |||
| SNOW / Snowflake Inc. | 0,00 | 0,00 | 0,00 | 33,33 | 0,0000 | 0,0000 | |||
| PCAR / PACCAR Inc | 0,00 | -99,14 | 0,00 | -99,13 | 0,0000 | -0,0030 | |||
| NU / Nu Holdings Ltd. | 0,00 | 0,00 | 0,00 | 0,00 | 0,0000 | -0,0000 | |||
| MS / Morgan Stanley | 0,00 | 0,00 | 0,00 | 50,00 | 0,0000 | -0,0000 | |||
| MET / MetLife, Inc. | 0,00 | 0,00 | 0,00 | 0,00 | 0,0000 | -0,0000 | |||
| AXP / American Express Company | 0,00 | 0,00 | 0,00 | 0,00 | 0,0000 | -0,0000 | |||
| WM / Waste Management, Inc. | 0,00 | 0,00 | 0,00 | 0,00 | 0,0000 | -0,0000 | |||
| CPNG / Coupang, Inc. | 0,00 | 0,00 | 0,00 | 0,00 | 0,0000 | -0,0000 | |||
| M / Macy's, Inc. | 0,00 | 0,00 | 0,00 | 0,00 | 0,0000 | -0,0000 | |||
| UPS / United Parcel Service, Inc. | 0,00 | -99,94 | 0,00 | -100,00 | 0,0000 | -0,0077 | |||
| MO / Altria Group, Inc. | 0,00 | -100,00 | 0,00 | -100,00 | 0,0000 | -0,2023 | |||
| US003CVR0169 / CONTRA ABIOMED INC | 0,00 | 0,00 | 0,00 | 0,0000 | -0,0000 | ||||
| MRP / Millrose Properties, Inc. | 0,00 | -100,00 | 0,00 | -100,00 | 0,0000 | -0,1514 | |||
| DAL / Delta Air Lines, Inc. | 0,00 | -100,00 | 0,00 | -100,00 | -0,0485 | ||||
| UAL / United Airlines Holdings, Inc. | 0,00 | -100,00 | 0,00 | -100,00 | -0,0464 |