Grundlæggende statistik
| Institutionelle ejere | 672 total, 660 long only, 1 short only, 11 long/short - change of -2,66% MRQ |
| Gennemsnitlig porteføljeallokering | 0.4797 % - change of 9,68% MRQ |
| Institutionelle aktier (lange) | 677.681.104 (ex 13D/G) - change of 65,35MM shares 9,97% MRQ |
| Institutionel værdi (lang) | $ 19.553.119 USD ($1000) |
Institutionelt ejerskab og aktionærer
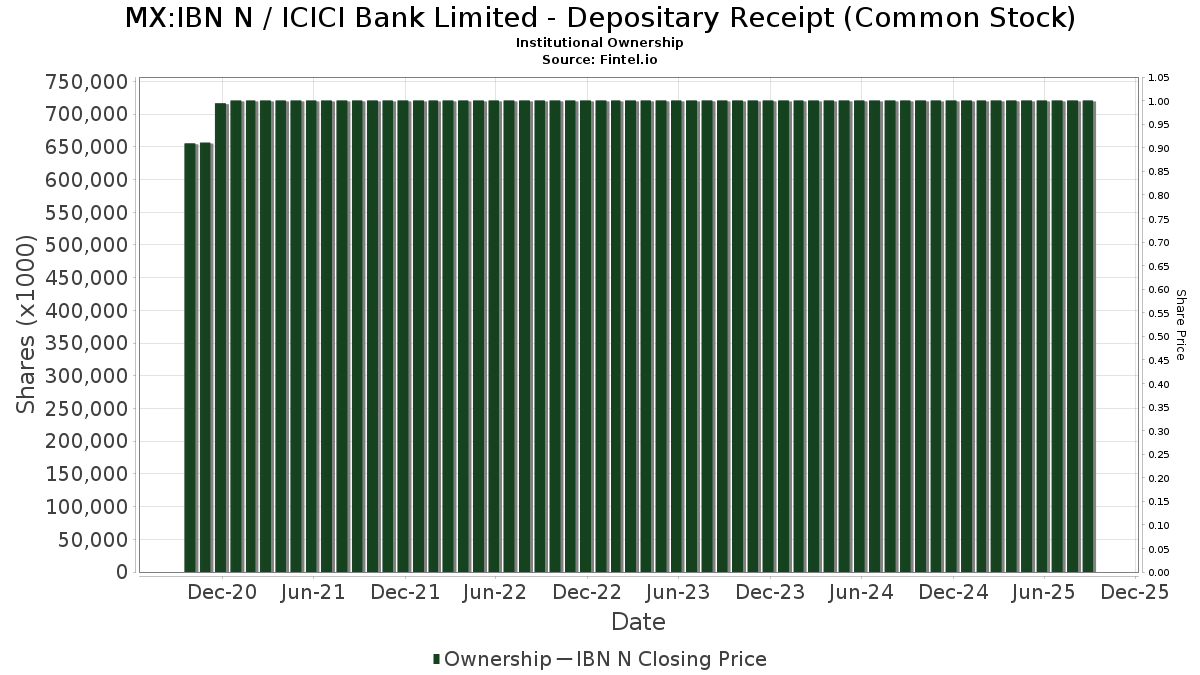
ICICI Bank Limited - Depositary Receipt (Common Stock) (MX:IBN N) har 672 institutionelle ejere og aktionærer, der har indsendt 13D/G- eller 13F-formularer til Securities Exchange Commission (SEC). Disse institutioner har i alt 677,681,104 aktier. Største aktionærer omfatter GQG Partners LLC, Morgan Stanley, Wcm Investment Management, Llc, GSIHX - Goldman Sachs GQG Partners International Opportunities Fund Class A Shares, Temasek Holdings (Private) Ltd, Invesco Ltd., Robeco Institutional Asset Management B.V., Jpmorgan Chase & Co, Capital International Investors, and Dimensional Fund Advisors Lp .
ICICI Bank Limited - Depositary Receipt (Common Stock) (BMV:IBN N) institutionel ejerskabsstruktur viser aktuelle positioner i virksomheden efter institutioner og fonde, samt seneste ændringer i positionsstørrelse. Større aktionærer kan omfatte individuelle investorer, investeringsforeninger, hedgefonde eller institutioner. Skema 13D angiver, at investoren besidder (eller besidder) mere end 5 % af virksomheden og har til hensigt (eller har til hensigt at) aktivt at forfølge en ændring i forretningsstrategi. Skema 13G indikerer en passiv investering på over 5%.
Fondens stemningsscore
Fund Sentiment Score (fka Ownership Accumulation Score) finder de aktier, der bliver mest købt af fonde. Det er resultatet af en sofistikeret, multi-faktor kvantitativ model, der identificerer virksomheder med de højeste niveauer af institutionel akkumulering. Scoringsmodellen bruger en kombination af den samlede stigning i oplyste ejere, ændringerne i porteføljeallokeringer i disse ejere og andre målinger. Tallet går fra 0 til 100, hvor højere tal indikerer et højere niveau af akkumulering for sine jævnaldrende, og 50 er gennemsnittet.
Opdateringsfrekvens: Dagligt
Se Ownership Explorer, som giver en liste over højest rangerende virksomheder.
AI+ Ask Fintel’s AI assistant about ICICI Bank Limited - Depositary Receipt (Common Stock).
Select a question to share a public post with an AI-crafted answer.
Thinking of good questions…
13F og NPORT arkivering
Detaljer om 13F-arkivering er gratis. Detaljer om NP-ansøgninger kræver et premium-medlemskab. Grønne rækker angiver nye positioner. Røde rækker angiver lukkede positioner. Klik på linket ikon for at se den fulde transaktionshistorik.
Opgrader
for at låse premium-data op og eksportere til Excel ![]() .
.
Important Note
In an effort to reduce load times for our mobile users, we are testing some ways to deliver lighter pages.
In this first test, we will deliver only the most recent 750 transactions (out of 819 for this stock). If you are interested in loading *all* the transactions for this company, click the "load all" button below. This is just a test and if you don't like it, please let us know by submitting some gentle feedback via the link at the bottom of this page.
Load All| Fil dato | Kilde | Investor | Type | Gennemsnitlig pris (Øst) |
Aktier | Δ Aktier (%) |
Rapporteret Værdi ($1000) |
Δ Værdi (%) |
Port Alloc (%) |
|
|---|---|---|---|---|---|---|---|---|---|---|
| 2026-02-11 | 13F | Empowered Funds, LLC | 148.497 | 4.425 | ||||||
| 2026-02-13 | 13F | Walleye Trading LLC | 93.295 | -43,76 | 2.780 | -44,56 | ||||
| 2026-02-13 | 13F | Parkside Financial Bank & Trust | 162 | 0,00 | 5 | 0,00 | ||||
| 2026-02-17 | 13F | Old Mission Capital Llc | 339.316 | 10.112 | ||||||
| 2026-02-13 | 13F | Aviso Financial Inc. | 0 | -100,00 | 0 | |||||
| 2026-02-17 | 13F | Summit Global Investments | 58.336 | -1,98 | 2 | 0,00 | ||||
| 2026-02-13 | 13F | Walleye Trading LLC | Put | 16.700 | -57,51 | 498 | -58,16 | |||
| 2026-02-13 | 13F | Walleye Trading LLC | Call | 27.600 | 8,66 | 822 | 7,17 | |||
| 2026-02-13 | 13F | Colony Group, LLC | 32.352 | 30,38 | 964 | 28,53 | ||||
| 2026-01-28 | 13F | Cranbrook Wealth Management, LLC | 53 | 0,00 | 2 | 0,00 | ||||
| 2026-02-06 | 13F | Leonteq Securities AG | 130.382 | 66,62 | 3.885 | 64,27 | ||||
| 2026-02-12 | 13F | BRYN MAWR TRUST Co | 445 | -4,09 | 13 | -7,14 | ||||
| 2026-02-17 | 13F | Lazard Asset Management Llc | 3.860.922 | -5,93 | 115.055 | -7,27 | ||||
| 2026-02-13 | 13F | Headlands Technologies LLC | 100.617 | 685,46 | 2.998 | 674,68 | ||||
| 2026-02-11 | 13F | Cerity Partners LLC | 214.699 | -1,94 | 6.398 | -3,34 | ||||
| 2025-11-14 | 13F | Binnacle Investments Inc | 1.666 | 0,00 | 50 | -10,71 | ||||
| 2025-11-14 | 13F | Eqis Capital Management, Inc. | 0 | -100,00 | 0 | |||||
| 2026-02-13 | 13F | NLB Skladi, upravljanje premozenja, d.o.o. | 354.861 | 10.575 | ||||||
| 2026-02-03 | 13F | Crossmark Global Holdings, Inc. | 117.862 | 0,18 | 3.512 | -1,24 | ||||
| 2026-02-17 | 13F | Nearwater Capital Markets, Ltd | 180.300 | 0,00 | 5.373 | -1,43 | ||||
| 2026-02-13 | 13F | Causeway Capital Management Llc | 477.060 | 7,29 | 14.216 | 5,76 | ||||
| 2026-01-20 | 13F | Perpetual Ltd | 1.146.232 | -2,42 | 34.158 | -3,81 | ||||
| 2026-02-13 | 13F | Marshall Wace, Llp | 2.945.850 | 87.786 | ||||||
| 2026-02-17 | 13F | DV Trading LLC | 1.000 | 30 | ||||||
| 2026-01-26 | 13F | Foster Victor Wealth Advisors, LLC | 13.875 | 92,09 | 428 | 92,79 | ||||
| 2025-09-25 | NP | Dimensional Emerging Markets Value Fund - Dimensional Emerging Markets Value Fund This fund is a listed as child fund of Dimensional Fund Advisors Lp and if that institution has disclosed ownership in this security, then these positions will not be double counted when calculating total shares and total value | 804.918 | -9,19 | 27.126 | -8,81 | ||||
| 2026-02-13 | 13F | Macquarie Group Ltd | 0 | -100,00 | 0 | |||||
| 2025-09-25 | NP | INDAX - ALPS/Kotak India Growth Fund Investor Shares | 835.000 | 0,00 | 28.140 | 0,42 | ||||
| 2026-02-17 | 13F | Voleon Capital Management Lp | 93.072 | -12,84 | 2.774 | -14,10 | ||||
| 2026-01-30 | 13F | Keybank National Association/oh | 11.313 | 0,37 | 337 | -0,88 | ||||
| 2026-02-12 | 13F | Hm Payson & Co | 72 | 2 | ||||||
| 2026-01-12 | 13F | Castleview Partners, Llc | 7.778 | 8,87 | 232 | 7,44 | ||||
| 2026-02-17 | 13F | GAM Holding AG | 100.950 | 7,49 | 3.008 | 5,95 | ||||
| 2026-01-23 | 13F | Robeco Institutional Asset Management B.V. | 18.680.412 | -1,54 | 556.676 | -2,94 | ||||
| 2025-10-02 | 13F/A | Mirabella Financial Services Llp | 18.000 | -82,09 | 567 | -81,27 | ||||
| 2025-09-25 | NP | HFIGX - Hartford Schroders Diversified Growth Fund Class I | 5.547 | 7,11 | 187 | 7,51 | ||||
| 2026-01-15 | 13F | Highline Wealth Partners Llc | 807 | -4,95 | 24 | -4,00 | ||||
| 2025-11-12 | 13F | NewSquare Capital LLC | 0 | -100,00 | 0 | |||||
| 2025-11-14 | 13F | Scientech Research LLC | 0 | -100,00 | 0 | -100,00 | ||||
| 2025-09-26 | NP | EPIN - Harbor International Equity ETF | 3.000 | 101 | ||||||
| 2026-02-12 | 13F | DJE Kapital AG | 26.425 | -41,24 | 788 | -47,57 | ||||
| 2026-02-09 | 13F | Coldstream Capital Management Inc | 58.493 | -25,86 | 1.743 | -26,92 | ||||
| 2026-02-17 | 13F | Dv Equities, Llc | 400 | 12 | ||||||
| 2026-02-13 | 13F | FORA Capital, LLC | 124.022 | 162,86 | 3.696 | 159,12 | ||||
| 2026-02-02 | 13F | Equitable Trust Co | 88.088 | -0,58 | 2.625 | -1,98 | ||||
| 2026-01-27 | 13F | Ninety One UK Ltd | 9.338.223 | -1,77 | 278.279 | -3,16 | ||||
| 2025-09-24 | NP | BLACKROCK FUNDS - BlackRock Defensive Advantage Emerging Markets Fund Institutional This fund is a listed as child fund of BlackRock, Inc. and if that institution has disclosed ownership in this security, then these positions will not be double counted when calculating total shares and total value | 2.487 | 0,00 | 84 | 0,00 | ||||
| 2026-01-05 | 13F | Park National Corp /oh/ | 7.869 | -1,44 | 234 | -2,90 | ||||
| 2025-10-23 | 13F | Spire Wealth Management | 0 | -100,00 | 0 | -100,00 | ||||
| 2025-11-14 | 13F | Wetherby Asset Management Inc | 130.430 | 0,94 | 3.943 | -9,30 | ||||
| 2026-02-13 | 13F | Manufacturers Life Insurance Company, The | 0 | -100,00 | 0 | |||||
| 2026-02-12 | 13F | Loomis Sayles & Co L P | 320.073 | -17,93 | 9.538 | -19,09 | ||||
| 2025-09-25 | NP | DFA INVESTMENT DIMENSIONS GROUP INC - World ex U.S. Core Equity Portfolio Institutional Class Shares | 255.427 | 0,00 | 8.608 | 0,41 | ||||
| 2026-02-13 | 13F | MAI Capital Management | 713 | -30,84 | 21 | -32,26 | ||||
| 2026-02-13 | 13F | Blueshift Asset Management, LLC | 26.414 | 31,22 | 787 | 29,44 | ||||
| 2025-09-25 | NP | Dfa Investment Trust Co - The Emerging Markets Series This fund is a listed as child fund of Dimensional Fund Advisors Lp and if that institution has disclosed ownership in this security, then these positions will not be double counted when calculating total shares and total value | 649.988 | 0,00 | 21.905 | 0,42 | ||||
| 2025-11-13 | 13F | Quantitative Investment Management, LLC | 0 | -100,00 | 0 | |||||
| 2026-02-17 | 13F | FACT Capital, LP | 431.346 | -14,69 | 12.854 | -15,90 | ||||
| 2026-02-13 | 13F | Walleye Capital LLC | 9.557 | 285 | ||||||
| 2025-11-13 | 13F | Capital Fund Management S.a. | 0 | -100,00 | 0 | -100,00 | ||||
| 2026-01-20 | 13F | AdvisorNet Financial, Inc | 634 | 0,00 | 19 | -5,26 | ||||
| 2025-11-13 | 13F | Capital Fund Management S.a. | Call | 0 | -100,00 | 0 | -100,00 | |||
| 2026-02-11 | 13F | Capital International Investors | 13.070.452 | -35,65 | 389.516 | -36,56 | ||||
| 2026-02-13 | 13F | Walleye Capital LLC | Call | 15.400 | 459 | |||||
| 2026-02-13 | 13F | Walleye Capital LLC | Put | 30.300 | 903 | |||||
| 2026-02-17 | 13F | Citadel Advisors Llc | 2.920.105 | 677,30 | 87.019 | 666,28 | ||||
| 2026-02-17 | 13F | Citadel Advisors Llc | Put | 140.100 | 47,47 | 4.175 | 45,38 | |||
| 2026-02-17 | 13F | Citadel Advisors Llc | Call | 98.100 | -50,75 | 2.923 | -51,45 | |||
| 2026-02-05 | 13F | Td Private Client Wealth Llc | 992 | 35,89 | 30 | 31,82 | ||||
| 2026-02-12 | 13F | Federated Hermes, Inc. | 69.277 | -47,17 | 2.064 | -47,93 | ||||
| 2026-02-10 | 13F | EagleClaw Capital Managment, LLC | 19.250 | 0,00 | 574 | -1,38 | ||||
| 2026-01-30 | 13F | R Squared Ltd | 33.679 | 136,11 | 1.004 | 132,71 | ||||
| 2026-02-11 | 13F | Prudential Plc | 725.100 | 7,25 | 21.644 | 5,90 | ||||
| 2026-02-13 | 13F | Rhumbline Advisers | 394.992 | -4,24 | 11.771 | -5,61 | ||||
| 2026-02-11 | 13F | Capital Wealth Planning, LLC | 198.300 | -45,45 | 5.947 | -45,89 | ||||
| 2026-01-27 | 13F | TD Waterhouse Canada Inc. | 3.086 | 2,25 | 92 | -1,09 | ||||
| 2025-09-26 | NP | INVESCO ACTIVELY MANAGED EXCHANGE-TRADED FUND TRUST - Invesco Global Equity Net Zero ETF | 24.084 | 812 | ||||||
| 2026-02-17 | 13F | EFG International AG | 823.406 | 24.558 | ||||||
| 2026-02-11 | 13F | Deutsche Bank Ag\ | 5.917.302 | 105,98 | 176.336 | 103,05 | ||||
| 2026-01-29 | 13F | IMC-Chicago, LLC | 16.353 | -37,36 | 487 | -38,28 | ||||
| 2026-01-27 | 13F | WealthCollab, LLC | 2.958 | -5,04 | 88 | -6,38 | ||||
| 2026-01-29 | 13F | IMC-Chicago, LLC | Put | 49.500 | 27,25 | 1.475 | 25,53 | |||
| 2026-02-13 | 13F | Smartleaf Asset Management LLC | 7.031 | 3,64 | 210 | 1,95 | ||||
| 2026-02-13 | 13F | Acumen Wealth Advisors, LLC | 310 | 9 | ||||||
| 2026-01-29 | 13F | IMC-Chicago, LLC | Call | 49.000 | -47,31 | 1.460 | -48,06 | |||
| 2026-02-24 | 13F | Bell Investment Advisors, Inc | 2.093 | 64,93 | 62 | 63,16 | ||||
| 2025-09-26 | NP | JIJIX - John Hancock International Dynamic Growth Fund Class NAV | 2.103.700 | 20,86 | 70.895 | 21,36 | ||||
| 2026-02-03 | 13F | Manning & Napier Advisors Llc | 0 | -100,00 | 0 | |||||
| 2026-02-11 | 13F | O'shaughnessy Asset Management, Llc | 248.199 | -3,83 | 7.396 | -5,20 | ||||
| 2025-11-14 | 13F | Wolverine Trading, Llc | 10.206 | -49,46 | 309 | -54,76 | ||||
| 2026-01-23 | 13F | LOM Asset Management Ltd | 1.600 | 0,00 | 48 | -2,08 | ||||
| 2025-11-14 | 13F | Wolverine Trading, Llc | Call | 48.800 | -6,15 | 1.479 | -16,01 | |||
| 2026-01-29 | 13F | Nbc Securities, Inc. | 874 | -0,57 | 26 | 0,00 | ||||
| 2026-02-09 | 13F | Knights of Columbus Asset Advisors LLC | 6.737 | 0,00 | 201 | -1,48 | ||||
| 2026-02-17 | 13F/A | Northwest & Ethical Investments L.P. | 117.250 | -6,76 | 3.494 | -8,08 | ||||
| 2026-01-14 | 13F | Generali Investments CEE, investicni spolecnost, a.s. | 81.292 | -25,41 | 2.423 | -26,47 | ||||
| 2026-02-02 | 13F | Benjamin Edwards Inc | 12.511 | 34,57 | 373 | 32,38 | ||||
| 2026-02-13 | 13F | Charles-Lim Capital Ltd | 1.625.000 | -27,78 | 48.425 | -28,80 | ||||
| 2026-02-11 | 13F | Axiom International Investors Llc /de | 1.840.970 | -63,75 | 54.861 | -64,26 | ||||
| 2026-02-09 | 13F | Fisher Asset Management, LLC | 1.783.698 | 16,21 | 53.154 | 14,56 | ||||
| 2026-01-26 | 13F | Moran Wealth Management, LLC | 153.800 | 11,56 | 4.583 | 9,98 | ||||
| 2026-02-17 | 13F | Delaware Management Holdings, Inc. | 179.191 | 5.339 | ||||||
| 2026-01-26 | 13F | Haven Global Partners, LLC | 640.656 | 13,90 | 19.092 | 12,27 | ||||
| 2026-02-06 | 13F | Envestnet Portfolio Solutions, Inc. | 44.851 | -6,04 | 1.337 | -7,35 | ||||
| 2026-03-04 | 13F | Rehmann Capital Advisory Group | 8.692 | -4,80 | 259 | -6,16 | ||||
| 2026-02-17 | 13F | D. E. Shaw & Co., Inc. | 5.920.209 | 21.119,39 | 176.422 | 20.827,88 | ||||
| 2026-02-24 | 13F | DGS Capital Management, LLC | 9.016 | -17,23 | 269 | -18,54 | ||||
| 2026-01-22 | 13F | Personal Cfo Solutions, Llc | 30.772 | 2,09 | 917 | 0,55 | ||||
| 2026-01-16 | 13F | Ronald Blue Trust, Inc. | 53.095 | -1,06 | 1.582 | -2,47 | ||||
| 2026-02-17 | 13F | Susquehanna International Group, Llp | Call | 120.000 | -66,80 | 3.576 | -67,28 | |||
| 2026-01-09 | 13F | SG Americas Securities, LLC | 879.789 | 23,34 | 26 | 23,81 | ||||
| 2026-02-09 | 13F | Key FInancial Inc | 274 | 0,00 | 8 | 0,00 | ||||
| 2026-02-17 | 13F | Susquehanna International Group, Llp | 127.615 | -42,89 | 3.803 | -43,71 | ||||
| 2026-02-04 | 13F | C WorldWide Group Holding A/S | 1.992.068 | -17,28 | 59 | -18,06 | ||||
| 2026-02-17 | 13F | Susquehanna International Group, Llp | Put | 72.900 | 57,11 | 2.172 | 54,92 | |||
| 2025-09-25 | NP | TOUS - T. Rowe Price International Equity ETF | 74.571 | 17,65 | 2.513 | 18,15 | ||||
| 2026-02-12 | 13F | McMillan Office, Inc. | 1.650 | 49 | ||||||
| 2026-02-04 | 13F | ABN AMRO Bank N.V. | 26.000 | 0,00 | 772 | -1,53 | ||||
| 2025-09-25 | NP | abrdn Funds - abrdn Emerging Markets Dividend Active ETF | 65.105 | 2,03 | 2.194 | 2,48 | ||||
| 2026-02-13 | 13F | Pinpoint Asset Management (Singapore) Pte. Ltd. | 0 | -100,00 | 0 | |||||
| 2026-01-16 | 13F | Banque Pictet & Cie Sa | 107.487 | -7,98 | 3.203 | -9,26 | ||||
| 2026-02-06 | 13F | Americana Partners, LLC | 16.341 | -4,14 | 487 | -5,63 | ||||
| 2026-02-11 | 13F | Buckingham Strategic Partners | 26.772 | -11,72 | 798 | -13,09 | ||||
| 2026-02-13 | 13F | Toroso Investments, LLC | 256.574 | -1,16 | 7.646 | -2,57 | ||||
| 2026-01-29 | 13F | UMA Financial Services, Inc. | 158 | 393,75 | 5 | |||||
| 2026-02-04 | 13F | Tsfg, Llc | 1.800 | 0,00 | 0 | |||||
| 2025-09-26 | NP | RTNAX - Tax-Managed International Equity Fund Class A | 149.631 | 0,00 | 5.043 | 0,42 | ||||
| 2026-02-11 | 13F | OPTIMAS CAPITAL Ltd | 55.000 | 1.639 | ||||||
| 2026-02-11 | 13F | Fox Run Management, L.l.c. | 12.790 | -27,89 | 381 | -28,92 | ||||
| 2026-02-13 | 13F | Neuberger Berman Group LLC | 498.364 | -6,13 | 14.854 | -7,48 | ||||
| 2025-09-25 | NP | DAADX - Emerging Markets ex China Core Equity Portfolio Institutional Class | 203.224 | -19,19 | 6.849 | -18,85 | ||||
| 2026-02-12 | 13F | Ci Investments Inc. | 0 | -100,00 | 0 | |||||
| 2026-02-12 | 13F | Lansforsakringar Fondforvaltning AB (publ) | 44.116 | 1.315 | ||||||
| 2026-02-12 | 13F | Raiffeisen Bank International AG | 0 | -100,00 | 0 | |||||
| 2026-02-11 | 13F | West Family Investments, Inc. | 52.750 | -3,34 | 1.572 | -4,73 | ||||
| 2026-02-14 | 13F | Militia Capital Partners, LP | 7.000 | 209 | ||||||
| 2026-02-17 | 13F | Summit Trail Advisors, Llc | 0 | -100,00 | 0 | |||||
| 2026-01-29 | 13F | Matthews International Capital Management Llc | 369.492 | -0,08 | 11.011 | -1,50 | ||||
| 2026-01-29 | 13F | Vanguard Group Inc | 960.233 | -1,85 | 28.615 | -3,25 | ||||
| 2026-02-12 | 13F | Polen Capital Management Llc | 0 | -100,00 | 0 | |||||
| 2025-09-26 | NP | FBCG - Fidelity Blue Chip Growth ETF This fund is a listed as child fund of Fmr Llc and if that institution has disclosed ownership in this security, then these positions will not be double counted when calculating total shares and total value | 97.283 | 0,53 | 3.278 | 0,95 | ||||
| 2025-11-07 | 13F | Pzena Investment Management Llc | 0 | -100,00 | 0 | -100,00 | ||||
| 2026-02-13 | 13F | Cornerstone Financial Management LLC | 406 | 12 | ||||||
| 2026-02-17 | 13F | Man Group plc | 9.070.256 | 34,60 | 270.294 | 32,68 | ||||
| 2026-02-11 | 13F | Capital International Ltd /ca/ | 364.069 | -16,91 | 10.849 | -18,09 | ||||
| 2026-02-18 | 13F | Guardian Capital Lp | 478.281 | 1,81 | 14.253 | 0,36 | ||||
| 2026-02-18 | 13F | Mackenzie Financial Corp | 1.220.907 | -12,31 | 36.372 | -13,58 | ||||
| 2026-01-29 | 13F | D.a. Davidson & Co. | 7.847 | -0,95 | 234 | -2,51 | ||||
| 2026-02-17 | 13F | Guggenheim Capital Llc | 50.359 | 5,07 | 1.501 | 3,59 | ||||
| 2026-02-14 | 13F | Frec Markets, Inc. | 8.669 | 258 | ||||||
| 2026-02-17 | 13F | Creative Planning | 42.372 | -17,93 | 1.263 | -19,10 | ||||
| 2025-11-07 | 13F | Beacon Capital Management, LLC | 0 | -100,00 | 0 | |||||
| 2026-02-10 | 13F | State of Wyoming | 25.342 | -2,58 | 755 | -3,94 | ||||
| 2026-02-13 | 13F | Aigen Investment Management, Lp | 0 | -100,00 | 0 | |||||
| 2025-11-14 | 13F | Point72 Hong Kong Ltd | 0 | -100,00 | 0 | -100,00 | ||||
| 2026-02-13 | 13F | Bridgefront Capital, LLC | 21.346 | 636 | ||||||
| 2026-02-17 | 13F | Advisor Group Holdings, Inc. | 40.551 | -38,25 | 1.209 | -39,24 | ||||
| 2026-01-08 | 13F | Tuttle Tactical Management LLC | 14.569 | 434 | ||||||
| 2026-02-10 | 13F | Operose Advisors LLC | 0 | -100,00 | 0 | -100,00 | ||||
| 2026-02-17 | 13F | Price T Rowe Associates Inc /md/ | 6.774.963 | 0,33 | 202 | -1,47 | ||||
| 2026-01-13 | 13F | Granite Group Advisors, LLC | 7.384 | 0,00 | 220 | -1,35 | ||||
| 2026-02-17 | 13F | Shelton Capital Management | 15.723 | -14,19 | 469 | -15,37 | ||||
| 2026-02-12 | 13F | Barings Llc | 10.724 | 7,63 | 320 | 5,98 | ||||
| 2026-01-06 | 13F | Nelson, Van Denburg & Campbell Wealth Management Group, LLC | 12.076 | -0,21 | 360 | -1,64 | ||||
| 2026-02-10 | 13F | Daiwa Securities Group Inc. | 4.862.631 | 4,66 | 145 | -21,74 | ||||
| 2026-02-19 | 13F | Invesco Ltd. | 21.643.517 | -7,54 | 644.977 | -8,85 | ||||
| 2025-11-06 | 13F | Mitchell Capital Management Co | 0 | -100,00 | 0 | |||||
| 2025-09-26 | NP | FFGX - Fidelity Fundamental Global ex-U.S. ETF | 13.364 | 14,02 | 450 | 14,50 | ||||
| 2026-02-17 | 13F | Snowden Capital Advisors LLC | 43.606 | -3,30 | 1.299 | -4,70 | ||||
| 2026-02-17 | 13F | Fred Alger Management, Llc | 20.633 | -94,33 | 615 | -94,42 | ||||
| 2026-02-06 | 13F | Handelsbanken Fonder AB | 67.467 | 19,66 | 2 | 100,00 | ||||
| 2026-01-09 | 13F | Assenagon Asset Management S.A. | 1.215.868 | 23,01 | 36.233 | 21,25 | ||||
| 2026-02-10 | 13F | Fideuram Asset Management (Ireland) dac | 2.630 | 79 | ||||||
| 2026-02-12 | 13F | Hollencrest Capital Management | 0 | -100,00 | 0 | |||||
| 2026-01-23 | 13F | BSW Wealth Partners | 28.179 | -2,70 | 840 | -4,11 | ||||
| 2026-01-30 | 13F | Laurel Wealth Advisors LLC | 102 | 3 | ||||||
| 2026-02-17 | 13F | HighVista Strategies LLC | 26.284 | -29,05 | 783 | -30,03 | ||||
| 2026-02-11 | 13F | Group One Trading, L.p. | Put | 89.100 | -7,67 | 2.655 | -8,98 | |||
| 2026-01-21 | 13F | Albion Financial Group /ut | 176 | 0,00 | 5 | 0,00 | ||||
| 2026-02-11 | 13F | Group One Trading, L.p. | Call | 101.600 | -9,20 | 3.028 | -10,50 | |||
| 2026-02-23 | 13F | Virtu Financial LLC | 54.705 | 92,49 | 2 | |||||
| 2026-02-17 | 13F | Raymond James Financial Inc | 735.389 | 4,63 | 21.915 | 3,14 | ||||
| 2025-09-25 | NP | TRIGX - T. Rowe Price International Value Equity Fund This fund is a listed as child fund of Price T Rowe Associates Inc /md/ and if that institution has disclosed ownership in this security, then these positions will not be double counted when calculating total shares and total value | 1.913.357 | 2,88 | 64.480 | 3,31 | ||||
| 2025-09-25 | NP | GAOAX - JPMorgan Global Allocation Fund Class A | 23.250 | -55,81 | 784 | -55,64 | ||||
| 2026-02-09 | 13F | William Blair Investment Management, Llc | 1.605.841 | -15,37 | 47.840 | -16,59 | ||||
| 2026-02-17 | 13F | Glenmede Trust Co Na | 57.668 | -4,52 | 1.719 | -9,72 | ||||
| 2026-02-02 | 13F | CENTRAL TRUST Co | 33 | 1 | ||||||
| 2026-02-11 | 13F | Janney Montgomery Scott LLC | 27.844 | 2,04 | 1 | |||||
| 2026-02-12 | 13F | M&G Plc | 186.848 | 50,82 | 5.605 | 50,83 | ||||
| 2026-02-10 | 13F | Triglav Skladi, D.o.o. | 81.379 | 28,41 | 2.425 | 26,63 | ||||
| 2025-09-22 | NP | MMITX - Multi-Manager International Equity Fund Class P Shares | 256.549 | -8,34 | 8.646 | -7,96 | ||||
| 2025-09-24 | NP | BLACKROCK ASIAN DRAGON FUND, INC. - BLACKROCK ASIAN DRAGON FUND, INC. Investor A This fund is a listed as child fund of BlackRock, Inc. and if that institution has disclosed ownership in this security, then these positions will not be double counted when calculating total shares and total value | 3.770 | 127 | ||||||
| 2025-10-22 | 13F | OneAscent Financial Services LLC | 0 | -100,00 | 0 | |||||
| 2026-02-09 | 13F | Cary Street Partner Investment Advisory Llc | 0 | -100,00 | 0 | |||||
| 2026-02-12 | 13F | Commonwealth Equity Services, Llc | 16.128 | 13,61 | 481 | |||||
| 2026-02-11 | 13F | LPL Financial LLC | 494.043 | 10,79 | 14.722 | 9,21 | ||||
| 2026-02-04 | 13F | Aubrey Capital Management Ltd | 8.600 | -98,04 | 256 | -98,07 | ||||
| 2026-01-23 | 13F | Stanley-Laman Group, Ltd. | 20.000 | -20,00 | 596 | -21,06 | ||||
| 2026-02-13 | 13F | JustInvest LLC | 281.752 | 11,51 | 8.396 | 9,92 | ||||
| 2026-02-03 | 13F | Mitsubishi UFJ Kokusai Asset Management Co., Ltd. | 0 | -100,00 | 0 | |||||
| 2026-01-30 | 13F | Amansa Capital Pte. Ltd. | 5.000.000 | -16,67 | 149.000 | -17,85 | ||||
| 2025-11-04 | 13F/A | Lingohr & Partner Asset Management GmbH | 48.000 | 1 | ||||||
| 2026-02-17 | 13F | Fmr Llc | 2.262.454 | -1,00 | 67.421 | -2,41 | ||||
| 2025-11-07 | 13F | Sierra Ocean, Llc | 0 | -100,00 | 0 | |||||
| 2026-02-13 | 13F | Templeton & Phillips Capital Management, LLC | 0 | -100,00 | 0 | |||||
| 2026-02-13 | 13F | Dai-Ichi Life Insurance Company, Ltd | 16.400 | 0,00 | 489 | -1,41 | ||||
| 2025-09-25 | NP | JETIX - abrdn Global Equity Impact Fund Institutional Class | 53.905 | -3,85 | 1.817 | -3,46 | ||||
| 2025-09-29 | NP | Calamos Global Dynamic Income Fund | 152.426 | -2,76 | 5.137 | -2,36 | ||||
| 2026-02-12 | 13F | Xponance, Inc. | 11.271 | 5,55 | 336 | 4,04 | ||||
| 2026-02-13 | 13F | Pinnacle Wealth Planning Services, Inc. | 20.074 | -0,18 | 598 | -1,48 | ||||
| 2026-02-13 | 13F | Corient IA LLC | 0 | -100,00 | 0 | |||||
| 2026-02-17 | 13F | Cetera Investment Advisers | 114.558 | 0,40 | 3.414 | -1,04 | ||||
| 2026-02-17 | 13F | Cresset Asset Management, LLC | 17.989 | 11,67 | 536 | 10,29 | ||||
| 2026-02-13 | 13F | State Street Corp | 8.345.467 | -1,29 | 248.695 | -2,70 | ||||
| 2026-01-21 | 13F | Yousif Capital Management, Llc | 27.441 | 0,00 | 810 | -2,41 | ||||
| 2026-02-06 | 13F | Cullen/frost Bankers, Inc. | 1.709 | 40,08 | 51 | 38,89 | ||||
| 2026-02-06 | 13F | EverSource Wealth Advisors, LLC | 16.609 | 0,42 | 495 | -1,20 | ||||
| 2026-01-14 | 13F | Jfs Wealth Advisors, Llc | 2.770 | 0,00 | 83 | -1,20 | ||||
| 2026-02-13 | 13F | Motiv8 Investments LLC | 83 | 0 | ||||||
| 2026-02-13 | 13F | Black Creek Investment Management Inc. | 34.683 | -59,09 | 1.034 | -59,68 | ||||
| 2025-11-14 | 13F | PineBridge Investments, L.P. | 959.750 | -1,03 | 29.013 | -11,06 | ||||
| 2026-02-17 | 13F | FIL Ltd | 7.481.727 | -30,80 | 222.955 | -31,79 | ||||
| 2026-02-12 | 13F/A | Pinebridge Investments Llc | 12.850 | 383 | ||||||
| 2025-11-04 | 13F | High Note Wealth, LLC | 0 | -100,00 | 0 | |||||
| 2026-01-09 | 13F | Dynamic Advisor Solutions LLC | 7.760 | -6,97 | 231 | -8,33 | ||||
| 2026-02-11 | 13F | Crestwood Capital Management, L.P. | 678.900 | 0,00 | 20.231 | -1,42 | ||||
| 2025-10-24 | 13F | Opal Wealth Advisors, LLC | 0 | -100,00 | 0 | |||||
| 2026-01-05 | 13F | GAMMA Investing LLC | 18.210 | -5,60 | 543 | -7,03 | ||||
| 2026-01-28 | 13F | Oversea-Chinese Banking CORP Ltd | 345.647 | 128,61 | 10.295 | 125,27 | ||||
| 2026-02-13 | 13F | National Bank Of Canada /fi/ | 3.646.451 | -16,30 | 108.664 | -17,49 | ||||
| 2025-10-09 | 13F | Redhawk Wealth Advisors, Inc. | 0 | -100,00 | 0 | |||||
| 2026-02-05 | 13F | Center for Financial Planning, Inc. | 371 | 0,00 | 11 | 0,00 | ||||
| 2026-02-14 | 13F | Whipplewood Advisors, LLC | 125 | 4 | ||||||
| 2026-01-21 | 13F | SJS Investment Consulting Inc. | 193 | 6 | ||||||
| 2026-02-12 | 13F | Advisors Asset Management, Inc. | 0 | -100,00 | 0 | |||||
| 2026-02-13 | 13F | Strategic Global Advisors, LLC | 13.660 | 38,26 | 407 | 36,58 | ||||
| 2026-01-15 | 13F | Nisa Investment Advisors, Llc | 229 | 7 | ||||||
| 2025-11-14 | 13F | EFG Asset Management (Americas) Corp. | 46.922 | 0,29 | 1.418 | -9,85 | ||||
| 2026-02-11 | 13F | Allianz Asset Management GmbH | 479.312 | -34,91 | 14.283 | -35,84 | ||||
| 2026-02-12 | 13F | Douglass Winthrop Advisors, LLC | 10.862 | -0,06 | 324 | -1,52 | ||||
| 2026-02-02 | 13F | Fifth Third Bancorp | 1.366 | 4,51 | 41 | 2,56 | ||||
| 2026-02-17 | 13F | Cape Investment Advisory, Inc. | 216 | -0,46 | 6 | 0,00 | ||||
| 2026-02-17 | 13F | Credit Agricole S A | 646.829 | 118,77 | 19.276 | 115,65 | ||||
| 2025-09-25 | NP | RGLGX - American Funds Global Insight Fund Class R-6 This fund is a listed as child fund of Capital World Investors and if that institution has disclosed ownership in this security, then these positions will not be double counted when calculating total shares and total value | 309.432 | 0,00 | 10.428 | 0,41 | ||||
| 2026-01-16 | 13F | Crewe Advisors LLC | 118 | 32,58 | 4 | 50,00 | ||||
| 2026-02-10 | 13F | Quantbot Technologies LP | 64.354 | 1.918 | ||||||
| 2025-11-12 | 13F | Accuvest Global Advisors | 0 | -100,00 | 0 | |||||
| 2025-11-13 | 13F | Change Path, LLC | 0 | -100,00 | 0 | |||||
| 2026-02-13 | 13F | Cullen Capital Management, LLC | 1.747.387 | 1,02 | 52.072 | -0,42 | ||||
| 2026-02-17 | 13F | Quadrature Capital Ltd | 333.495 | 9.938 | ||||||
| 2026-02-13 | 13F | Squarepoint Ops LLC | 516.644 | 276,72 | 15.396 | 271,41 | ||||
| 2026-02-17 | 13F | Think Investments LP | 1.292.200 | 0,00 | 38.508 | -1,42 | ||||
| 2026-02-11 | 13F | Ovata Capital Management Ltd | 144.100 | 4.306 | ||||||
| 2026-01-15 | 13F | Allspring Global Investments Holdings, LLC | 469.477 | 5,71 | 14.080 | 3,81 | ||||
| 2026-01-23 | 13F | Assetmark, Inc | 169.081 | 7,23 | 5.039 | 5,71 | ||||
| 2026-03-11 | 13F | Leonteq Securities AG | Put | 0 | -100,00 | 0 | ||||
| 2026-02-10 | 13F | Bnp Paribas Arbitrage, Sa | 6.128.057 | -0,73 | 182.616 | -2,14 | ||||
| 2026-01-12 | 13F | VisionPoint Advisory Group, LLC | 62.252 | 6,26 | 1.855 | 4,80 | ||||
| 2026-02-18 | 13F | EP Wealth Advisors, Inc. | 20.476 | 106,14 | 610 | 82,63 | ||||
| 2025-09-24 | NP | EMQAX - Ashmore Emerging Markets Active Equity Fund CLASS A | 15.704 | -51,47 | 529 | -51,24 | ||||
| 2026-02-11 | 13F | Parallel Advisors, LLC | 14.415 | -0,05 | 430 | -1,38 | ||||
| 2026-01-22 | 13F | Financial Consulate, Inc | 54 | 2 | ||||||
| 2026-01-29 | 13F | Rakuten Securities, Inc. | 2.077 | 50,18 | 62 | 48,78 | ||||
| 2026-01-30 | 13F | Us Bancorp \de\ | 354.965 | -0,78 | 10.578 | -2,19 | ||||
| 2026-01-21 | 13F | Naviter Wealth, LLC | 51.599 | -17,64 | 1.538 | -18,81 | ||||
| 2026-02-11 | 13F | CenterBook Partners LP | 37.647 | 1.122 | ||||||
| 2026-02-11 | 13F | Capital International Inc /ca/ | 540.613 | -12,42 | 16.110 | -13,67 | ||||
| 2026-02-13 | 13F | Transamerica Financial Advisors, Inc. | 1.311 | 39 | ||||||
| 2025-09-29 | NP | Calamos Global Total Return Fund | 40.925 | -2,56 | 1.379 | -2,13 | ||||
| 2026-01-20 | 13F | Signaturefd, Llc | 47.843 | 0,83 | 1.426 | -0,63 | ||||
| 2026-02-17 | 13F | Northern Trust Corp | 3.638.386 | -1,71 | 108.424 | -3,11 | ||||
| 2026-01-14 | 13F | Thompson Investment Management, Inc. | 5.940 | 0,00 | 177 | -1,12 | ||||
| 2026-02-13 | 13F | Bollard Group LLC | 6.978 | 0 | ||||||
| 2026-02-17 | 13F | Tudor Investment Corp Et Al | 383.077 | 11.416 | ||||||
| 2026-02-10 | 13F | Channing Global Advisors, Llc | 84.938 | 1,17 | 2.531 | -0,28 | ||||
| 2025-09-25 | NP | TIER - T. Rowe Price International Equity Research ETF | 2.261 | 76 | ||||||
| 2025-09-26 | NP | RMYAX - Multi-Strategy Income Fund Class A | 18.726 | -0,55 | 631 | 0,00 | ||||
| 2026-02-12 | 13F | Mount Yale Investment Advisors, LLC | 16.466 | 491 | ||||||
| 2026-01-14 | 13F | Klein Pavlis & Peasley Financial, Inc. | 123.827 | 13,35 | 3.690 | 11,75 | ||||
| 2026-01-30 | 13F | Rachor Investment Advisory Services, LLC | 52 | 2 | ||||||
| 2026-02-10 | 13F | Murphy & Mullick Capital Management Corp | 2.530 | 0,00 | 75 | -1,32 | ||||
| 2025-09-26 | NP | FBGRX - Fidelity Blue Chip Growth Fund This fund is a listed as child fund of Fmr Llc and if that institution has disclosed ownership in this security, then these positions will not be double counted when calculating total shares and total value | 1.008.159 | 13,40 | 33.975 | 13,88 | ||||
| 2026-02-06 | 13F | Vestmark Advisory Solutions, Inc. | 16.297 | 486 | ||||||
| 2025-09-29 | NP | EMWLX - Lord Abbett Emerging Markets Equity Fund Class R6 | 3.049 | -4,06 | 103 | -3,77 | ||||
| 2026-02-10 | 13F | Lido Advisors, LLC | 13.567 | 0,00 | 409 | -0,24 | ||||
| 2025-09-26 | NP | FEMYX - Fidelity Series Sustainable Emerging Markets Fund | 11.085 | 37,65 | 374 | 38,15 | ||||
| 2026-02-09 | 13F | Wcm Investment Management, Llc | 53.308.528 | -1,59 | 1.591.260 | -3,08 | ||||
| 2026-02-17 | 13F | Limestone Investment Advisors LP | 57.300 | 1.708 | ||||||
| 2026-01-26 | 13F | Paradigm Financial Partners, Llc | 242.271 | 20,21 | 7.220 | 18,50 | ||||
| 2025-09-29 | NP | RGEF - Rockefeller Global Equity ETF | 263.433 | -1,25 | 8.878 | -0,84 | ||||
| 2026-02-13 | 13F | Kestra Advisory Services, LLC | 0 | -100,00 | 0 | |||||
| 2025-09-26 | NP | FBCGX - Fidelity Blue Chip Growth K6 Fund This fund is a listed as child fund of Fmr Llc and if that institution has disclosed ownership in this security, then these positions will not be double counted when calculating total shares and total value | 225.536 | 11,67 | 7.601 | 12,14 | ||||
| 2026-02-12 | 13F | JPL Wealth Management, LLC | 0 | -100,00 | 0 | |||||
| 2026-01-30 | 13F | Sage Rhino Capital Llc | 0 | -100,00 | 0 | |||||
| 2026-01-30 | 13F | State of New Jersey Common Pension Fund D | 216.017 | 0,00 | 6.437 | -1,42 | ||||
| 2026-02-17 | 13F | Jump Financial, LLC | 683.794 | 20.377 | ||||||
| 2026-02-17 | 13F | Liontrust Investment Partners LLP | 283.445 | 7,90 | 8.447 | 6,36 | ||||
| 2025-09-22 | NP | GSIHX - Goldman Sachs GQG Partners International Opportunities Fund Class A Shares | 35.001.485 | 0,00 | 1.179.550 | 0,42 | ||||
| 2026-02-19 | 13F | Mcguire Capital Advisors Inc | 68 | 2 | ||||||
| 2025-09-25 | NP | DFA INVESTMENT DIMENSIONS GROUP INC - Emerging Markets Social Core Equity Portfolio Shares | 233.479 | 0,00 | 7.868 | 0,42 | ||||
| 2026-02-13 | 13F | Dynamic Technology Lab Private Ltd | 72.050 | 34,18 | 2.147 | 32,29 | ||||
| 2026-01-28 | 13F | Migdal Insurance & Financial Holdings Ltd. | 28.799 | -9,43 | 1 | |||||
| 2026-02-12 | 13F | BlackRock, Inc. | 8.438.158 | 47,45 | 251.457 | 45,36 | ||||
| 2026-02-17 | 13F | Henry James International Management Inc. | 141.848 | -0,13 | 4.227 | -1,54 | ||||
| 2026-02-13 | 13F | Schroder Investment Management Group | 7.547.726 | -4,44 | 224.922 | -5,80 | ||||
| 2025-09-25 | NP | DFEM - Dimensional Emerging Markets Core Equity 2 ETF | 1.091.706 | 5,24 | 36.790 | 5,68 | ||||
| 2026-02-17 | 13F | Fwl Investment Management, Llc | 343.892 | 10,93 | 10.248 | 9,35 | ||||
| 2026-02-06 | 13F | IFP Advisors, Inc | 16.348 | 0,41 | 487 | -1,02 | ||||
| 2026-02-10 | 13F | Savant Capital, LLC | 18.988 | 46,70 | 566 | 44,50 | ||||
| 2026-02-17 | 13F | Aqr Capital Management Llc | 318.357 | 60,89 | 9.487 | 58,62 | ||||
| 2026-02-17 | 13F | Hood River Capital Management LLC | 480 | 14 | ||||||
| 2026-01-30 | 13F | Ares Financial Consulting, LLC | 86 | 3 | ||||||
| 2026-01-22 | 13F | City Holding Co | 0 | -100,00 | 0 | |||||
| 2026-02-17 | 13F | PharVision Advisers, LLC | 9.246 | 276 | ||||||
| 2026-02-13 | 13F | Virtus ETF Advisers LLC | 93.717 | -54,21 | 2.793 | -54,87 | ||||
| 2025-09-25 | NP | TWAAX - Thrivent International Allocation Fund Class A | 23.115 | -34,12 | 779 | -33,90 | ||||
| 2025-12-09 | 13F/A | Tudor Investment Corp Et Al | Call | 0 | -100,00 | 0 | ||||
| 2025-11-07 | 13F | Credit Industriel Et Commercial | 0 | -100,00 | 0 | |||||
| 2025-10-07 | 13F | Thurston, Springer, Miller, Herd & Titak, Inc. | 0 | -100,00 | 0 | -100,00 | ||||
| 2025-11-07 | 13F | Credit Industriel Et Commercial | Put | 0 | -100,00 | 0 | ||||
| 2026-02-13 | 13F | Thornburg Investment Management Inc | 192.359 | -8,52 | 5.732 | -9,82 | ||||
| 2026-02-13 | 13F | Citigroup Inc | 436.013 | -46,52 | 12.993 | -47,28 | ||||
| 2026-01-27 | 13F | GHP Investment Advisors, Inc. | 13.300 | 0,00 | 396 | -1,49 | ||||
| 2026-01-26 | 13F | Mirae Asset Global Investments Co., Ltd. | 125.727 | 1,01 | 3.747 | -0,43 | ||||
| 2025-09-29 | NP | GTDDX - INVESCO Developing Markets Fund Class A | 1.328.137 | 44.758 | ||||||
| 2026-02-17 | 13F | Two Sigma Investments, Lp | 4.032.212 | 181,26 | 120.160 | 177,26 | ||||
| 2026-02-17 | 13F | Two Creeks Capital Management, LP | 115.114 | 0,00 | 3.430 | -1,41 | ||||
| 2026-02-12 | 13F | Jane Street Group, Llc | 1.703.511 | 461,30 | 50.765 | 453,35 | ||||
| 2026-02-10 | 13F | Td Asset Management Inc | 48.546 | 1,68 | 1.447 | 0,21 | ||||
| 2026-02-12 | 13F | Jane Street Group, Llc | Put | 8.500 | -1,16 | 253 | -2,32 | |||
| 2026-02-02 | 13F | Cornerstone Planning Group LLC | 1.332 | 0,00 | 39 | -2,50 | ||||
| 2026-02-12 | 13F | Jane Street Group, Llc | Call | 68.500 | -16,05 | 2.041 | -17,23 | |||
| 2026-01-21 | 13F | Flagship Harbor Advisors, Llc | 211 | 6 | ||||||
| 2026-02-09 | 13F | Legal & General Group Plc | 2.137 | 0,00 | 64 | -1,56 | ||||
| 2026-01-23 | 13F | Rsm Us Wealth Management Llc | 32.032 | -0,78 | 956 | -1,95 | ||||
| 2026-02-13 | 13F | Wealth Alliance | 8.235 | 2,82 | 245 | 1,24 | ||||
| 2026-03-06 | 13F | Hsbc Holdings Plc | Call | 0 | -100,00 | 0 | ||||
| 2026-01-16 | 13F | Compagnie Lombard Odier SCmA | 1.000 | 0,00 | 30 | -3,33 | ||||
| 2026-03-06 | 13F | Hsbc Holdings Plc | Put | 0 | -100,00 | 0 | ||||
| 2026-02-17 | 13F | XTX Topco Ltd | 284.203 | 217,91 | 8.469 | 213,43 | ||||
| 2026-02-11 | 13F | Capital Group Investment Management Pte. Ltd. | 20.505 | -41,46 | 611 | -42,25 | ||||
| 2026-02-13 | 13F | Eschler Asset Management LLP | 0 | -100,00 | 0 | |||||
| 2026-02-17 | 13F | Janus Henderson Group Plc | 54.167 | -3,61 | 1.613 | -5,06 | ||||
| 2026-01-26 | 13F | PDS Planning, Inc | 31.807 | -3,85 | 948 | -5,30 | ||||
| 2026-01-08 | 13F | Grove Bank & Trust | 4.122 | -0,39 | 123 | -2,40 | ||||
| 2026-02-13 | 13F | Pathstone Holdings, LLC | 329.168 | -0,22 | 9.809 | -1,64 | ||||
| 2026-02-09 | 13F | MQS Management LLC | 0 | -100,00 | 0 | |||||
| 2026-01-23 | 13F | Westside Investment Management, Inc. | 2.442 | 5,81 | 73 | 4,29 | ||||
| 2026-02-13 | 13F | Evelyn Partners Investment Management LLP | 4.801 | 0,00 | 143 | -1,38 | ||||
| 2026-03-02 | 13F | Tobam | 34.355 | 0,48 | 1 | 0,00 | ||||
| 2026-01-28 | 13F | Eagle Global Advisors Llc | 67.100 | 0,00 | 2.000 | -1,43 | ||||
| 2026-02-10 | 13F | Natixis Advisors, L.p. | 1.103.036 | -8,01 | 33 | -11,11 | ||||
| 2026-02-17 | 13F | Balyasny Asset Management Llc | 83.364 | 2.484 | ||||||
| 2025-09-29 | NP | LICAX - Lord Abbett International Equity Fund Class A | 124.576 | 16,91 | 4.198 | 17,39 | ||||
| 2026-02-10 | 13F | Bnp Paribas | 69.703 | 112,86 | 2.077 | 110,01 | ||||
| 2026-02-17 | 13F | Public Employees Retirement System Of Ohio | 441.153 | -0,57 | 13.146 | -1,99 | ||||
| 2025-09-26 | NP | FTLS - First Trust Long/Short Equity ETF This fund is a listed as child fund of First Trust Advisors Lp and if that institution has disclosed ownership in this security, then these positions will not be double counted when calculating total shares and total value | Short | -38.041 | -47,58 | -1.282 | -38,41 | |||
| 2025-09-24 | NP | BLACKROCK FUNDS - BlackRock Advantage Emerging Markets Fund Investor A Shares | 1.485 | -79,81 | 50 | -76,64 | ||||
| 2026-02-17 | 13F | Schonfeld Strategic Advisors LLC | 125.554 | 123,18 | 3.742 | 120,06 | ||||
| 2026-02-06 | 13F | Banque Cantonale Vaudoise | 23.886 | -0,27 | 712 | |||||
| 2026-02-11 | 13F | Erste Asset Management GmbH | 0 | 0 | ||||||
| 2026-01-08 | 13F | True Wealth Design, LLC | 514 | 115,06 | 15 | 114,29 | ||||
| 2025-09-26 | NP | REMSX - Emerging Markets Fund Class S | 35.314 | 78,01 | 1.190 | 78,95 | ||||
| 2026-01-28 | 13F | DekaBank Deutsche Girozentrale | 343.641 | 0,00 | 10 | 0,00 | ||||
| 2025-11-06 | 13F | Wealthstream Advisors, Inc. | 12.656 | 14,15 | 383 | 2,69 | ||||
| 2026-02-17 | 13F | Blair William & Co/il | 158.327 | -0,97 | 4.718 | -2,38 | ||||
| 2025-11-17 | 13F | Kestra Private Wealth Services, Llc | 0 | -100,00 | 0 | |||||
| 2026-01-22 | 13F | Venturi Wealth Management, LLC | 23.550 | 69,75 | 702 | 67,30 | ||||
| 2026-02-10 | 13F | Texas Yale Capital Corp. | 18.910 | 7,69 | 564 | 6,23 | ||||
| 2025-11-12 | 13F | Kcm Investment Advisors Llc | 0 | -100,00 | 0 | |||||
| 2026-02-04 | 13F | Mirabaud Asset Management Ltd | 35.066 | 1.018 | ||||||
| 2025-09-25 | NP | DFSE - Dimensional Emerging Markets Sustainability Core 1 ETF | 82.612 | 0,00 | 2.784 | 0,43 | ||||
| 2026-02-12 | 13F | Pitcairn Co | 0 | -100,00 | 0 | |||||
| 2026-02-09 | 13F | Bleakley Financial Group, LLC | 47.498 | 10,95 | 1.415 | 9,35 | ||||
| 2025-10-31 | 13F | Whittier Trust Co Of Nevada Inc | 0 | -100,00 | 0 | |||||
| 2025-11-14 | 13F | Cubist Systematic Strategies, LLC | 51.357 | -56,19 | 1.553 | -60,64 | ||||
| 2026-02-13 | 13F | GQG Partners LLC | 74.633.839 | -1,32 | 2.224.088 | -2,72 | ||||
| 2026-02-17 | 13F | Temasek Holdings (Private) Ltd | 29.195.789 | 11,30 | 870.035 | 9,72 | ||||
| 2026-02-13 | 13F | Centiva Capital, LP | 19.020 | 567 | ||||||
| 2026-02-06 | 13F | HighTower Advisors, LLC | 189.985 | 0,26 | 5.662 | -1,17 | ||||
| 2025-09-29 | NP | CNWGX - Calamos Evolving World Growth Fund Class A | 292.985 | -7,17 | 9.874 | -6,78 | ||||
| 2026-02-05 | 13F | Bessemer Group Inc | 85.629 | 0,24 | 3 | 0,00 | ||||
| 2025-11-06 | 13F | Oppenheimer & Co Inc | 0 | -100,00 | 0 | |||||
| 2026-02-13 | 13F | Stifel Financial Corp | 328.384 | -1,23 | 9.786 | -2,65 | ||||
| 2026-01-13 | 13F | Mather Group, Llc. | 0 | -100,00 | 0 | |||||
| 2026-01-23 | 13F | TT International Asset Management LTD | 279.407 | 8 | ||||||
| 2026-01-07 | 13F | Aventura Private Wealth, LLC | 0 | -100,00 | 0 | |||||
| 2026-01-16 | 13F | Standard Life Aberdeen plc | 422.772 | 5,03 | 12.599 | 3,76 | ||||
| 2026-01-23 | 13F | Deprince Race & Zollo Inc | 367.948 | 8,40 | 10.965 | 6,86 | ||||
| 2026-01-07 | 13F | Harbour Capital Advisors, LLC | 12.045 | -8,65 | 361 | -11,52 | ||||
| 2026-01-12 | 13F | Abound Wealth Management | 68 | 6,25 | 2 | 100,00 | ||||
| 2026-02-13 | 13F | Mml Investors Services, Llc | 215.023 | 5,55 | 6.408 | 4,04 | ||||
| 2026-01-13 | 13F | Kathmere Capital Management, LLC | 10.103 | 2,44 | 301 | 1,01 | ||||
| 2026-02-02 | 13F | CX Institutional | 40 | 0 | ||||||
| 2026-01-23 | 13F | Bridgewater Advisors Inc. | 25.452 | -1,43 | 746 | -3,37 | ||||
| 2026-02-05 | 13F | LGT Group Foundation | 12.747 | -80,78 | 380 | -81,23 | ||||
| 2026-01-21 | 13F | Aaron Wealth Advisors LLC | 25.610 | 13,16 | 763 | 11,55 | ||||
| 2025-11-14 | 13F | AXA Investment Managers S.A. | 800.401 | 24.196 | ||||||
| 2026-01-12 | 13F | Legacy Wealth Asset Management, LLC | 72.811 | -0,51 | 2.170 | -1,94 | ||||
| 2025-09-24 | NP | IMRFX - Columbia Global Opportunities Fund Class A | 31.303 | -4,12 | 1.055 | -3,74 | ||||
| 2026-02-17 | 13F | Advisory Services Network, LLC | 0 | -100,00 | 0 | |||||
| 2026-02-12 | 13F | Bank Of Montreal /can/ | 2.586.177 | 53,00 | 77.068 | 50,82 | ||||
| 2025-09-29 | NP | CAGEX - Calamos Global Equity Fund Class A | 28.300 | 0,00 | 954 | 0,42 | ||||
| 2026-01-30 | 13F | Samalin Investment Counsel, LLC | 9.523 | 0,09 | 284 | -1,39 | ||||
| 2026-02-11 | 13F | Jpmorgan Chase & Co | Call | 107.500 | 0,00 | 3.204 | -1,42 | |||
| 2026-01-30 | 13F | Arlington Trust Co LLC | 0 | -100,00 | 0 | |||||
| 2025-11-12 | 13F | Itau Unibanco Holding S.A. | 0 | -100,00 | 0 | |||||
| 2026-02-11 | 13F | Jpmorgan Chase & Co | 15.422.841 | -16,40 | 459.601 | -17,59 | ||||
| 2026-01-26 | 13F | Cwm, Llc | 8.858 | 11,30 | 0 | |||||
| 2026-02-17 | 13F | Laird Norton Trust Company, Llc | 200.866 | 5.986 | ||||||
| 2026-02-12 | 13F | Steward Partners Investment Advisory, Llc | 14.387 | -86,97 | 429 | -87,17 | ||||
| 2026-02-02 | 13F | Truist Financial Corp | 57.360 | -1,81 | 1.709 | -3,17 | ||||
| 2025-09-26 | NP | BLACKROCK FUNDS - BlackRock Emerging Markets ex-China Fund Investor A This fund is a listed as child fund of BlackRock, Inc. and if that institution has disclosed ownership in this security, then these positions will not be double counted when calculating total shares and total value | 2.742 | 0,00 | 92 | 0,00 | ||||
| 2026-02-13 | 13F | PCM Encore, LLC | 58.251 | 1.736 | ||||||
| 2026-02-12 | 13F | Triumph Capital Management | 24 | 1 | ||||||
| 2026-02-17 | 13F | Driehaus Capital Management Llc | 4.063.452 | -24,18 | 121.091 | -25,26 | ||||
| 2026-01-23 | 13F | Hardman Johnston Global Advisors LLC | 5.526.617 | -3,65 | 164.693 | -5,02 | ||||
| 2025-11-07 | 13F | Avestar Capital, LLC | 0 | -100,00 | 0 | |||||
| 2026-02-13 | 13F | Healthcare Of Ontario Pension Plan Trust Fund | 2.413.800 | 19,86 | 71.931 | 18,16 | ||||
| 2026-02-05 | 13F | Lockheed Martin Investment Management Co | 33.100 | -92,16 | 986 | -92,27 | ||||
| 2026-02-13 | 13F | Y-Intercept (Hong Kong) Ltd | 108.890 | 3.245 | ||||||
| 2025-09-26 | NP | ALGAX - Alger International Focus Fund Class A | 155.471 | -1,06 | 5.239 | -0,64 | ||||
| 2026-02-05 | 13F | Atria Investments Llc | 42.393 | 11,10 | 1.263 | 9,54 | ||||
| 2026-02-17 | 13F | Alua Capital Management LP | 4.105.717 | 0,00 | 122.350 | -1,42 | ||||
| 2026-02-17 | 13F | Aperture Investors, LLC | 0 | -100,00 | 0 | |||||
| 2026-02-17 | 13F | Gilder Gagnon Howe & Co Llc | 996.262 | -2,30 | 29.689 | -3,69 | ||||
| 2026-01-28 | 13F | SP Asset Management LLC | 35.361 | 0,00 | 1.054 | -1,40 | ||||
| 2025-09-25 | NP | WINAX - Wilmington International Fund Class A Shares | 87.314 | -3,35 | 2.942 | -2,94 | ||||
| 2026-02-12 | 13F | Aviva Plc | 93.554 | -0,76 | 2.788 | -2,18 | ||||
| 2025-11-26 | 13F/A | Jpmorgan Chase & Co | Put | 0 | -100,00 | 0 | -100,00 | |||
| 2026-02-09 | 13F | Mondrian Investment Partners LTD | 4.177 | 21,21 | 124 | 19,23 | ||||
| 2026-02-09 | 13F | Hartland & Co., LLC | 25.654 | -3,63 | 764 | -4,98 | ||||
| 2026-01-05 | 13F | Rosenberg Matthew Hamilton | 9.633 | 0,00 | 287 | -1,37 | ||||
| 2026-02-13 | 13F | American Century Companies Inc | 5.344.540 | -2,46 | 159.267 | -3,84 | ||||
| 2026-02-17 | 13F | Engineers Gate Manager LP | 219.917 | 6.554 | ||||||
| 2026-01-29 | 13F | Veracity Capital LLC | 0 | -100,00 | 0 | |||||
| 2026-02-11 | 13F | Winton Capital Group Ltd | 14.500 | 432 | ||||||
| 2026-02-13 | 13F | First Trust Advisors Lp | 126.154 | -0,42 | 3.759 | -1,83 | ||||
| 2026-02-11 | 13F | J.Safra Asset Management Corp | 2.386 | 71 | ||||||
| 2026-01-26 | 13F | Private Trust Co Na | 189 | 0,00 | 6 | 0,00 | ||||
| 2026-01-30 | 13F | Valued Wealth Advisors LLC | 528 | 0,00 | 16 | 0,00 | ||||
| 2026-01-30 | 13F/A | M&t Bank Corp | 318.884 | 33,25 | 9.503 | 31,37 | ||||
| 2026-01-30 | 13F | Catalytic Wealth RIA, LLC | 21.959 | 16,92 | 654 | 15,34 | ||||
| 2026-02-13 | 13F | Sei Investments Co | 3.270.143 | 50,66 | 97.450 | 48,52 | ||||
| 2026-02-12 | 13F | Sustainable Insight Capital Management, LLC | 10.835 | 18,61 | 323 | 16,67 | ||||
| 2025-10-29 | 13F | Triasima Portfolio Management inc. | 0 | -100,00 | 0 | -100,00 | ||||
| 2026-02-17 | 13F | Qube Research & Technologies Ltd | 2.222.699 | 67,09 | 66.236 | 64,72 | ||||
| 2026-02-13 | 13F | Storgate, LLC | 15.174 | 452 | ||||||
| 2025-11-14 | 13F | Flow Traders U.s. Llc | 0 | -100,00 | 0 | |||||
| 2026-01-20 | 13F | Arta Finance Wealth Management LLC | 21.743 | 648 | ||||||
| 2026-02-04 | 13F | Hallmark Capital Management Inc | 109 | 3 | ||||||
| 2026-02-11 | 13F | Capital Group Private Client Services, Inc. | 27.904 | -2,61 | 832 | -4,04 | ||||
| 2026-02-17 | 13F | Agf Management Ltd | 13.624 | -99,58 | 406 | -99,59 | ||||
| 2026-01-28 | 13F | Geneos Wealth Management Inc. | 0 | -100,00 | 0 | |||||
| 2026-02-17 | 13F | Millennium Management Llc | 2.241.935 | -13,89 | 66.810 | -15,11 | ||||
| 2026-02-11 | 13F | United Financial Planning Group LLC | 329 | 10 | ||||||
| 2026-02-12 | 13F | Callan Family Office, LLC | 64.515 | 1.923 | ||||||
| 2025-09-29 | NP | LAVGX - Lord Abbett International Growth Fund Class R6 | 1.341 | 10,83 | 45 | 12,50 | ||||
| 2026-02-10 | 13F | CIBC World Markets Inc. | 17.121 | 31,56 | 510 | 29,77 | ||||
| 2026-02-11 | 13F | Vise Technologies, Inc. | 198.241 | 4,75 | 5.908 | 3,27 | ||||
| 2025-11-10 | 13F | Dakota Wealth Management | 0 | -100,00 | 0 | |||||
| 2026-02-02 | 13F | Principal Financial Group Inc | 1.768.169 | -2,94 | 52.691 | -4,32 | ||||
| 2026-02-12 | 13F | Skopos Labs, Inc. | 49.342 | 72,45 | 1.472 | 51,81 | ||||
| 2026-02-19 | 13F | CI Private Wealth, LLC | 104.424 | 7,86 | 3.109 | 6,22 | ||||
| 2026-02-18 | 13F | GWM Advisors LLC | 21.318 | -5,16 | 635 | -6,48 | ||||
| 2025-09-25 | NP | CBSE - Clough Select Equity ETF | 20.224 | 0,90 | 682 | 1,34 | ||||
| 2025-09-26 | NP | BLACKROCK EMERGING MARKETS FUND, INC. - BLACKROCK EMERGING MARKETS FUND, INC. Investor A This fund is a listed as child fund of BlackRock, Inc. and if that institution has disclosed ownership in this security, then these positions will not be double counted when calculating total shares and total value | 100.121 | 3.374 | ||||||
| 2026-02-03 | 13F | Ballentine Partners, LLC | 12.552 | 5,58 | 374 | 4,18 | ||||
| 2026-02-17 | 13F | Ancora Advisors, LLC | 5.594 | 1,71 | 167 | 0,00 | ||||
| 2026-02-12 | 13F | Dimensional Fund Advisors Lp | 11.733.336 | 1,17 | 349.660 | -0,27 | ||||
| 2026-02-13 | 13F | Umb Bank N A/mo | 5.375 | 11,38 | 160 | 10,34 | ||||
| 2026-02-17 | 13F | Two Sigma Securities, Llc | 0 | -100,00 | 0 | |||||
| 2026-02-13 | 13F | Bank Of Nova Scotia | 16.831 | 0,00 | 502 | -1,38 | ||||
| 2026-02-05 | 13F | May Hill Capital, LLC | 7.828 | -24,31 | 233 | -25,32 | ||||
| 2026-02-13 | 13F | Resources Investment Advisors, LLC. | 29.137 | -4,78 | 868 | -6,16 | ||||
| 2026-02-17 | 13F | Bayesian Capital Management, LP | 0 | -100,00 | 0 | |||||
| 2026-01-12 | 13F | Byrne Asset Management LLC | 550 | -4,35 | 16 | -5,88 | ||||
| 2026-01-08 | 13F | Versant Capital Management, Inc | 145 | 0,00 | 4 | 0,00 | ||||
| 2026-01-09 | 13F | Overbrook Management Corp | 100.596 | -10,19 | 2.998 | -11,49 | ||||
| 2026-02-17 | 13F | Alliancebernstein L.p. | 166.724 | 375,57 | 4.968 | 369,12 | ||||
| 2025-09-26 | NP | UUPIX - Ultraemerging Markets Profund Investor Class | 10.587 | 13,34 | 357 | 13,74 | ||||
| 2026-02-10 | 13F | NS Partners Ltd | 38.800 | -88,16 | 1.156 | -88,33 | ||||
| 2026-02-05 | 13F | Allworth Financial LP | 2.595 | 2,94 | 77 | 1,32 | ||||
| 2026-01-09 | 13F | Park Place Capital Corp | 1.834 | 0,00 | 55 | -1,82 | ||||
| 2025-10-21 | 13F | Simon Quick Advisors, Llc | 0 | -100,00 | 0 | -100,00 | ||||
| 2026-02-12 | 13F | North of South Capital LLP | 7.388.440 | 128,16 | 220.176 | 124,92 | ||||
| 2026-02-12 | 13F | Qtron Investments LLC | 0 | -100,00 | 0 | |||||
| 2025-09-29 | NP | AIM INVESTMENT FUNDS (INVESCO INVESTMENT FUNDS) - Invesco Oppenheimer Global Allocation Fund Class R | 28.055 | 0,00 | 945 | 0,43 | ||||
| 2025-09-22 | NP | GSEQX - Goldman Sachs Multi-Manager Global Equity Fund Class R6 Shares | 63.916 | -0,63 | 2.154 | -0,23 | ||||
| 2026-02-17 | 13F | Bamco Inc /ny/ | 0 | -100,00 | 0 | |||||
| 2026-02-17 | 13F | MIRAE ASSET GLOBAL ETFS HOLDINGS Ltd. | 349.848 | 11,55 | 10.425 | 9,97 | ||||
| 2026-01-29 | 13F | Sanctuary Advisors, LLC | 45.106 | -3,49 | 1.344 | -4,82 | ||||
| 2026-02-17 | 13F | Quantinno Capital Management LP | 311.544 | 52,56 | 9.284 | 50,40 | ||||
| 2026-02-17 | 13F | Harding Loevner Lp | 299.318 | 295,77 | 8.920 | 290,16 | ||||
| 2026-02-04 | 13F | LRI Investments, LLC | 125 | 0,00 | 4 | 0,00 | ||||
| 2026-02-12 | 13F | Quadrant Capital Group Llc | 25.072 | -2,38 | 747 | -3,74 | ||||
| 2026-02-17 | 13F | Two Sigma Advisers, Lp | 1.234.000 | 10.357,63 | 36.773 | 10.229,49 | ||||
| 2026-01-29 | 13F | Coronation Fund Managers Ltd. | 8.075 | 8,94 | 241 | 7,14 | ||||
| 2026-02-10 | 13F | FDx Advisors, Inc. | 0 | -100,00 | 0 | |||||
| 2026-02-02 | 13F | Core Alternative Capital | 400 | 0,00 | 12 | -8,33 | ||||
| 2025-09-26 | NP | AAEMX - Alger Emerging Markets Fund Class A | 17.541 | 0,00 | 591 | 0,51 | ||||
| 2026-01-27 | 13F | Asset Management One Co., Ltd. | 142.443 | 0,00 | 4.249 | -1,32 | ||||
| 2025-09-25 | NP | TWOEX - TCW White Oak Emerging Markets Equity Fund Class I | 3.620 | -41,23 | 122 | -41,26 | ||||
| 2026-02-12 | 13F | Integrated Quantitative Investments LLC | 0 | -100,00 | 0 | -100,00 | ||||
| 2026-02-12 | 13F | CIBC Private Wealth Group, LLC | 3.416 | -3,37 | 102 | -4,72 | ||||
| 2026-01-26 | 13F | Border to Coast Pensions Partnership Ltd | 780.177 | -10,28 | 23 | -11,54 | ||||
| 2025-09-26 | NP | AIM INTERNATIONAL MUTUAL FUNDS (INVESCO INTERNATIONAL MUTUAL FUNDS) - Invesco Oppenheimer Global Fund Class C | 5.015.935 | 0,00 | 169.037 | 0,42 | ||||
| 2026-02-10 | 13F | Connor, Clark & Lunn Investment Management Ltd. | 3.150.236 | 8,05 | 93.877 | 6,52 | ||||
| 2026-01-14 | 13F | TrueMark Investments, LLC | 29.760 | 887 | ||||||
| 2026-02-12 | 13F | Nuveen, LLC | 34.473 | -3,69 | 1.027 | -5,00 | ||||
| 2026-02-12 | 13F | Hrt Financial Lp | 399.154 | 83,40 | 12 | 83,33 | ||||
| 2026-02-09 | 13F | Endowment Wealth Management, Inc. | 0 | -100,00 | 0 | |||||
| 2026-01-27 | 13F | First Horizon Corp | 2.273 | 1,84 | 68 | 0,00 | ||||
| 2026-02-13 | 13F | Journey Strategic Wealth Llc | 8.601 | 256 | ||||||
| 2025-10-17 | 13F | Traveka Wealth, LLC | 0 | -100,00 | 0 | |||||
| 2026-02-17 | 13F | Ameriprise Financial Inc | 2.888.945 | -15,53 | 86.091 | -16,73 | ||||
| 2026-01-29 | 13F | Deltec Asset Management Llc | 35.500 | 0,00 | 1.058 | -1,49 | ||||
| 2026-02-12 | 13F | Earnest Partners Llc | 4.518.979 | 9,80 | 134.666 | 8,23 | ||||
| 2026-02-13 | 13F | Capula Management Ltd | 0 | -100,00 | 0 | |||||
| 2026-02-13 | 13F | Barclays Plc | 386.815 | 2,39 | 11.527 | 0,94 | ||||
| 2026-02-12 | 13F | Dsm Capital Partners Llc | 179.445 | -17,14 | 5.347 | -18,33 | ||||
| 2026-02-03 | 13F | Sumitomo Mitsui DS Asset Management Company, Ltd | 49.601 | 27,18 | 1.478 | 25,36 | ||||
| 2026-02-06 | 13F | Milestone Resources Group Ltd | 7.890.422 | 0,00 | 235 | -1,26 | ||||
| 2026-02-13 | 13F | Glen Eagle Advisors, LLC | 2.300 | 0,00 | 69 | -1,45 | ||||
| 2026-01-08 | 13F | Tompkins Financial Corp | 78 | -93,95 | 2 | -81,82 | ||||
| 2025-09-25 | NP | NEWFX - NEW WORLD FUND INC Class A | 2.993.607 | 0,00 | 100.885 | 0,42 | ||||
| 2026-01-16 | 13F | Empirical Financial Services, LLC d.b.a. Empirical Wealth Management | 18.102 | 44,54 | 539 | 42,59 | ||||
| 2026-02-12 | 13F | XY Capital Ltd | 36.193 | -54,36 | 1.079 | -55,03 | ||||
| 2026-01-16 | 13F | DiNuzzo Private Wealth, Inc. | 550 | 0,00 | 16 | -5,88 | ||||
| 2026-01-29 | 13F | Calamos Advisors LLC | 0 | -100,00 | 0 | |||||
| 2026-02-13 | 13F | Mariner, LLC | 94.021 | -0,19 | 2.804 | -1,55 | ||||
| 2026-02-02 | 13F | Your Advocates Ltd., LLP | 30 | 0,00 | 1 | |||||
| 2026-02-13 | 13F | Cloverfields Capital Group, Lp | 45.368 | 1,41 | 1.352 | -0,07 | ||||
| 2026-02-17 | 13F | LMR Partners LLP | 2.666.414 | 431,44 | 79.459 | 423,89 | ||||
| 2026-01-29 | 13F | Pictet Asset Management Holding SA | 2.798.548 | 0,80 | 83.397 | -0,63 | ||||
| 2026-02-17 | 13F | CWM Advisors, LLC | 2.606 | 78 | ||||||
| 2025-11-14 | 13F | Moors & Cabot, Inc. | 0 | -100,00 | 0 | -100,00 | ||||
| 2026-01-15 | 13F | Frank, Rimerman Advisors LLC | 86.915 | 0,00 | 2.590 | -1,41 | ||||
| 2025-09-25 | NP | CBLS - Clough Hedged Equity ETF | 32.933 | 4,17 | 1.110 | 4,62 | ||||
| 2026-02-17 | 13F | Royal Bank Of Canada | 1.325.420 | -83,42 | 39.499 | -83,65 | ||||
| 2026-02-17 | 13F | Graham Capital Management, L.P. | 35.129 | 1.047 | ||||||
| 2026-02-11 | 13F | Letko, Brosseau & Associates Inc | 427.852 | -2,26 | 12.750 | -3,66 | ||||
| 2026-02-11 | 13F | BI Asset Management Fondsmaeglerselskab A/S | 0 | -100,00 | 0 | |||||
| 2026-01-12 | 13F | E. Ohman J:or Asset Management AB | 1.156.108 | -1,95 | 34.452 | -3,34 | ||||
| 2026-02-12 | 13F | Brown Brothers Harriman & Co | 2.432 | 32,32 | 72 | 30,91 | ||||
| 2025-11-20 | 13F | First Affirmative Financial Network | 11.304 | 1,55 | 342 | -8,82 | ||||
| 2026-02-04 | 13F | Ameritas Advisory Services, LLC | 0 | -100,00 | 0 | |||||
| 2026-02-14 | 13F | Rockefeller Capital Management L.P. | 2.386.011 | -22,47 | 71.103 | -23,57 | ||||
| 2026-03-12 | 13F/A | Peak6 Llc | Put | 27.400 | -41,45 | 817 | -42,29 | |||
| 2026-03-12 | 13F/A | Peak6 Llc | Call | 55.000 | 547,06 | 1.639 | 540,23 | |||
| 2026-01-15 | 13F | Fortitude Family Office, LLC | 222 | 0,00 | 7 | 0,00 | ||||
| 2026-01-29 | 13F | Calamos Wealth Management LLC | 0 | -100,00 | 0 | |||||
| 2026-03-12 | 13F/A | Peak6 Llc | 11.544 | -11,32 | 344 | -12,47 | ||||
| 2026-01-28 | 13F | B. Metzler seel. Sohn & Co. AG | 54.869 | 5,05 | 1.635 | 3,61 | ||||
| 2026-02-12 | 13F | Alps Advisors Inc | 835.000 | 0,00 | 24.883 | -1,42 | ||||
| 2026-02-13 | 13F | SRS Capital Advisors, Inc. | 16.823 | 92,20 | 501 | 89,77 | ||||
| 2025-11-14 | 13F | Parallax Volatility Advisers, L.P. | Call | 0 | -100,00 | 0 | -100,00 | |||
| 2026-02-11 | 13F | Longfellow Investment Management Co Llc | 81.992 | -5,27 | 2.443 | -6,61 | ||||
| 2026-02-17 | 13F | Edmond De Rothschild Holding S.a. | 890.335 | 6,86 | 26.532 | 5,34 | ||||
| 2026-01-16 | 13F | Augustine Asset Management Inc | 370.452 | 0,02 | 11.039 | -1,40 | ||||
| 2026-02-06 | 13F | Carrhae Capital LLP | 1.992.766 | -50,21 | 59.384 | -50,92 | ||||
| 2026-02-09 | 13F | Geode Capital Management, Llc | 16.170 | -6,42 | 482 | -7,85 | ||||
| 2025-09-29 | NP | EELV - Invesco S&P Emerging Markets Low Volatility ETF This fund is a listed as child fund of Invesco Ltd. and if that institution has disclosed ownership in this security, then these positions will not be double counted when calculating total shares and total value | 52.479 | -6,20 | 1.769 | -5,81 | ||||
| 2026-02-17 | 13F | Principal Street Partners, LLC | 7.600 | -3,92 | 226 | -5,44 | ||||
| 2026-02-03 | 13F | Garner Asset Management Corp | 3.942 | 117 | ||||||
| 2026-02-10 | 13F | Goldman Sachs Group Inc | 9.638.869 | 52,09 | 287.238 | 49,92 | ||||
| 2026-02-10 | 13F | Goldman Sachs Group Inc | Call | 120.000 | 0,00 | 3.576 | -1,41 | |||
| 2026-02-17 | 13F | Amundi | 1.073.325 | -1,73 | 31.985 | -4,74 | ||||
| 2026-02-09 | 13F | Employees Retirement System of Texas | 139.859 | -47,61 | 4 | -50,00 | ||||
| 2026-02-17 | 13F | Tower Research Capital LLC (TRC) | 300 | -93,94 | 9 | -94,63 | ||||
| 2025-09-25 | NP | DFAX - Dimensional World ex U.S. Core Equity 2 ETF | 424.691 | 4,32 | 14.312 | 4,76 | ||||
| 2026-02-02 | 13F | Pittenger & Anderson Inc | 148.345 | -0,20 | 4.421 | -1,62 | ||||
| 2025-09-29 | NP | ASIAX - INVESCO Asia Pacific Growth Fund Class A | 160.554 | 5.411 | ||||||
| 2026-02-11 | 13F | J.w. Cole Advisors, Inc. | 52.076 | 21,21 | 326 | -74,88 | ||||
| 2026-01-20 | 13F | Sovran Advisors, LLC | 13.598 | 93,07 | 419 | 93,98 | ||||
| 2026-02-23 | 13F | Beaird Harris Wealth Management, LLC | 0 | -100,00 | 0 | |||||
| 2026-03-06 | 13F | Hsbc Holdings Plc | 3.607.553 | -45,78 | 111.214 | -45,61 | ||||
| 2026-01-15 | 13F | J. Safra Sarasin Holding AG | 0 | -100,00 | 0 | |||||
| 2026-02-09 | 13F | Choate Investment Advisors | 7.717 | 0,00 | 230 | -1,72 | ||||
| 2025-11-14 | 13F | Axa S.a. | 0 | -100,00 | 0 | |||||
| 2025-09-26 | NP | CHUSX - Alger Global Focus Fund Class A | 12.174 | 0,00 | 410 | 0,49 | ||||
| 2025-09-26 | NP | FSUMX - Fidelity Series Sustainable U.S. Market Fund | 925 | 14,91 | 31 | 14,81 | ||||
| 2026-02-17 | 13F | Herold Advisors, Inc. | 28.950 | 0,00 | 863 | -1,49 | ||||
| 2026-02-09 | 13F | Main Street Research LLC | 1.022.131 | -2,83 | 30.460 | -4,21 | ||||
| 2026-02-10 | 13F | Bruce G. Allen Investments, LLC | 1.466 | -6,27 | 44 | -8,51 | ||||
| 2025-11-04 | 13F | Veritas Asset Management LLP | 0 | -100,00 | 0 | -100,00 | ||||
| 2025-11-05 | 13F | First National Bank of Hutchinson | 0 | -100,00 | 0 | |||||
| 2025-10-31 | 13F | Whittier Trust Co | 0 | -100,00 | 0 | -100,00 | ||||
| 2025-09-26 | NP | MTRA - Invesco International Growth Focus ETF | 3.103 | 105 | ||||||
| 2026-02-03 | 13F | Ethic Inc. | 281.291 | 1,77 | 8.382 | 0,32 | ||||
| 2026-02-11 | 13F | Capital International Sarl | 403.334 | -17,87 | 12.019 | -19,04 | ||||
| 2026-02-10 | 13F | Bank of New York Mellon Corp | 575.611 | -36,98 | 17.153 | -37,88 | ||||
| 2026-01-12 | 13F | Seacrest Wealth Management, Llc | 11.832 | -0,52 | 371 | 1,64 | ||||
| 2026-01-26 | 13F | Merit Financial Group, LLC | 22.303 | -5,13 | 665 | -6,48 | ||||
| 2026-01-26 | 13F | Asset Dedication, LLC | 1.092 | 0,00 | 33 | -3,03 | ||||
| 2026-02-13 | 13F | Atlas Capital Advisors Llc | 1.319 | -13,22 | 39 | -23,53 | ||||
| 2025-11-10 | 13F | Cary Street Partners Financial Llc | 0 | -100,00 | 0 | |||||
| 2026-01-29 | 13F | Sava Infond d.o.o. | 61.700 | 0,00 | 1.839 | -1,45 | ||||
| 2026-02-03 | 13F | Crestwood Advisors Group LLC | 10.092 | 301 | ||||||
| 2026-02-12 | 13F | Brinker Capital Investments, LLC | 145.491 | 2,93 | 4.336 | 1,47 | ||||
| 2026-01-21 | 13F | Seed Wealth Management, Inc. | 21.034 | 0,00 | 627 | -1,42 | ||||
| 2026-02-13 | 13F | Gts Securities Llc | 102.623 | 43,17 | 3.058 | 41,18 | ||||
| 2025-09-25 | NP | Clough Global Opportunities Fund | 192.800 | 0,00 | 6.497 | 0,42 | ||||
| 2026-02-17 | 13F | SageView Advisory Group, LLC | 758 | 23 | ||||||
| 2026-01-23 | 13F | Farther Finance Advisors, LLC | 8.705 | 17,29 | 259 | 15,63 | ||||
| 2026-01-08 | 13F | Wealth Enhancement Advisory Services, Llc | 53.510 | 0,50 | 1.652 | 0,00 | ||||
| 2026-01-30 | 13F | Bogart Wealth, LLC | 11 | -90,35 | 0 | -100,00 | ||||
| 2026-02-11 | 13F | Syon Capital Llc | 9.433 | 281 | ||||||
| 2026-01-14 | 13F | ORG Wealth Partners, LLC | 717 | 0,00 | 21 | 0,00 | ||||
| 2026-02-10 | 13F | Jupiter Asset Management Ltd | 73.045 | -65,54 | 2.177 | -66,04 | ||||
| 2026-02-09 | 13F | Hantz Financial Services, Inc. | 67.544 | 12,01 | 2 | 100,00 | ||||
| 2025-09-26 | NP | FSBDX - Fidelity Series Blue Chip Growth Fund This fund is a listed as child fund of Fmr Llc and if that institution has disclosed ownership in this security, then these positions will not be double counted when calculating total shares and total value | 186.100 | 13,06 | 6.272 | 13,54 | ||||
| 2026-01-26 | 13F | Clean Yield Group | 244 | 0,00 | 7 | 0,00 | ||||
| 2026-01-29 | 13F | Verdence Capital Advisors LLC | 20.498 | -1,69 | 611 | -6,01 | ||||
| 2026-02-17 | 13F | Opal Capital Llc | 29.760 | 887 | ||||||
| 2025-09-25 | NP | RPGAX - T. Rowe Price Global Allocation Fund, Inc. This fund is a listed as child fund of Price T Rowe Associates Inc /md/ and if that institution has disclosed ownership in this security, then these positions will not be double counted when calculating total shares and total value | 2.562 | 0,00 | 86 | 1,18 | ||||
| 2026-02-12 | 13F | Renaissance Technologies Llc | 0 | -100,00 | 0 | |||||
| 2026-02-12 | 13F | Custom Index Systems, Llc | 14.015 | 0,00 | 418 | -1,42 | ||||
| 2026-01-05 | 13F | Park Avenue Securities Llc | 55.434 | -4,88 | 2 | 0,00 | ||||
| 2026-02-04 | 13F | Wsfs Capital Management, Llc | 10.085 | 6,71 | 301 | 5,26 | ||||
| 2025-10-30 | 13F | Twin Peaks Wealth Advisors, LLC | 0 | -100,00 | 0 | |||||
| 2026-02-18 | 13F | SkyView Investment Advisors, LLC | 21.746 | -0,79 | 1 | |||||
| 2025-11-12 | 13F | Victory Capital Management Inc | 0 | -100,00 | 0 | |||||
| 2026-02-06 | 13F | Abn Amro Investment Solutions | 64.084 | -30,63 | 1.910 | -31,63 | ||||
| 2026-02-13 | 13F | Ieq Capital, Llc | 86.582 | -1,11 | 2.580 | -2,49 | ||||
| 2026-02-03 | 13F | We Are One Seven, LLC | 7.493 | 223 | ||||||
| 2026-02-17 | 13F | Mercer Global Advisors Inc /adv | 26.139 | 3,30 | 779 | 1,83 | ||||
| 2025-11-13 | 13F | Riggs Asset Managment Co. Inc. | 0 | -100,00 | 0 | |||||
| 2026-02-06 | 13F | Alan B. Lancz & Associates, Inc. | 17.655 | 0,00 | 526 | -1,31 | ||||
| 2025-10-30 | 13F | Jennison Associates Llc | 0 | -100,00 | 0 | |||||
| 2026-01-15 | 13F | BTC Capital Management, Inc. | 0 | -100,00 | 0 | |||||
| 2026-01-29 | 13F | Quest 10 Wealth Builders, Inc. | 0 | -100,00 | 0 | |||||
| 2025-09-25 | NP | DFA INVESTMENT DIMENSIONS GROUP INC - Emerging Markets Sustainability Core 1 Portfolio Institutional Class This fund is a listed as child fund of Dimensional Fund Advisors Lp and if that institution has disclosed ownership in this security, then these positions will not be double counted when calculating total shares and total value | 185.870 | 0,00 | 6.264 | 0,42 | ||||
| 2025-09-25 | NP | ROAM - Hartford Multifactor Emerging Markets ETF | 3.485 | 27,33 | 117 | 36,05 | ||||
| 2025-10-28 | 13F | Richardson Financial Services Inc. | 0 | -100,00 | 0 | |||||
| 2026-02-12 | 13F | Cloud Capital Management, LLC | 0 | -100,00 | 0 | |||||
| 2026-02-13 | 13F | Morgan Stanley | 53.772.858 | 7,98 | 1.602.431 | 6,45 | ||||
| 2026-02-06 | 13F | Larson Financial Group LLC | 831 | 855,17 | 25 | 1.100,00 | ||||
| 2025-11-14 | 13F | Oxbow Capital Management (HK) Ltd | 0 | -100,00 | 0 | |||||
| 2026-02-17 | 13F | Aquatic Capital Management LLC | 246.527 | 7.347 | ||||||
| 2026-02-12 | 13F | Wealthspire Advisors, LLC | 0 | -100,00 | 0 | |||||
| 2025-10-21 | 13F | Gateway Investment Advisers Llc | 0 | -100,00 | 0 | -100,00 | ||||
| 2026-02-12 | 13F | Groupe la Francaise | 93.256 | 0,00 | 2.777 | -1,56 | ||||
| 2026-02-02 | 13F | Highland Capital Management, Llc | 28.900 | -14,87 | 861 | -16,08 | ||||
| 2026-02-12 | 13F | Scotia Capital Inc. | 375.208 | -24,54 | 11.181 | -25,61 | ||||
| 2026-02-10 | 13F | Acadian Asset Management Llc | 1.942.530 | -19,85 | 58 | -21,92 | ||||
| 2026-02-12 | 13F | DRW Securities, LLC | 139.436 | 1.998,99 | 4.155 | 1.967,16 | ||||
| 2026-02-13 | 13F | Verition Fund Management LLC | 74.877 | 49,27 | 2.231 | 47,16 | ||||
| 2026-02-05 | 13F | Mesirow Financial Investment Management, Inc. | 0 | -100,00 | 0 | |||||
| 2026-02-12 | 13F | Principal Securities, Inc. | 8.911 | -15,97 | 266 | -17,19 | ||||
| 2026-02-06 | 13F | Entrust Financial Llc | 1.657 | 49 | ||||||
| 2026-02-13 | 13F | Verition Fund Management LLC | Put | 28.800 | -58,02 | 858 | -58,61 | |||
| 2026-02-17 | 13F | Aureus Asset Management, LLC | 15.940 | -0,31 | 475 | -1,66 | ||||
| 2026-01-27 | 13F | Brighton Jones Llc | 0 | -100,00 | 0 | |||||
| 2026-02-13 | 13F | Golden State Wealth Management, LLC | 22 | 0,00 | 1 | |||||
| 2026-02-11 | 13F | Simplex Trading, Llc | 5.625 | -5,35 | 168 | |||||
| 2026-01-21 | 13F | Stone House Investment Management, LLC | 12 | 0 | ||||||
| 2026-02-11 | 13F | Simplex Trading, Llc | Call | 89.600 | -46,41 | 2.670 | 53.300,00 | |||
| 2026-02-11 | 13F | Simplex Trading, Llc | Put | 9.500 | -15,93 | 283 | ||||
| 2025-09-24 | NP | DAEMX - Dunham Emerging Markets Stock Fund Class A | 30.087 | 40,59 | 1.014 | 41,09 | ||||
| 2026-02-03 | 13F | Connable Office Inc | 30.042 | 0,00 | 895 | -1,43 | ||||
| 2026-01-21 | 13F | Ameliora Wealth Management Ltd. | 2.750 | 0,00 | 82 | -2,41 | ||||
| 2026-02-11 | 13F | SmartHarvest Portfolios, LLC | 10.109 | 301 | ||||||
| 2026-02-09 | 13F | Accent Capital Management, LLC | 886 | 0,00 | 26 | 0,00 | ||||
| 2026-02-17 | 13F | Holocene Advisors, LP | 846.579 | 25.228 | ||||||
| 2026-01-20 | 13F | Nvwm, Llc | 14.142 | -47,27 | 421 | -48,02 | ||||
| 2026-01-29 | 13F | UBS Group AG | Put | 282.200 | 0,00 | 8.410 | -1,42 | |||
| 2026-01-28 | 13F | HB Wealth Management, LLC | 12.716 | 11,11 | 379 | 9,57 | ||||
| 2026-01-29 | 13F | UBS Group AG | Call | 49.900 | 0,00 | 1.487 | -1,39 | |||
| 2025-11-14 | 13F | Millennium Management Llc | Call | 0 | -100,00 | 0 | -100,00 | |||
| 2026-01-05 | 13F | Confluence Investment Management Llc | 10.601 | 0,00 | 316 | -1,56 | ||||
| 2026-01-29 | 13F | UBS Group AG | 3.953.404 | 25,75 | 117.811 | 23,97 | ||||
| 2026-02-13 | 13F | Vontobel Holding Ltd. | 2.692.556 | -39,54 | 80.238 | -40,40 | ||||
| 2026-02-09 | 13F | Keating Financial Advisory Services, Inc. | 108 | 3 | ||||||
| 2026-02-12 | 13F | Systematic Alpha Investments, LLC | 11.300 | 0,00 | 337 | -1,47 | ||||
| 2026-02-13 | 13F | Segall Bryant & Hamill, Llc | 17.600 | 0,00 | 524 | -1,50 | ||||
| 2026-02-17 | 13F | GeoWealth Management, LLC | 17.205 | 24,13 | 513 | 22,49 | ||||
| 2026-02-13 | 13F | Baldwin Investment Management, LLC | 67.438 | 0,00 | 2.010 | -1,42 | ||||
| 2026-02-12 | 13F | Rossby Financial, LCC | 63 | 0,00 | 2 | 0,00 | ||||
| 2026-02-23 | 13F | Monetary Solutions, Ltd | 100 | 3 | ||||||
| 2026-01-07 | 13F | Riversedge Advisors, Llc | 6.993 | -4,38 | 208 | -5,88 | ||||
| 2026-02-17 | 13F | Point72 Asset Management, L.P. | 1.467.733 | 1.806,15 | 43.738 | 1.779,59 | ||||
| 2025-09-26 | NP | EMES - Harbor Emerging Markets Select ETF | 8.313 | 280 | ||||||
| 2026-02-17 | 13F | Triveni Capital Investments LP | 405.413 | 12.081 | ||||||
| 2026-02-12 | 13F | Advisory Resource Group | 42.012 | 9,79 | 1.252 | 8,22 | ||||
| 2025-09-25 | NP | DFAE - Dimensional Emerging Core Equity Market ETF | 1.332.937 | 4,15 | 44.920 | 4,58 | ||||
| 2026-02-13 | 13F | Sompo Japan Nipponkoa Asset Management Co.,ltd. | 23.000 | -29,64 | 685 | -30,67 | ||||
| 2026-02-10 | 13F | Envestnet Asset Management Inc | 2.784.785 | -7,03 | 82.987 | -8,35 | ||||
| 2026-02-17 | 13F | Cdkv Holdings Llc | 1.100 | 33 | ||||||
| 2026-02-12 | 13F | New York State Common Retirement Fund | 1.334.585 | 28,28 | 39.771 | 26,45 | ||||
| 2026-01-26 | 13F | La Banque Postale Asset Management SA | 71.500 | 35,67 | 2.131 | 33,71 | ||||
| 2026-02-10 | 13F | Continuum Advisory, LLC | 68.474 | -2,75 | 2.041 | -4,14 | ||||
| 2026-01-30 | 13F | Mitsubishi UFJ Trust & Banking Corp | 46.966 | 6,03 | 1.400 | 4,48 | ||||
| 2026-02-18 | 13F | Vident Advisory, LLC | 219.902 | -1,97 | 6.553 | -3,36 | ||||
| 2026-02-05 | 13F | Cambridge Investment Research Advisors, Inc. | 9.240 | 7,62 | 0 | |||||
| 2025-09-25 | NP | JADE - JPMorgan Active Developing Markets Equity ETF | 2.239 | -17,07 | 75 | -16,67 | ||||
| 2026-01-29 | 13F | RMR Wealth Builders | 15.362 | 0,00 | 458 | -1,51 | ||||
| 2026-02-10 | 13F | Private Wealth Asset Management, LLC | 0 | -100,00 | 0 | |||||
| 2026-02-10 | 13F | Greenspring Advisors, LLC | 12.809 | 382 | ||||||
| 2026-02-13 | 13F | BNP Paribas Asset Management Holding S.A. | 735.814 | 22 | ||||||
| 2026-02-04 | 13F | Atlantic Union Bankshares Corp | 150 | 20,00 | 4 | 33,33 | ||||
| 2026-02-17 | 13F | United Capital Financial Advisers, Llc | 15.847 | -4,93 | 472 | -6,16 | ||||
| 2026-01-16 | 13F | CogentBlue Wealth Advisors, LLC | 20.547 | -0,68 | 612 | -2,08 | ||||
| 2025-11-13 | 13F | Glenmede Investment Management, LP | 73.709 | 20,85 | 2.228 | 8,63 | ||||
| 2026-01-29 | 13F | Golden State Equity Partners | 7.956 | 3,95 | 237 | 2,60 | ||||
| 2025-09-26 | NP | SUNAMERICA SERIES TRUST - SA JPMorgan Emerging Markets Portfolio Class 1 | 117.386 | -9,38 | 3.956 | -9,02 | ||||
| 2026-02-17 | 13F | Jones Financial Companies Lllp | 5.950 | 15,24 | 177 | 12,74 | ||||
| 2025-09-25 | NP | Clough Global Dividend & Income Fund | 46.900 | 0,00 | 1.581 | 0,45 | ||||
| 2026-02-06 | 13F | Motco | 0 | -100,00 | 0 | -100,00 | ||||
| 2026-02-13 | 13F | Arrowstreet Capital, Limited Partnership | 4.020.415 | 4,36 | 119.808 | 2,88 | ||||
| 2026-02-10 | 13F | Measured Wealth Private Client Group, LLC | 238 | 0,00 | 7 | 0,00 | ||||
| 2026-02-02 | 13F | Horizon Investments, LLC | 0 | -100,00 | 0 | |||||
| 2025-09-25 | NP | VMNVX - Vanguard Global Minimum Volatility Fund Admiral Shares | 969.471 | 3,25 | 32.671 | 3,69 | ||||
| 2026-01-16 | 13F | Pictet & Cie (Europe) SA | 47.297 | 17,28 | 1.409 | 15,59 | ||||
| 2026-01-23 | 13F | Gibbs Wealth Management | 0 | -100,00 | 0 | |||||
| 2026-01-28 | 13F | CAPROCK Group, Inc. | 62.559 | -1,73 | 1.864 | -8,45 | ||||
| 2026-02-17 | 13F | Brevan Howard Capital Management LP | 0 | -100,00 | 0 | |||||
| 2026-01-09 | 13F | Diversified Trust Co | 41.898 | 80,56 | 1.249 | 78,03 | ||||
| 2026-01-21 | 13F | Greenleaf Trust | 40.300 | 8,89 | 1.201 | 7,33 | ||||
| 2026-02-10 | 13F | Sivia Capital Partners, LLC | 15.059 | -1,53 | 449 | -3,03 | ||||
| 2025-09-25 | NP | DEXC - Dimensional Emerging Markets ex China Core Equity ETF | 70.595 | 16,90 | 2.379 | 17,42 | ||||
| 2026-02-13 | 13F/A | Alberta Investment Management Corp | 0 | -100,00 | 0 | |||||
| 2025-11-14 | 13F | Atom Investors LP | 0 | -100,00 | 0 | |||||
| 2025-11-14 | 13F | Wolverine Trading, Llc | Put | 0 | -100,00 | 0 | -100,00 | |||
| 2026-02-12 | 13F | Canopy Partners, LLC | 0 | -100,00 | 0 | |||||
| 2026-02-13 | 13F | Caitong International Asset Management Co., Ltd | 2.529 | 5.781,40 | 75 | 7.400,00 | ||||
| 2026-02-10 | 13F | Root Financial Partners, LLC | 92 | 187,50 | 3 | |||||
| 2025-11-03 | 13F | Annis Gardner Whiting Capital Advisors, LLC | 0 | -100,00 | 0 | |||||
| 2026-01-23 | 13F | Helios Capital Management Pte. Ltd | 285.000 | 0,00 | 8.493 | -1,42 | ||||
| 2026-02-10 | 13F/A | Northwestern Mutual Wealth Management Co | 1.853 | -17,94 | 55 | -19,12 | ||||
| 2026-02-12 | 13F | Sepio Capital, LP | 0 | -100,00 | 0 | |||||
| 2026-02-02 | 13F | Qrg Capital Management, Inc. | 30.343 | -4,62 | 904 | -5,93 | ||||
| 2026-01-28 | 13F | Kingswood Wealth Advisors, Llc | 6.740 | 201 | ||||||
| 2026-02-17 | 13F | DZ BANK AG Deutsche Zentral Genossenschafts Bank, Frankfurt am Main | 0 | -100,00 | 0 | |||||
| 2026-02-13 | 13F | Arkadios Wealth Advisors | 6.815 | 2,40 | 203 | 1,00 | ||||
| 2026-02-17 | 13F | Nomura Holdings Inc | 10.000 | -66,67 | 298 | -67,11 | ||||
| 2026-02-11 | 13F | Capital World Investors | 148.618 | 1,68 | 4.436 | 0,14 | ||||
| 2026-01-20 | 13F | Ascent Group, LLC | 19.122 | -1,28 | 570 | -2,74 | ||||
| 2026-02-05 | 13F | Abacus Wealth Partners, LLC | 13.295 | 396 | ||||||
| 2026-02-17 | 13F | Artisan Partners Limited Partnership | 123.932 | 5,99 | 3.693 | 4,50 | ||||
| 2026-01-27 | 13F | Jackson, Grant Investment Advisers, Inc. | 125 | 0,00 | 4 | 0,00 | ||||
| 2026-01-29 | 13F | Resonant Capital Advisors, LLC | 6.812 | -1,43 | 203 | -2,88 | ||||
| 2026-02-11 | 13F | Prestige Wealth Management Group LLC | 80 | -6,98 | 2 | 0,00 | ||||
| 2026-02-03 | 13F | NewEdge Wealth, LLC | 10.234 | 305 | ||||||
| 2025-09-29 | NP | CIGRX - Calamos International Growth Fund Class A | 75.700 | 11,16 | 2.551 | 11,64 | ||||
| 2026-01-23 | 13F | Ritholtz Wealth Management | 48.395 | -5,12 | 1.442 | -6,42 | ||||
| 2026-01-28 | 13F | Klp Kapitalforvaltning As | 190.000 | 76,42 | 5.662 | 73,95 | ||||
| 2026-02-10 | 13F | Nomura Asset Management Co Ltd | 1.467.150 | -3,91 | 43.721 | -5,27 | ||||
| 2026-02-17 | 13F | Clough Capital Partners L P | 0 | -100,00 | 0 | |||||
| 2026-02-03 | 13F | Sequoia Financial Advisors, LLC | 79.042 | -2,96 | 2.355 | -4,35 |