Grundlæggende statistik
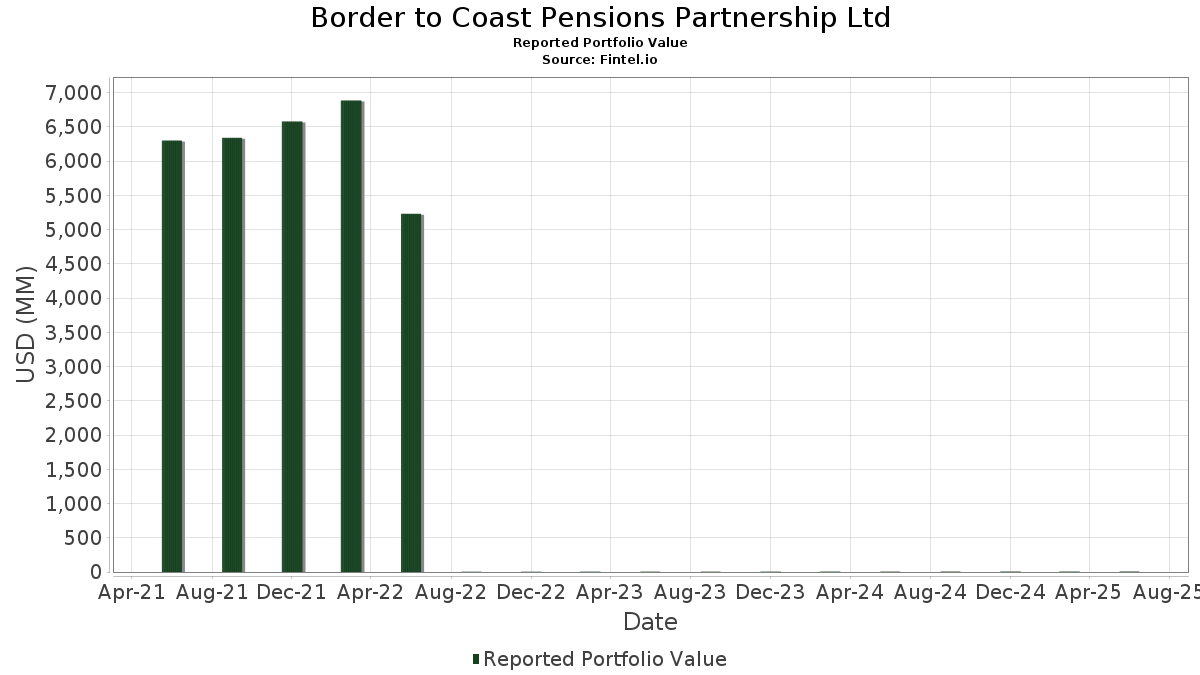
| Porteføljeværdi | $ 5.446.992 |
| Nuværende stillinger | 82 |
Seneste beholdninger, ydeevne, AUM (fra 13F, 13D)
Border to Coast Pensions Partnership Ltd har afsløret 82 samlede besiddelser i deres seneste SEC-arkivering. Den seneste porteføljeværdi er beregnet til at være $ 5.446.992 USD. Faktiske aktiver under forvaltning (AUM) er denne værdi plus kontanter (som ikke er oplyst). Border to Coast Pensions Partnership Ltds største beholdninger er Microsoft Corporation (US:MSFT) , Direxion Shares ETF Trust - Direxion Daily NVDA Bear 1X Shares (US:NVDD) , Vanguard Index Funds - Vanguard Mid-Cap ETF (US:VO) , Amazon.com, Inc. (US:AMZN) , and Apple Inc. (US:AAPL) . Border to Coast Pensions Partnership Ltds nye stillinger omfatter Coca-Cola Europacific Partners PLC (MX:CCEP N) , Zoetis Inc. (US:ZTS) , .
Top øger dette kvartal
Vi bruger ændringen i porteføljeallokeringen, fordi dette er den mest meningsfulde metrik. Ændringer kan skyldes handler eller ændringer i aktiekurser.
| Sikkerhed | Aktier (MM) |
Værdi (MM$) |
Portefølje % | ΔPortefølje % |
|---|---|---|---|---|
| 2,51 | 0,40 | 7,2690 | 1,8917 | |
| 0,82 | 0,41 | 7,5317 | 1,2676 | |
| 0,62 | 0,17 | 3,1517 | 0,9243 | |
| 0,45 | 0,04 | 0,7657 | 0,7657 | |
| 0,49 | 0,11 | 1,9721 | 0,6501 | |
| 0,22 | 0,03 | 0,6177 | 0,6177 | |
| 0,20 | 0,02 | 0,4288 | 0,4288 | |
| 1,14 | 0,25 | 4,5767 | 0,3971 | |
| 0,07 | 0,09 | 1,6078 | 0,3585 | |
| 0,16 | 0,12 | 2,2346 | 0,2875 |
Top falder i dette kvartal
Vi bruger ændringen i porteføljeallokeringen, fordi dette er den mest meningsfulde metrik. Ændringer kan skyldes handler eller ændringer i aktiekurser.
| Sikkerhed | Aktier (MM) |
Værdi (MM$) |
Portefølje % | ΔPortefølje % |
|---|---|---|---|---|
| 1,16 | 0,24 | 4,3747 | -1,0962 | |
| 0,03 | 0,01 | 0,1958 | -0,5814 | |
| 0,20 | 0,07 | 1,2744 | -0,5054 | |
| 0,18 | 0,06 | 1,0398 | -0,4798 | |
| 0,23 | 0,11 | 2,0632 | -0,4608 | |
| 0,13 | 0,04 | 0,7213 | -0,2986 | |
| 0,10 | 0,08 | 1,4660 | -0,2671 | |
| 0,32 | 0,05 | 0,8416 | -0,2555 | |
| 0,40 | 0,06 | 1,1845 | -0,2293 | |
| 0,34 | 0,03 | 0,5666 | -0,2179 |
13F og Fondsarkivering
Denne formular blev indsendt den 2025-07-14 for rapporteringsperioden 2025-06-30. Klik på linkikonet for at se den fulde transaktionshistorik.
Opgrader for at låse op for premium-data og eksportere til Excel ![]() .
.
| Sikkerhed | Type | Gennemsnitlig aktiekurs | Aktier (MM) |
Δ Aktier (%) |
Δ Aktier (%) |
Værdi ($MM) |
Portefølje (%) |
ΔPortefølje (%) |
|
|---|---|---|---|---|---|---|---|---|---|
| MSFT / Microsoft Corporation | 0,82 | 1,25 | 0,41 | 34,43 | 7,5317 | 1,2676 | |||
| NVDD / Direxion Shares ETF Trust - Direxion Daily NVDA Bear 1X Shares | 2,51 | 3,47 | 0,40 | 50,76 | 7,2690 | 1,8917 | |||
| VO / Vanguard Index Funds - Vanguard Mid-Cap ETF | 1,21 | 0,00 | 0,34 | 8,33 | 6,2169 | -0,1942 | |||
| AMZN / Amazon.com, Inc. | 1,14 | 5,96 | 0,25 | 22,06 | 4,5767 | 0,3971 | |||
| AAPL / Apple Inc. | 1,16 | -3,40 | 0,24 | -10,86 | 4,3747 | -1,0962 | |||
| GOOGL / Alphabet Inc. | 1,14 | -2,16 | 0,20 | 11,67 | 3,7014 | -0,0027 | |||
| 0YXG / Broadcom Inc. | 0,62 | -4,10 | 0,17 | 58,33 | 3,1517 | 0,9243 | |||
| META / Meta Platforms, Inc. | 0,16 | 0,00 | 0,12 | 27,37 | 2,2346 | 0,2875 | |||
| JPM / JPMorgan Chase & Co. | 0,40 | 6,64 | 0,12 | 26,37 | 2,1220 | 0,2434 | |||
| BRK.A / Berkshire Hathaway Inc. | 0,23 | 0,00 | 0,11 | -8,94 | 2,0632 | -0,4608 | |||
| ORCL / Oracle Corporation | 0,49 | 6,44 | 0,11 | 67,19 | 1,9721 | 0,6501 | |||
| 001413346 / Netflix, Inc. | 0,07 | 0,00 | 0,09 | 45,00 | 1,6078 | 0,3585 | |||
| NEE / NextEra Energy, Inc. | 1,24 | 2,06 | 0,09 | 0,00 | 1,5813 | -0,1842 | |||
| WMT / Walmart Inc. | 0,87 | -5,58 | 0,09 | 4,94 | 1,5651 | -0,0955 | |||
| AMT / American Tower Corporation | 0,38 | 2,01 | 0,09 | 3,66 | 1,5612 | -0,1200 | |||
| HD / The Home Depot, Inc. | 0,22 | 5,62 | 0,08 | 5,19 | 1,4968 | -0,0838 | |||
| LLY / Eli Lilly and Company | 0,10 | 0,00 | 0,08 | -5,95 | 1,4660 | -0,2671 | |||
| UBSG / UBS Group AG | 2,31 | 10,38 | 0,08 | 22,22 | 1,4286 | 0,1284 | |||
| M4ID / Mastercard Incorporated | 0,13 | 0,00 | 0,07 | 2,82 | 1,3447 | -0,1188 | |||
| UNP / Union Pacific Corporation | 0,31 | 10,82 | 0,07 | 7,69 | 1,2979 | -0,0439 | |||
| V / Visa Inc. | 0,20 | -21,14 | 0,07 | -19,77 | 1,2744 | -0,5054 | |||
| BAC / Bank of America Corporation | 1,40 | 15,59 | 0,07 | 32,00 | 1,2141 | 0,1805 | |||
| GJR / Strats Trust For Procter & Gambel Security - Preferred Security | 0,40 | 0,00 | 0,06 | -7,25 | 1,1845 | -0,2293 | |||
| DE / Deere & Company | 0,13 | 21,30 | 0,06 | 31,25 | 1,1721 | 0,1769 | |||
| DIS / The Walt Disney Company | 0,50 | 13,64 | 0,06 | 44,19 | 1,1451 | 0,2502 | |||
| KKR / KKR & Co. Inc. | 0,46 | -1,08 | 0,06 | 15,09 | 1,1234 | 0,0222 | |||
| ACN / Accenture plc | 0,20 | 27,71 | 0,06 | 22,45 | 1,1052 | 0,0971 | |||
| CSCO / Cisco Systems, Inc. | 0,85 | 18,58 | 0,06 | 34,09 | 1,0856 | 0,1770 | |||
| AXP / American Express Company | 0,18 | 0,00 | 0,06 | 18,75 | 1,0644 | 0,0626 | |||
| TMO / Thermo Fisher Scientific Inc. | 0,14 | 50,28 | 0,06 | 23,91 | 1,0506 | 0,0933 | |||
| UNH / UnitedHealth Group Incorporated | 0,18 | 28,18 | 0,06 | -24,32 | 1,0398 | -0,4798 | |||
| KO / The Coca-Cola Company | 0,79 | 0,00 | 0,06 | -1,79 | 1,0235 | -0,1326 | |||
| ABT / Abbott Laboratories | 0,40 | 0,00 | 0,05 | 1,89 | 1,0078 | -0,0889 | |||
| RTX / RTX Corporation | 0,37 | 10,10 | 0,05 | 22,73 | 1,0023 | 0,0808 | |||
| TXN / Texas Instruments Incorporated | 0,24 | 22,59 | 0,05 | 42,86 | 0,9211 | 0,1955 | |||
| WELL / Welltower Inc. | 0,33 | -7,14 | 0,05 | -7,55 | 0,9172 | -0,1812 | |||
| EQIX / Equinix, Inc. | 0,06 | -7,41 | 0,05 | -10,91 | 0,9127 | -0,2147 | |||
| IRM / Iron Mountain Incorporated | 0,48 | 0,00 | 0,05 | 19,51 | 0,9039 | 0,0579 | |||
| EBGEF / Enbridge Inc. - Preferred Stock | 1,07 | 2,38 | 0,05 | 4,35 | 0,8931 | -0,0587 | |||
| SHW / The Sherwin-Williams Company | 0,14 | 0,00 | 0,05 | 0,00 | 0,8639 | -0,1164 | |||
| TJX / The TJX Companies, Inc. | 0,38 | 0,00 | 0,05 | 2,17 | 0,8632 | -0,0868 | |||
| MAR / Marriott International, Inc. | 0,17 | 12,21 | 0,05 | 27,78 | 0,8589 | 0,1142 | |||
| CVX / Chevron Corporation | 0,32 | 0,00 | 0,05 | -15,09 | 0,8416 | -0,2555 | |||
| ADP / Automatic Data Processing, Inc. | 0,14 | 0,00 | 0,04 | 0,00 | 0,8074 | -0,0851 | |||
| MLM / Martin Marietta Materials, Inc. | 0,08 | 12,36 | 0,04 | 31,25 | 0,7747 | 0,1046 | |||
| WAB / Westinghouse Air Brake Technologies Corporation | 0,20 | 0,00 | 0,04 | 16,67 | 0,7726 | 0,0258 | |||
| ARCC / Ares Capital Corporation | 1,90 | 2,70 | 0,04 | 2,50 | 0,7660 | -0,0738 | |||
| CCEP N / Coca-Cola Europacific Partners PLC | 0,45 | 0,04 | 0,7657 | 0,7657 | |||||
| MCD / McDonald's Corporation | 0,13 | -15,63 | 0,04 | -20,41 | 0,7213 | -0,2986 | |||
| 0XHL / Aon plc | 0,10 | 4,63 | 0,04 | -7,69 | 0,6717 | -0,1296 | |||
| CNM / Core & Main, Inc. | 0,60 | 8,19 | 0,04 | 38,46 | 0,6693 | 0,1167 | |||
| ZTS / Zoetis Inc. | 0,22 | 0,03 | 0,6177 | 0,6177 | |||||
| FLUT / Flutter Entertainment plc | 0,11 | -3,57 | 0,03 | 24,00 | 0,5866 | 0,0616 | |||
| VLTO / Veralto Corporation | 0,31 | 0,00 | 0,03 | 3,33 | 0,5823 | -0,0449 | |||
| RSG / Republic Services, Inc. | 0,13 | -11,20 | 0,03 | -8,82 | 0,5733 | -0,1341 | |||
| ZBH / Zimmer Biomet Holdings, Inc. | 0,34 | 0,00 | 0,03 | -21,05 | 0,5666 | -0,2179 | |||
| DHR / Danaher Corporation | 0,16 | 0,00 | 0,03 | -3,23 | 0,5654 | -0,0893 | |||
| JAAA / Janus Detroit Street Trust - Janus Henderson AAA CLO ETF | 0,60 | 0,00 | 0,03 | 0,00 | 0,5590 | -0,0643 | |||
| COP / ConocoPhillips | 0,34 | 0,00 | 0,03 | -14,29 | 0,5543 | -0,1695 | |||
| IBN / ICICI Bank Limited - Depositary Receipt (Common Stock) | 0,87 | 9,92 | 0,03 | 20,83 | 0,5370 | 0,0262 | |||
| TSLA / Tesla, Inc. | 0,09 | 0,00 | 0,03 | 27,27 | 0,5158 | 0,0463 | |||
| COST / Costco Wholesale Corporation | 0,03 | 0,00 | 0,03 | 4,00 | 0,4911 | -0,0324 | |||
| ELV / Elevance Health, Inc. | 0,07 | 0,00 | 0,03 | -10,34 | 0,4864 | -0,1205 | |||
| PNC / The PNC Financial Services Group, Inc. | 0,14 | 0,00 | 0,03 | 4,17 | 0,4680 | -0,0244 | |||
| APO / Apollo Global Management, Inc. | 0,17 | 6,25 | 0,02 | 14,29 | 0,4428 | -0,0061 | |||
| DG / Dollar General Corporation | 0,20 | 0,02 | 0,4288 | 0,4288 | |||||
| BX / Blackstone Inc. | 0,14 | 0,00 | 0,02 | 5,26 | 0,3845 | -0,0164 | |||
| OBDC / Blue Owl Capital Corporation | 1,30 | 4,00 | 0,02 | 0,00 | 0,3422 | -0,0331 | |||
| LNG / Cheniere Energy, Inc. | 0,07 | 0,00 | 0,02 | 6,25 | 0,3129 | -0,0189 | |||
| TPG / TPG Inc. | 0,32 | 0,00 | 0,02 | 14,29 | 0,3033 | -0,0027 | |||
| VICI / VICI Properties Inc. | 0,50 | 17,65 | 0,02 | 23,08 | 0,2992 | 0,0152 | |||
| CLH / Clean Harbors, Inc. | 0,07 | -6,67 | 0,02 | 14,29 | 0,2971 | -0,0057 | |||
| BXSL / Blackstone Secured Lending Fund | 0,47 | 5,56 | 0,01 | 0,00 | 0,2681 | -0,0302 | |||
| OWL / Blue Owl Capital Inc. | 0,75 | 7,14 | 0,01 | 0,00 | 0,2645 | -0,0229 | |||
| GLOB / Globant S.A. | 0,15 | 13,02 | 0,01 | -12,50 | 0,2582 | -0,0721 | |||
| GBDC / Golub Capital BDC, Inc. | 0,85 | 6,25 | 0,01 | 0,00 | 0,2286 | -0,0195 | |||
| HASI / HA Sustainable Infrastructure Capital, Inc. | 0,44 | 4,76 | 0,01 | -8,33 | 0,2170 | -0,0346 | |||
| ARE / Alexandria Real Estate Equities, Inc. | 0,15 | -25,00 | 0,01 | -44,44 | 0,2000 | -0,1790 | |||
| ADBD / Adobe Inc. | 0,03 | -72,13 | 0,01 | -72,97 | 0,1958 | -0,5814 | |||
| JBBB / Janus Detroit Street Trust - Janus Henderson B-BBB CLO ETF | 0,20 | 14,29 | 0,01 | 12,50 | 0,1770 | 0,0025 | |||
| OXLC / Oxford Lane Capital Corp. | 2,20 | 0,00 | 0,01 | -10,00 | 0,1696 | -0,0431 | |||
| HTGC / Hercules Capital, Inc. | 0,38 | 7,14 | 0,01 | 0,00 | 0,1258 | -0,0119 | |||
| STZ / Constellation Brands, Inc. | 0,00 | -100,00 | 0,00 | 0,0000 | |||||
| OTIS / Otis Worldwide Corporation | 0,00 | -100,00 | 0,00 | 0,0000 | |||||
| PSX / Phillips 66 | 0,00 | -100,00 | 0,00 | 0,0000 | |||||
| MRK / Merck & Co., Inc. | 0,00 | -100,00 | 0,00 | 0,0000 |