Grundlæggende statistik
| Insider-profil | LOCKHEED MARTIN INVESTMENT MANAGEMENT CO |
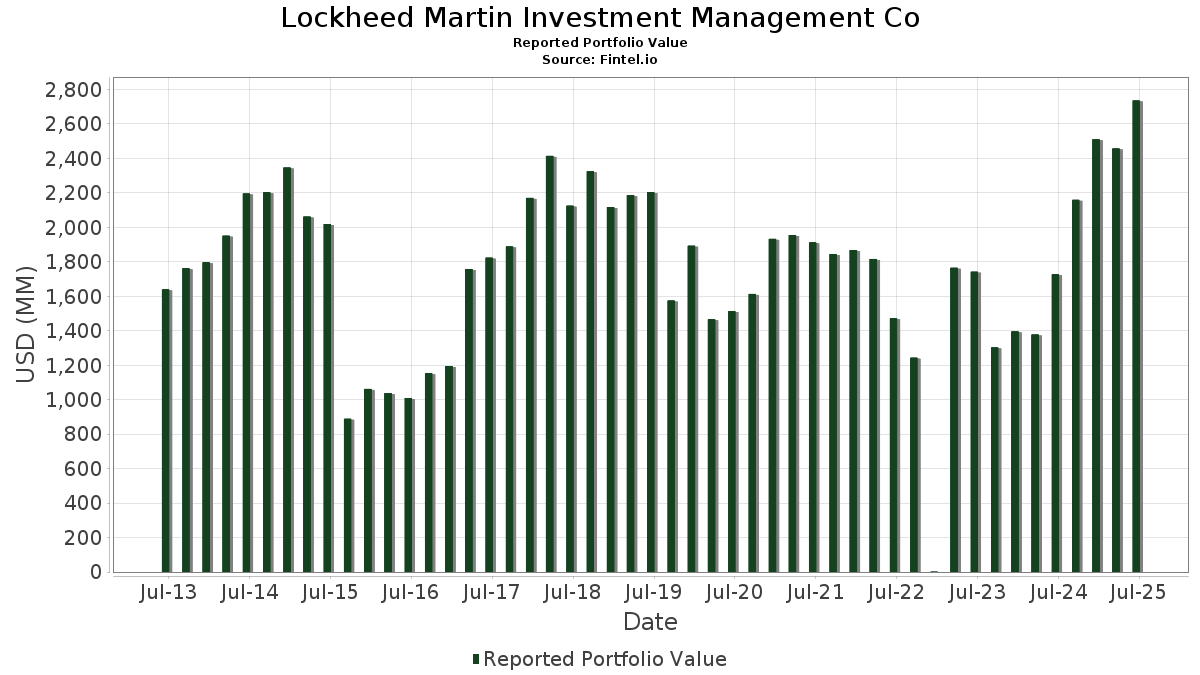
| Porteføljeværdi | $ 2.994.417.899 |
| Nuværende stillinger | 105 |
Seneste beholdninger, ydeevne, AUM (fra 13F, 13D)
Lockheed Martin Investment Management Co har afsløret 105 samlede besiddelser i deres seneste SEC-arkivering. Den seneste porteføljeværdi er beregnet til at være $ 2.994.417.899 USD. Faktiske aktiver under forvaltning (AUM) er denne værdi plus kontanter (som ikke er oplyst). Lockheed Martin Investment Management Cos største beholdninger er Vanguard International Equity Index Funds - Vanguard Total World Stock ETF (US:VT) , iShares Trust - iShares Core U.S. Aggregate Bond ETF (US:AGG) , NVIDIA Corporation (US:NVDA) , Apple Inc. (US:AAPL) , and Vanguard Index Funds - Vanguard S&P 500 ETF (US:VOO) . Lockheed Martin Investment Management Cos nye stillinger omfatter ServiceNow, Inc. (US:NOW) , . Lockheed Martin Investment Management Cos topbrancher er "Apparel And Accessory Stores" (sic 56) , "Rubber And Miscellaneous Plastics Products" (sic 30) , and "Engineering, Accounting, Research, Management, And Related Services" (sic 87) .
Top øger dette kvartal
Vi bruger ændringen i porteføljeallokeringen, fordi dette er den mest meningsfulde metrik. Ændringer kan skyldes handler eller ændringer i aktiekurser.
| Sikkerhed | Aktier (MM) |
Værdi (MM$) |
Portefølje % | ΔPortefølje % |
|---|---|---|---|---|
| GOOGL / Alphabet Inc. | 0,39 | 123,10 | 4,1110 | 2,1225 |
| AAPL / Apple Inc. | 0,74 | 200,88 | 6,7086 | 2,0836 |
| GOOG / Alphabet Inc. | 0,23 | 72,58 | 2,4239 | 2,0427 |
| AMZN / Amazon.com, Inc. | 0,41 | 94,80 | 3,1657 | 1,7389 |
| META / Meta Platforms, Inc. | 0,10 | 66,27 | 2,2132 | 1,1143 |
| NVDA / NVIDIA Corporation | 1,10 | 205,37 | 6,8584 | 0,8689 |
| TSLA / Tesla, Inc. | 0,14 | 62,92 | 2,1011 | 0,7826 |
| AEP / American Electric Power Company, Inc. | 0,25 | 29,14 | 0,9731 | 0,5604 |
| MSFT / Microsoft Corporation | 0,34 | 166,56 | 5,5623 | 0,5513 |
| NEM / Newmont Corporation | 0,13 | 13,32 | 0,4448 | 0,3573 |
Top falder i dette kvartal
Vi bruger ændringen i porteføljeallokeringen, fordi dette er den mest meningsfulde metrik. Ændringer kan skyldes handler eller ændringer i aktiekurser.
| Sikkerhed | Aktier (MM) |
Værdi (MM$) |
Portefølje % | ΔPortefølje % |
|---|---|---|---|---|
| WMT / Walmart Inc. | 0,07 | 7,48 | 0,2497 | -1,1042 |
| VOO / Vanguard Index Funds - Vanguard S&P 500 ETF | 0,30 | 188,58 | 6,2977 | -0,6939 |
| PG / The Procter & Gamble Company | 0,09 | 12,22 | 0,4082 | -0,6809 |
| AGG / iShares Trust - iShares Core U.S. Aggregate Bond ETF | 2,17 | 216,24 | 7,2214 | -0,6613 |
| BAC / Bank of America Corporation | 0,29 | 16,12 | 0,5385 | -0,6578 |
| VT / Vanguard International Equity Index Funds - Vanguard Total World Stock ETF | 1,59 | 224,99 | 7,5137 | -0,5811 |
| AVGO / Broadcom Inc. | 0,16 | 54,99 | 1,8365 | -0,4855 |
| MO / Altria Group, Inc. | 0,35 | 20,28 | 0,6774 | -0,4515 |
| VZ / Verizon Communications Inc. | 0,37 | 15,19 | 0,5074 | -0,4478 |
| IBN / ICICI Bank Limited - Depositary Receipt (Common Stock) | 0,03 | 0,99 | 0,0329 | -0,4371 |
13D/G-arkivering
Dette er en liste over 13D- og 13G-arkiveringer lavet i det sidste år (hvis nogen). Klik på linkikonet for at se den fulde transaktionshistorik. Grønne rækker angiver nye positioner. Røde rækker angiver lukkede positioner.
| Fil dato | Form | Sikkerhed | Forrige Aktier |
Nuværende Aktier |
Δandele % | % Ejerskab |
% ΔEjerskab | |
|---|---|---|---|---|---|---|---|---|
| 2026-02-09 | / () | 0 | 0,00 |
13F og Fondsarkivering
Denne formular blev indsendt den 2026-02-05 for rapporteringsperioden 2025-12-31. Klik på linkikonet for at se den fulde transaktionshistorik.
Opgrader for at låse op for premium-data og eksportere til Excel ![]() .
.
| Sikkerhed | Type | Gennemsnitlig aktiekurs | Aktier (MM) |
Δ Aktier (%) |
Værdi ($MM) |
ΔVærdi (%) |
Portefølje (%) |
ΔPortefølje (%) |
|
|---|---|---|---|---|---|---|---|---|---|
| VT / Vanguard International Equity Index Funds - Vanguard Total World Stock ETF | 1,59 | 0,00 | 224,99 | 2,37 | 7,5137 | -0,5811 | |||
| AGG / iShares Trust - iShares Core U.S. Aggregate Bond ETF | 2,17 | 1,41 | 216,24 | 1,03 | 7,2214 | -0,6613 | |||
| NVDA / NVIDIA Corporation | 1,10 | 26,34 | 205,37 | 26,28 | 6,8584 | 0,8689 | |||
| AAPL / Apple Inc. | 0,74 | 49,83 | 200,88 | 59,97 | 6,7086 | 2,0836 | |||
| VOO / Vanguard Index Funds - Vanguard S&P 500 ETF | 0,30 | -3,00 | 188,58 | -0,66 | 6,2977 | -0,6939 | |||
| MSFT / Microsoft Corporation | 0,34 | 31,11 | 166,56 | 22,42 | 5,5623 | 0,5513 | |||
| GOOGL / Alphabet Inc. | 0,39 | 77,08 | 123,10 | 127,99 | 4,1110 | 2,1225 | |||
| AMZN / Amazon.com, Inc. | 0,41 | 132,75 | 94,80 | 144,68 | 3,1657 | 1,7389 | |||
| VEA / Vanguard Tax-Managed Funds - Vanguard FTSE Developed Markets ETF | 1,25 | 0,00 | 78,09 | 4,26 | 2,6078 | -0,1507 | |||
| JPM / JPMorgan Chase & Co. | 0,24 | -7,87 | 76,13 | -5,89 | 2,5424 | -0,4368 | |||
| GOOG / Alphabet Inc. | 0,23 | 444,24 | 72,58 | 601,27 | 2,4239 | 2,0427 | |||
| IVOO / Vanguard Admiral Funds - Vanguard S&P Mid-Cap 400 ETF | 0,63 | -4,55 | 70,43 | -3,32 | 2,3522 | -0,3309 | |||
| IEMG / iShares, Inc. - iShares Core MSCI Emerging Markets ETF | 0,99 | -1,68 | 66,75 | 0,26 | 2,2291 | -0,2229 | |||
| META / Meta Platforms, Inc. | 0,10 | 147,11 | 66,27 | 122,12 | 2,2132 | 1,1143 | |||
| IEFA / iShares Trust - iShares Core MSCI EAFE ETF | 0,71 | -3,51 | 63,96 | -1,13 | 2,1361 | -0,2466 | |||
| TSLA / Tesla, Inc. | 0,14 | 73,79 | 62,92 | 75,75 | 2,1011 | 0,7826 | |||
| TSM / Taiwan Semiconductor Manufacturing Company Limited - Depositary Receipt (Common Stock) | 0,20 | 12,93 | 61,05 | 22,88 | 2,0388 | 0,2090 | |||
| AVGO / Broadcom Inc. | 0,16 | -16,86 | 54,99 | -12,78 | 1,8365 | -0,4855 | |||
| BND / Vanguard Bond Index Funds - Vanguard Total Bond Market ETF | 0,72 | 0,00 | 53,33 | -0,40 | 1,7810 | -0,1911 | |||
| JNJ / Johnson & Johnson | 0,25 | 5,14 | 52,59 | 17,35 | 1,7563 | 0,1057 | |||
| DUK / Duke Energy Corporation | 0,38 | 39,48 | 44,90 | 32,11 | 1,4994 | 0,2477 | |||
| VGLT / Vanguard Scottsdale Funds - Vanguard Long-Term Treasury ETF | 0,57 | 3,64 | 31,81 | 1,70 | 1,0622 | -0,0896 | |||
| AEP / American Electric Power Company, Inc. | 0,25 | 153,71 | 29,14 | 160,04 | 0,9731 | 0,5604 | |||
| GOVT / iShares Trust - iShares U.S. Treasury Bond ETF | 1,25 | 0,00 | 28,78 | -0,41 | 0,9612 | -0,1032 | |||
| KO / The Coca-Cola Company | 0,36 | -17,43 | 25,19 | -12,97 | 0,8411 | -0,2247 | |||
| BTI / British American Tobacco p.l.c. - Depositary Receipt (Common Stock) | 0,44 | 4,41 | 24,94 | 11,37 | 0,8327 | 0,0082 | |||
| SO / The Southern Company | 0,25 | 69,73 | 22,20 | 56,17 | 0,7412 | 0,2178 | |||
| MO / Altria Group, Inc. | 0,35 | -24,18 | 20,28 | -33,82 | 0,6774 | -0,4515 | |||
| NGG / National Grid plc - Depositary Receipt (Common Stock) | 0,24 | -13,19 | 18,94 | -7,60 | 0,6326 | -0,1224 | |||
| BCI / abrdn ETFs - abrdn Bloomberg All Commodity Strategy K-1 Free ETF | 0,94 | 0,00 | 18,32 | -9,33 | 0,6118 | -0,1324 | |||
| XOM / Exxon Mobil Corporation | 0,14 | 18,15 | 16,59 | 26,11 | 0,5541 | 0,0695 | |||
| RTX / RTX Corporation | 0,09 | 11,98 | 16,27 | 22,73 | 0,5433 | 0,0551 | |||
| CME / CME Group Inc. | 0,06 | 11,96 | 16,20 | 13,16 | 0,5411 | 0,0138 | |||
| BAC / Bank of America Corporation | 0,29 | -53,44 | 16,12 | -50,36 | 0,5385 | -0,6578 | |||
| HD / The Home Depot, Inc. | 0,05 | 11,94 | 15,80 | -4,93 | 0,5278 | -0,0845 | |||
| VZ / Verizon Communications Inc. | 0,37 | -36,79 | 15,19 | -41,42 | 0,5074 | -0,4478 | |||
| IBM / International Business Machines Corporation | 0,05 | 24,28 | 14,10 | 30,47 | 0,4709 | 0,0729 | |||
| UNP / Union Pacific Corporation | 0,06 | 11,62 | 14,05 | 9,24 | 0,4691 | -0,0045 | |||
| TXN / Texas Instruments Incorporated | 0,08 | 29,28 | 13,53 | 22,07 | 0,4518 | 0,0436 | |||
| NEM / Newmont Corporation | 0,13 | 373,05 | 13,32 | 460,33 | 0,4448 | 0,3573 | |||
| LLY / Eli Lilly and Company | 0,01 | 2,63 | 12,98 | 44,57 | 0,4335 | 0,1028 | |||
| CRM / Salesforce, Inc. | 0,05 | 55,56 | 12,80 | 73,89 | 0,4273 | 0,1563 | |||
| PG / The Procter & Gamble Company | 0,09 | -55,68 | 12,22 | -58,66 | 0,4082 | -0,6809 | |||
| HIG / The Hartford Insurance Group, Inc. | 0,08 | 11,89 | 11,51 | 15,60 | 0,3844 | 0,0177 | |||
| PEP / PepsiCo, Inc. | 0,08 | 5,27 | 11,44 | 7,58 | 0,3822 | -0,0096 | |||
| CSCO / Cisco Systems, Inc. | 0,14 | -9,07 | 10,93 | 2,37 | 0,3652 | -0,0282 | |||
| ADBE / Adobe Inc. | 0,03 | 65,14 | 10,73 | 63,85 | 0,3582 | 0,1171 | |||
| PM / Philip Morris International Inc. | 0,07 | -13,79 | 10,43 | -14,74 | 0,3482 | -0,1022 | |||
| ABBV / AbbVie Inc. | 0,05 | 11,98 | 10,31 | 10,51 | 0,3444 | 0,0007 | |||
| OEF / iShares Trust - iShares S&P 100 ETF | 0,03 | 0,00 | 10,29 | 3,04 | 0,3436 | -0,0241 | |||
| VTWO / Vanguard Scottsdale Funds - Vanguard Russell 2000 ETF | 0,10 | 0,00 | 9,95 | 1,74 | 0,3324 | -0,0279 | |||
| MRK / Merck & Co., Inc. | 0,09 | -33,62 | 9,87 | -16,75 | 0,3297 | -0,1070 | |||
| UNH / UnitedHealth Group Incorporated | 0,03 | 11,97 | 9,82 | 7,04 | 0,3280 | -0,0099 | |||
| DBC / Invesco DB Commodity Index Tracking Fund | 0,43 | -25,86 | 9,61 | -26,43 | 0,3211 | -0,1602 | |||
| NOC / Northrop Grumman Corporation | 0,02 | 11,33 | 9,30 | 4,19 | 0,3106 | -0,0182 | |||
| TMO / Thermo Fisher Scientific Inc. | 0,02 | 43,10 | 9,25 | 70,97 | 0,3090 | 0,1097 | |||
| DHR / Danaher Corporation | 0,04 | 57,46 | 9,13 | 81,82 | 0,3050 | 0,1200 | |||
| ITW / Illinois Tool Works Inc. | 0,04 | 10,13 | 9,00 | 4,02 | 0,3005 | -0,0181 | |||
| CMG / Chipotle Mexican Grill, Inc. | 0,24 | 11,90 | 8,70 | 5,65 | 0,2904 | -0,0128 | |||
| V / Visa Inc. | 0,02 | 12,08 | 8,33 | 15,13 | 0,2783 | 0,0117 | |||
| MAR / Marriott International, Inc. | 0,03 | 11,93 | 7,95 | 33,35 | 0,2653 | 0,0459 | |||
| NVS / Novartis AG - Depositary Receipt (Common Stock) | 0,06 | -32,75 | 7,90 | -27,70 | 0,2638 | -0,1386 | |||
| CVX / Chevron Corporation | 0,05 | 12,38 | 7,77 | 10,29 | 0,2596 | 0,0000 | |||
| MA / Mastercard Incorporated | 0,01 | 11,91 | 7,56 | 12,33 | 0,2526 | 0,0046 | |||
| WMT / Walmart Inc. | 0,07 | -81,18 | 7,48 | -79,66 | 0,2497 | -1,1042 | |||
| SHEL / Shell plc - Depositary Receipt (Common Stock) | 0,10 | 241,70 | 7,40 | 251,16 | 0,2471 | 0,1695 | |||
| PDBC / Invesco Optimum Yield Diversified Commodity Strategy No K-1 ETF | 0,55 | -15,38 | 7,29 | -16,52 | 0,2434 | -0,0781 | |||
| EWC / iShares, Inc. - iShares MSCI Canada ETF | 0,13 | 0,00 | 7,27 | 6,68 | 0,2428 | -0,0082 | |||
| CB / Chubb Limited | 0,02 | 162,30 | 7,12 | 190,10 | 0,2379 | 0,1474 | |||
| NFLX / Netflix, Inc. | 0,06 | 1.019,64 | 5,88 | -12,44 | 0,1963 | -0,0509 | |||
| MCK / McKesson Corporation | 0,01 | -33,33 | 5,74 | -29,21 | 0,1918 | -0,1070 | |||
| USB / U.S. Bancorp | 0,10 | -32,29 | 5,34 | -25,23 | 0,1782 | -0,0847 | |||
| BSX / Boston Scientific Corporation | 0,05 | 11,99 | 5,20 | 9,38 | 0,1737 | -0,0014 | |||
| EW / Edwards Lifesciences Corporation | 0,06 | 12,11 | 5,12 | 22,90 | 0,1710 | 0,0176 | |||
| ISRG / Intuitive Surgical, Inc. | 0,01 | 11,82 | 5,09 | 41,61 | 0,1700 | 0,0376 | |||
| DIS / The Walt Disney Company | 0,04 | 54,81 | 4,76 | 53,83 | 0,1588 | 0,0450 | |||
| AMT / American Tower Corporation | 0,02 | 11,55 | 4,27 | 1,84 | 0,1427 | -0,0118 | |||
| PLD / Prologis, Inc. | 0,03 | 11,97 | 4,12 | 24,81 | 0,1376 | 0,0160 | |||
| SPY / State Street SPDR S&P 500 ETF Trust | 0,01 | 0,00 | 4,09 | 2,35 | 0,1366 | -0,0106 | |||
| AMD / Advanced Micro Devices, Inc. | 0,02 | 11,98 | 4,02 | 48,27 | 0,1344 | 0,0344 | |||
| BCS / Barclays PLC - Depositary Receipt (Common Stock) | 0,15 | -22,01 | 3,90 | -3,96 | 0,1304 | -0,0194 | |||
| RSP / Invesco Exchange-Traded Fund Trust - Invesco S&P 500 Equal Weight ETF | 0,02 | 0,00 | 3,83 | 0,98 | 0,1279 | -0,0118 | |||
| ORCL / Oracle Corporation | 0,02 | -54,11 | 3,74 | -68,20 | 0,1250 | -0,3084 | |||
| CCI / Crown Castle Inc. | 0,04 | 11,96 | 3,59 | 3,10 | 0,1200 | -0,0083 | |||
| CMCSA / Comcast Corporation | 0,10 | 9,29 | 3,05 | 3,96 | 0,1018 | -0,0062 | |||
| DLR / Digital Realty Trust, Inc. | 0,02 | 12,06 | 2,99 | 0,27 | 0,0998 | -0,0099 | |||
| REGN / Regeneron Pharmaceuticals, Inc. | 0,00 | 2,70 | 0,0902 | 0,0902 | |||||
| NEE / NextEra Energy, Inc. | 0,03 | 13,23 | 2,65 | 20,44 | 0,0886 | 0,0075 | |||
| RIO / Rio Tinto Group - Depositary Receipt (Common Stock) | 0,03 | -26,65 | 2,53 | -11,10 | 0,0846 | -0,0203 | |||
| BHP / BHP Group Limited - Depositary Receipt (Common Stock) | 0,04 | -29,27 | 2,26 | -23,41 | 0,0755 | -0,0332 | |||
| LYG / Lloyds Banking Group plc - Depositary Receipt (Common Stock) | 0,39 | 0,00 | 2,06 | 16,74 | 0,0687 | 0,0038 | |||
| TM / Toyota Motor Corporation - Depositary Receipt (Common Stock) | 0,01 | 38,02 | 1,79 | 54,58 | 0,0597 | 0,0171 | |||
| SLB / SLB N.V. | 0,04 | 20,71 | 1,71 | 34,78 | 0,0572 | 0,0104 | |||
| HAL / Halliburton Company | 0,06 | 11,45 | 1,64 | 28,08 | 0,0549 | 0,0076 | |||
| LIN / Linde plc | 0,00 | 20,88 | 1,53 | 8,51 | 0,0511 | -0,0008 | |||
| SAN / Banco Santander, S.A. - Depositary Receipt (Common Stock) | 0,13 | 0,00 | 1,47 | 11,88 | 0,0491 | 0,0007 | |||
| NVO / Novo Nordisk A/S - Depositary Receipt (Common Stock) | 0,03 | 0,00 | 1,42 | -8,26 | 0,0475 | -0,0096 | |||
| SMFG / Sumitomo Mitsui Financial Group, Inc. - Depositary Receipt (Common Stock) | 0,07 | 0,00 | 1,36 | 15,49 | 0,0453 | 0,0020 | |||
| NOW / ServiceNow, Inc. | 0,01 | 1,30 | 0,0435 | 0,0435 | |||||
| MUFG / Mitsubishi UFJ Financial Group, Inc. - Depositary Receipt (Common Stock) | 0,08 | 0,00 | 1,28 | -0,47 | 0,0426 | -0,0046 | |||
| BP / BP p.l.c. - Depositary Receipt (Common Stock) | 0,04 | 1,25 | 0,0416 | 0,0416 | |||||
| ASML / ASML Holding N.V. - Depositary Receipt (Common Stock) | 0,00 | 0,00 | 1,02 | 10,55 | 0,0339 | 0,0001 | |||
| IBN / ICICI Bank Limited - Depositary Receipt (Common Stock) | 0,03 | -92,16 | 0,99 | -92,27 | 0,0329 | -0,4371 | |||
| SAP / SAP SE - Depositary Receipt (Common Stock) | 0,00 | 0,00 | 0,83 | -9,09 | 0,0277 | -0,0059 | |||
| RBRK / Rubrik, Inc. | 0,00 | 0,24 | 0,0079 | 0,0079 | |||||
| CL / Colgate-Palmolive Company | 0,00 | -100,00 | 0,00 | 0,0000 | |||||
| AMGN / Amgen Inc. | 0,00 | -100,00 | 0,00 | 0,0000 | |||||
| WFC / Wells Fargo & Company | 0,00 | -100,00 | 0,00 | 0,0000 | |||||
| CM / Canadian Imperial Bank of Commerce | 0,00 | -100,00 | 0,00 | 0,0000 | |||||
| T / AT&T Inc. | 0,00 | -100,00 | 0,00 | 0,0000 | |||||
| WM / Waste Management, Inc. | 0,00 | -100,00 | 0,00 | 0,0000 | |||||
| BRK.B / Berkshire Hathaway Inc. | 0,00 | -100,00 | 0,00 | 0,0000 | |||||
| PFE / Pfizer Inc. | 0,00 | -100,00 | 0,00 | 0,0000 | |||||
| HOOD / Robinhood Markets, Inc. | 0,00 | -100,00 | 0,00 | 0,0000 | |||||
| COST / Costco Wholesale Corporation | 0,00 | -100,00 | 0,00 | 0,0000 | |||||
| HON / Honeywell International Inc. | 0,00 | -100,00 | 0,00 | 0,0000 | |||||
| CEG / Constellation Energy Corporation | 0,00 | -100,00 | 0,00 | 0,0000 | |||||
| PGR / The Progressive Corporation | 0,00 | -100,00 | 0,00 | 0,0000 | |||||
| GEV / GE Vernova Inc. | 0,00 | -100,00 | 0,00 | 0,0000 |