Grundlæggende statistik
| Institutionelle aktier (lange) | 511.419.536 - 82,50% (ex 13D/G) - change of -51,25MM shares -9,11% MRQ |
| Institutionel værdi (lang) | $ 18.169.648 USD ($1000) |
Institutionelt ejerskab og aktionærer
Devon Energy Corporation (US:DVN) har 1335 institutionelle ejere og aktionærer, der har indsendt 13D/G- eller 13F-formularer til Securities Exchange Commission (SEC). Disse institutioner har i alt 511,469,467 aktier. Største aktionærer omfatter Vanguard Group Inc, BlackRock, Inc., State Street Corp, Geode Capital Management, Llc, Victory Capital Management Inc, EnCap Energy Capital Fund XI, L.P., Morgan Stanley, EnCap Partners GP, LLC, Dimensional Fund Advisors Lp, and Kimmeridge Energy Management Company, LLC .
Devon Energy Corporation (NYSE:DVN) institutionel ejerskabsstruktur viser aktuelle positioner i virksomheden efter institutioner og fonde, samt seneste ændringer i positionsstørrelse. Større aktionærer kan omfatte individuelle investorer, investeringsforeninger, hedgefonde eller institutioner. Skema 13D angiver, at investoren besidder (eller besidder) mere end 5 % af virksomheden og har til hensigt (eller har til hensigt at) aktivt at forfølge en ændring i forretningsstrategi. Skema 13G indikerer en passiv investering på over 5%.
The share price as of March 13, 2026 is 46,25 / share. Previously, on March 17, 2025, the share price was 35,11 / share. This represents an increase of 31,73% over that period.

Fondens stemningsscore
Fund Sentiment Score (fka Ownership Accumulation Score) finder de aktier, der bliver mest købt af fonde. Det er resultatet af en sofistikeret, multi-faktor kvantitativ model, der identificerer virksomheder med de højeste niveauer af institutionel akkumulering. Scoringsmodellen bruger en kombination af den samlede stigning i oplyste ejere, ændringerne i porteføljeallokeringer i disse ejere og andre målinger. Tallet går fra 0 til 100, hvor højere tal indikerer et højere niveau af akkumulering for sine jævnaldrende, og 50 er gennemsnittet.
Opdateringsfrekvens: Dagligt
Se Ownership Explorer, som giver en liste over højest rangerende virksomheder.
AI+ Ask Fintel’s AI assistant about Devon Energy Corporation.
Select a question to share a public post with an AI-crafted answer.
Thinking of good questions…
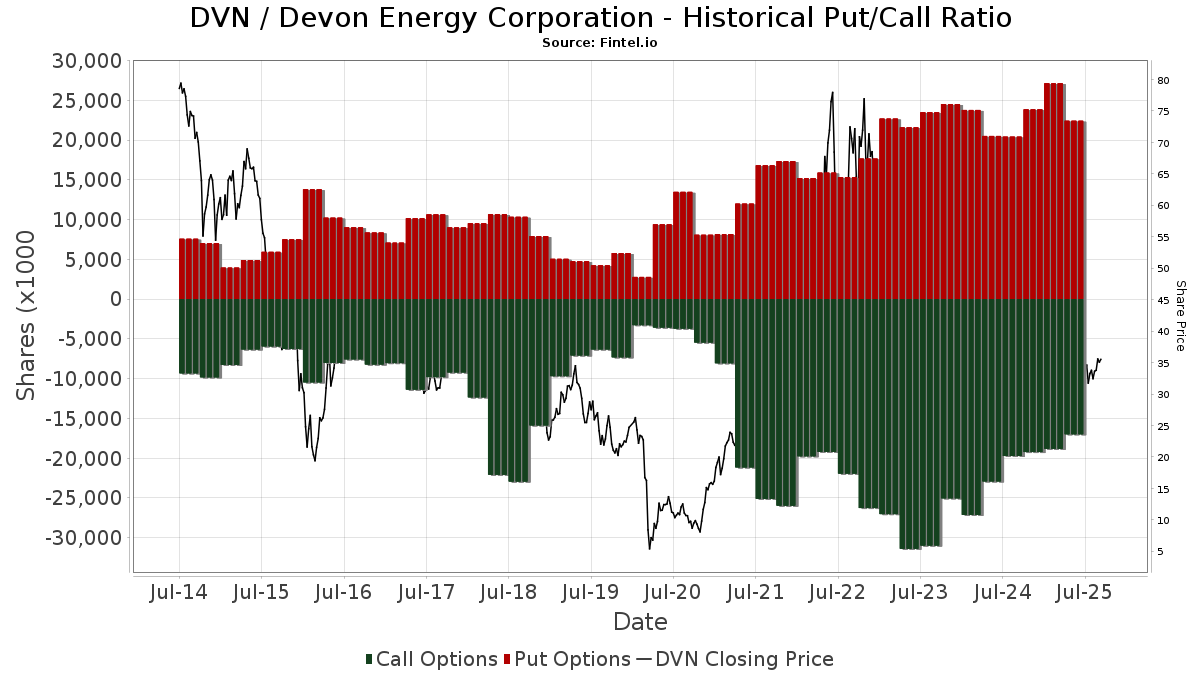
Institutionel Put/Call-forhold
Ud over at indberette standardaktie- og gældsudstedelser skal institutter med mere end 100 mill. aktiver under forvaltning også oplyse deres put- og call-optionsbeholdninger. Da salgsoptioner generelt indikerer negativ stemning, og købsoptioner indikerer positiv stemning, kan vi få en fornemmelse af den overordnede institutionelle stemning ved at plotte forholdet mellem put og kald. Diagrammet til højre viser det historiske put/call-forhold for dette instrument.
Brug af Put/Call Ratio som en indikator for investorernes stemning overvinder en af de vigtigste mangler ved at bruge totalt institutionelt ejerskab, som er, at en betydelig mængde af aktiver under forvaltning investeres passivt for at spore indekser. Passivt forvaltede fonde køber typisk ikke optioner, så indikatoren for put/call-forholdet følger mere nøje følelsen af aktivt forvaltede fonde.
13D/G-arkivering
Vi præsenterer 13D/G ansøgninger separat fra 13F ansøgninger på grund af den forskellige behandling af SEC. 13D/G-ansøgninger kan indgives af grupper af investorer (med én ledende), hvorimod 13F-ansøgninger ikke kan. Dette resulterer i situationer, hvor en investor kan indsende en 13D/G, der rapporterer én værdi for de samlede aktier (der repræsenterer alle de aktier, der ejes af investorgruppen), men derefter indsender en 13F, der rapporterer en anden værdi for de samlede aktier (der udelukkende repræsenterer deres egne) ejendomsret). Det betyder, at aktieejerskab af 13D/G-arkiver og 13F-arkiveringer ofte ikke er direkte sammenlignelige, så vi præsenterer dem separat.
Bemærk: Fra den 16. maj 2021 viser vi ikke længere ejere, der ikke har indsendt en 13D/G inden for det seneste år. Tidligere viste vi den fulde historie af 13D/G-arkiver. Generelt skal enheder, der er forpligtet til at indgive 13D/G-ansøgninger, indgive mindst årligt, før de indsender en afsluttende ansøgning. Dog forlader fonde nogle gange positioner uden at indsende en afsluttende ansøgning (dvs. de afvikler), så visning af den fulde historie resulterede nogle gange i forvirring om det nuværende ejerskab. For at undgå forvirring viser vi nu kun 'aktuelle' ejere - det vil sige - ejere, der har anmeldt inden for det seneste år.
Upgrade to unlock premium data.
| Fil dato | Form | Investor | Forrige Aktier |
Seneste Aktier |
Δ Aktier (Procent) |
Ejendomsret (Procent) |
Δ Ejerskab (Procent) |
|
|---|---|---|---|---|---|---|---|---|
| 2026-01-21 | BlackRock, Inc. | 44,508,195 | 49,513,335 | 11.25 | 7.90 | 14.49 | ||
| 2025-04-30 | VANGUARD GROUP INC | 73,897,653 | 82,780,446 | 12.02 | 12.75 | 10.58 |
13F og NPORT arkivering
Detaljer om 13F-arkivering er gratis. Detaljer om NP-ansøgninger kræver et premium-medlemskab. Grønne rækker angiver nye positioner. Røde rækker angiver lukkede positioner. Klik på linket ikon for at se den fulde transaktionshistorik.
Opgrader
for at låse premium-data op og eksportere til Excel ![]() .
.
Important Note
In an effort to reduce load times for our mobile users, we are testing some ways to deliver lighter pages.
In this first test, we will deliver only the most recent 750 transactions (out of 1662 for this stock). If you are interested in loading *all* the transactions for this company, click the "load all" button below. This is just a test and if you don't like it, please let us know by submitting some gentle feedback via the link at the bottom of this page.
Load All| Fil dato | Kilde | Investor | Type | Gennemsnitlig pris (Øst) |
Aktier | Δ Aktier (%) |
Rapporteret Værdi ($1000) |
Δ Værdi (%) |
Port Alloc (%) |
|
|---|---|---|---|---|---|---|---|---|---|---|
| 2025-09-25 | NP | ILCB - iShares Morningstar Large-Cap ETF | 11.852 | -5,15 | 394 | 3,42 | ||||
| 2026-02-11 | 13F | Total Wealth Planning & Management, Inc. | 20.835 | 3,35 | 763 | 19,03 | ||||
| 2026-02-14 | 13F | Silver Grove Financial Group, Inc. | 2.500 | 92 | ||||||
| 2026-01-21 | 13F | Sowell Financial Services LLC | 14.077 | 11,07 | 516 | 15,99 | ||||
| 2026-02-06 | 13F | Cullen/frost Bankers, Inc. | 7.011 | 80,88 | 257 | 89,63 | ||||
| 2025-11-12 | 13F | Aster Capital Management (DIFC) Ltd | 0 | -100,00 | 0 | -100,00 | ||||
| 2026-02-13 | 13F | Cornerstone Financial Management LLC | 160 | 6 | ||||||
| 2026-02-06 | 13F | HighTower Advisors, LLC | 152.880 | -8,33 | 5.600 | -4,24 | ||||
| 2026-01-29 | 13F | Advantage Trust Co | 0 | -100,00 | 0 | |||||
| 2025-09-25 | NP | DFEOX - U.s. Core Equity 1 Portfolio - Institutional Class This fund is a listed as child fund of Dimensional Fund Advisors Lp and if that institution has disclosed ownership in this security, then these positions will not be double counted when calculating total shares and total value | 773.451 | -8,11 | 25.694 | 0,38 | ||||
| 2025-09-26 | NP | FLAPX - Fidelity Flex Mid Cap Index Fund This fund is a listed as child fund of Fmr Llc and if that institution has disclosed ownership in this security, then these positions will not be double counted when calculating total shares and total value | 14.196 | -48,86 | 472 | -44,19 | ||||
| 2025-09-26 | NP | FLCPX - Fidelity SAI U.S. Large Cap Index Fund This fund is a listed as child fund of Fmr Llc and if that institution has disclosed ownership in this security, then these positions will not be double counted when calculating total shares and total value | 168.089 | -14,64 | 5.584 | -6,75 | ||||
| 2025-09-29 | NP | CRQSX - CATHOLIC RESPONSIBLE INVESTMENTS EQUITY INDEX FUND Institutional Shares | 51.780 | -0,96 | 1.720 | 8,24 | ||||
| 2026-02-05 | 13F | Northwestern Mutual Investment Management Company, Llc | 20.043 | -0,94 | 734 | 3,53 | ||||
| 2025-09-24 | NP | PLFMX - LargeCap S&P 500 Index Fund R-3 | 111.022 | -4,07 | 3.688 | 4,80 | ||||
| 2025-11-17 | 13F | Perritt Capital Management Inc | 0 | -100,00 | 0 | -100,00 | ||||
| 2026-02-17 | 13F | Integrated Advisors Network LLC | 5.568 | -8,39 | 204 | -4,69 | ||||
| 2026-02-11 | 13F | Hughes Financial Services, LLC | 24 | -97,56 | 1 | -100,00 | ||||
| 2026-01-21 | 13F | SJS Investment Consulting Inc. | 162 | 422,58 | 6 | 400,00 | ||||
| 2026-02-13 | 13F | Mml Investors Services, Llc | 62.397 | 2,07 | 2.286 | 6,63 | ||||
| 2026-01-07 | 13F | Harbor Investment Advisory, Llc | 524 | 0,00 | 19 | 5,56 | ||||
| 2026-02-13 | 13F/A | Ontario Teachers Pension Plan Board | 0 | -100,00 | 0 | |||||
| 2025-09-25 | NP | Dfa Investment Trust Co - The U.s. Large Cap Value Series This fund is a listed as child fund of Dimensional Fund Advisors Lp and if that institution has disclosed ownership in this security, then these positions will not be double counted when calculating total shares and total value | 2.126.023 | 0,00 | 70.626 | 9,24 | ||||
| 2026-02-18 | 13F | Garton & Associates Financial Advisors LLC | 800 | 29 | ||||||
| 2026-02-13 | 13F | William B. Walkup & Associates, Inc. | 24.257 | 1,86 | 889 | 6,47 | ||||
| 2026-02-13 | 13F | Pinnacle Wealth Planning Services, Inc. | 6.718 | 0,36 | 246 | 5,13 | ||||
| 2026-02-13 | 13F | Towarzystwo Funduszy Inwestycyjnych Pzu Sa | 0 | -100,00 | 0 | |||||
| 2026-02-12 | 13F | Raiffeisen Bank International AG | 37.000 | 1.362 | ||||||
| 2026-02-02 | 13F | Truist Financial Corp | 41.171 | -9,43 | 1.508 | -5,34 | ||||
| 2026-02-03 | 13F | Yacktman Asset Management Lp | 432.311 | -17,05 | 15.836 | -13,34 | ||||
| 2026-02-10 | 13F | Bruce G. Allen Investments, LLC | 317 | 3,26 | 12 | 10,00 | ||||
| 2026-02-13 | 13F | Kestra Advisory Services, LLC | 0 | -100,00 | 0 | |||||
| 2026-02-10 | 13F | Core Wealth Advisors, Llc | 193 | 7 | ||||||
| 2026-02-17 | 13F | Ameriprise Financial Inc | 3.414.333 | 16,40 | 125.076 | 21,61 | ||||
| 2026-02-03 | 13F | SBI Securities Co., Ltd. | 4.781 | 20,67 | 175 | 26,81 | ||||
| 2026-01-23 | 13F | Reuter James Wealth Management, Llc | 16.301 | 0,00 | 597 | 4,55 | ||||
| 2025-11-17 | 13F | IMS Capital Management | 7.305 | -20,55 | 256 | -12,33 | ||||
| 2026-01-26 | 13F | JNBA Financial Advisors | 189 | 0,00 | 7 | 0,00 | ||||
| 2026-02-04 | 13F | Virginia Retirement Systems Et Al | 635.800 | 552,10 | 23.289 | 581,36 | ||||
| 2026-02-05 | 13F | Allworth Financial LP | 20.033 | -4,00 | 734 | 0,27 | ||||
| 2026-01-22 | 13F | Investment Advisory Services Inc /tx /adv | 12.340 | 0,00 | 452 | 4,63 | ||||
| 2026-01-26 | 13F | Provenance Wealth Advisors, LLC | 266 | 0,00 | 10 | 0,00 | ||||
| 2025-09-26 | NP | RSEAX - U.S. Strategic Equity Fund Class A | 121.536 | 102,10 | 4.037 | 120,84 | ||||
| 2026-01-08 | 13F | NorthCrest Asset Manangement, LLC | 14.228 | -36,15 | 520 | -33,25 | ||||
| 2025-09-17 | NP | GGEAX - Nationwide Global Sustainable Equity Fund Class A | 53.845 | -4,81 | 1.789 | 3,95 | ||||
| 2026-02-05 | 13F | AlphaCore Capital LLC | 13.785 | 505 | ||||||
| 2026-02-13 | 13F | Neuberger Berman Group LLC | 2.201.216 | -48,39 | 80.667 | -46,07 | ||||
| 2026-02-06 | 13F | Covestor Ltd | 3.495 | 33,09 | 0 | |||||
| 2025-09-24 | NP | FENY - Fidelity MSCI Energy Index ETF This fund is a listed as child fund of Fmr Llc and if that institution has disclosed ownership in this security, then these positions will not be double counted when calculating total shares and total value | 459.285 | -5,33 | 15.257 | 3,42 | ||||
| 2026-02-13 | 13F | Truvestments Capital Llc | 152 | 0,00 | 6 | 0,00 | ||||
| 2026-02-10 | 13F | Moors & Cabot, Inc. | 27.362 | -2,88 | 1.002 | 1,52 | ||||
| 2026-02-17 | 13F | Woodline Partners LP | 106.582 | -26,07 | 3.904 | -22,75 | ||||
| 2025-10-17 | 13F | Annex Advisory Services, LLC | 0 | -100,00 | 0 | -100,00 | ||||
| 2026-02-02 | 13F | Ellis Investment Partners, LLC | 41.024 | -3,37 | 1.503 | 0,94 | ||||
| 2025-09-26 | NP | TOV - JLens 500 Jewish Advocacy U.S. ETF | 1.988 | 18,19 | 66 | 29,41 | ||||
| 2026-01-20 | 13F | Perpetual Ltd | 9.121 | -70,05 | 334 | -68,70 | ||||
| 2026-02-17 | 13F | Signature Equity Partners, LLC | 147 | 5 | ||||||
| 2025-10-07 | 13F | GFG Capital, LLC | 0 | -100,00 | 0 | |||||
| 2026-02-17 | 13F | Maryland State Retirement & Pension System | 31.188 | 0,00 | 1.142 | 4,48 | ||||
| 2026-02-13 | 13F | Toroso Investments, LLC | 145.504 | 66,14 | 5.330 | 73,58 | ||||
| 2026-02-04 | 13F | Pandora Wealth, Inc. | 500 | 0,00 | 18 | 5,88 | ||||
| 2026-02-06 | 13F | Twin Capital Management Inc | 37.056 | 0,92 | 1.357 | 5,44 | ||||
| 2026-02-03 | 13F | Asset Planning,Inc | 1.062 | -27,01 | 39 | -25,49 | ||||
| 2026-02-10 | 13F | Rothschild Investment Llc | 83.871 | -6,02 | 3.072 | -1,79 | ||||
| 2026-02-13 | 13F | Level Four Advisory Services, Llc | 6.959 | -20,54 | 255 | -17,26 | ||||
| 2025-09-24 | NP | OFVIX - O'Shaughnessy Market Leaders Value Fund Class I | 51.719 | 11,07 | 1.718 | 21,33 | ||||
| 2026-01-28 | 13F | West Michigan Advisors, Llc | 47.376 | 2,98 | 1.735 | 7,63 | ||||
| 2026-02-09 | 13F | Parkside Investments, LLC | 81.479 | -7,73 | 2.985 | -3,59 | ||||
| 2025-09-29 | NP | HIBL - Direxion Daily S&P 500(R) High Beta Bull 3X Shares | 8.601 | 286 | ||||||
| 2026-01-22 | 13F | City Holding Co | 290 | 0,00 | 11 | 0,00 | ||||
| 2026-02-11 | 13F | Empowered Funds, LLC | 646.534 | 15,44 | 23.683 | 20,61 | ||||
| 2026-02-17 | 13F | Tcw Group Inc | 9.627 | 353 | ||||||
| 2026-01-29 | 13F | D.a. Davidson & Co. | 92.126 | -38,10 | 3.375 | -35,33 | ||||
| 2026-02-06 | 13F | Redmont Wealth Advisors Llc | 961 | -24,63 | 35 | -20,45 | ||||
| 2026-02-04 | 13F | HighPoint Advisor Group LLC | 7.348 | 8,46 | 269 | 13,50 | ||||
| 2026-01-21 | 13F | Clayton Financial Group LLC | 116 | 4 | ||||||
| 2026-02-17 | 13F | DV Trading LLC | 517 | 19 | ||||||
| 2026-01-20 | 13F | Stratos Wealth Partners, LTD. | 20.003 | -12,99 | 733 | -9,07 | ||||
| 2026-02-12 | 13F | Advisors Asset Management, Inc. | 90.130 | -17,42 | 3.301 | -13,72 | ||||
| 2025-10-24 | 13F | Hemington Wealth Management | 439 | 198,64 | 0 | |||||
| 2026-02-10 | 13F | Intech Investment Management Llc | 33.750 | -16,53 | 1.236 | -12,77 | ||||
| 2026-02-24 | 13F | MidFirst Bank | 25.314 | 927 | ||||||
| 2026-01-22 | 13F | Iron Financial, LLC | 6.220 | -3,74 | 228 | 0,44 | ||||
| 2026-01-06 | 13F | Martin Capital Partners, LLC | 132.827 | -0,82 | 5 | 0,00 | ||||
| 2026-02-17 | 13F | Man Group plc | 1.522.163 | -48,08 | 55.757 | -45,75 | ||||
| 2026-01-29 | 13F | Dunhill Financial, LLC | 22 | 46,67 | 1 | |||||
| 2025-11-17 | 13F | PharVision Advisers, LLC | 0 | -100,00 | 0 | -100,00 | ||||
| 2025-09-26 | NP | BLPIX - Bull Profund Investor Class | 432 | -15,29 | 14 | -6,67 | ||||
| 2026-02-13 | 13F | Resources Management Corp /ct/ /adv | 9.535 | 2,09 | 0 | |||||
| 2026-02-13 | 13F | Capital Financial Group Inc\co\ /adv | 7.940 | 291 | ||||||
| 2026-01-05 | 13F | Park Avenue Securities Llc | 18.851 | 2,40 | 1 | |||||
| 2026-02-02 | 13F | CENTRAL TRUST Co | 2.122 | -24,99 | 78 | -22,22 | ||||
| 2026-02-03 | 13F | Crossmark Global Holdings, Inc. | 22.324 | -8,95 | 818 | -4,89 | ||||
| 2026-02-10 | 13F | Impact Partnership Wealth, LLC | 29.936 | 1.097 | ||||||
| 2026-02-12 | 13F | Pinnacle Holdings, LLC | 3.021 | -2,26 | 111 | 1,85 | ||||
| 2026-01-23 | 13F | Guidance Capital, Inc | 6.782 | -8,66 | 258 | 5,33 | ||||
| 2025-09-25 | NP | CCNR - ALPS | CoreCommodity Natural Resources ETF | 77.866 | -14,77 | 2.587 | -6,91 | ||||
| 2026-02-17 | 13F | Wealth Watch Advisors, INC | 0 | -100,00 | 0 | |||||
| 2026-02-06 | 13F | EverSource Wealth Advisors, LLC | 24.850 | -10,82 | 910 | -6,76 | ||||
| 2026-01-20 | 13F | Toth Financial Advisory Corp | 3 | 0,00 | 0 | |||||
| 2026-01-12 | 13F | Heartwood Wealth Advisors LLC | 0 | -100,00 | 0 | -100,00 | ||||
| 2025-09-26 | NP | DIVD - Altrius Global Dividend ETF | 2.865 | 7,67 | 95 | 18,75 | ||||
| 2026-01-29 | 13F | State Of Michigan Retirement System | 223.191 | -0,58 | 8.175 | 3,88 | ||||
| 2026-02-10 | 13F | Monaco Asset Management SAM | 30.000 | 0,00 | 1.099 | 4,47 | ||||
| 2025-09-29 | NP | RPV - Invesco S&P 500 Pure Value ETF This fund is a listed as child fund of Invesco Ltd. and if that institution has disclosed ownership in this security, then these positions will not be double counted when calculating total shares and total value | 204.017 | -2,34 | 6.777 | 6,69 | ||||
| 2026-02-05 | 13F | RiverFront Investment Group, LLC | 5.604 | 205 | ||||||
| 2026-02-10 | 13F | Arcadia Investment Management Corp/mi | 22 | 1 | ||||||
| 2026-02-17 | 13F | Advisor Group Holdings, Inc. | Call | 0 | -100,00 | 0 | ||||
| 2026-02-05 | 13F | Mesirow Financial Investment Management, Inc. | 15.853 | -14,29 | 581 | -10,49 | ||||
| 2025-09-29 | NP | QDPL - Pacer Metaurus US Large Cap Dividend Multiplier 400 ETF | 11.768 | 12,20 | 391 | 22,64 | ||||
| 2026-01-09 | 13F | Teamwork Financial Advisors, LLC | 0 | -100,00 | 0 | |||||
| 2026-01-13 | 13F | Parsons Capital Management Inc/ri | 10.739 | -58,28 | 393 | -56,43 | ||||
| 2026-02-17 | 13F | CHICAGO TRUST Co NA | 0 | -100,00 | 0 | |||||
| 2026-02-10 | 13F | Principia Wealth Advisory, LLC | 61 | -1,61 | 2 | 0,00 | ||||
| 2026-01-28 | 13F | Mowery & Schoenfeld Wealth Management, LLC | 2.600 | 95 | ||||||
| 2026-01-30 | 13F | R Squared Ltd | 0 | -100,00 | 0 | |||||
| 2026-02-11 | 13F | Illinois Municipal Retirement Fund | 168.564 | 5,45 | 6.174 | 10,17 | ||||
| 2025-09-26 | NP | Ultimus Managers Trust - Westwood Salient Enhanced Energy Income ETF | 8.634 | 12,83 | 287 | 23,28 | ||||
| 2026-02-10 | 13F | Commonwealth Of Pennsylvania Public School Empls Retrmt Sys | 145.913 | -4,28 | 5.345 | 0,00 | ||||
| 2026-01-13 | 13F | Stephens Consulting, LLC | 3.000 | 0,00 | 110 | 3,81 | ||||
| 2026-02-17 | 13F | Royal Bank Of Canada | Call | 50.000 | 1.832 | |||||
| 2026-02-17 | 13F | Cape Investment Advisory, Inc. | 179 | 155,71 | 7 | 200,00 | ||||
| 2026-02-18 | 13F | EP Wealth Advisors, Inc. | 27.823 | 7,60 | 1.019 | 23,97 | ||||
| 2025-09-25 | NP | DFQTX - U.s. Core Equity 2 Portfolio - Institutional Class This fund is a listed as child fund of Dimensional Fund Advisors Lp and if that institution has disclosed ownership in this security, then these positions will not be double counted when calculating total shares and total value | 823.997 | 7,67 | 27.373 | 17,62 | ||||
| 2026-01-28 | 13F | U S Global Investors Inc | 0 | -100,00 | 0 | |||||
| 2026-01-28 | 13F | Caliber Wealth Management, LLC / KS | 85.115 | -0,12 | 3.118 | 4,35 | ||||
| 2026-02-12 | 13F | Xponance, Inc. | 85.057 | 3,25 | 3.116 | 7,86 | ||||
| 2025-11-14 | 13F | Point72 (DIFC) Ltd | Put | 11.200 | 12,00 | 393 | 23,27 | |||
| 2026-01-12 | 13F | CVA Family Office, LLC | 1.347 | -2,46 | 49 | 2,08 | ||||
| 2026-01-26 | 13F | Main Street Group, LTD | 0 | -100,00 | 0 | |||||
| 2026-02-13 | 13F | Healthcare Of Ontario Pension Plan Trust Fund | 1.910.965 | 131,60 | 69.999 | 141,96 | ||||
| 2025-11-14 | 13F | Point72 (DIFC) Ltd | Call | 2.000 | -84,38 | 70 | -82,80 | |||
| 2025-10-29 | 13F | Verdence Capital Advisors LLC | 0 | -100,00 | 0 | -100,00 | ||||
| 2026-02-09 | 13F | Smithfield Trust Co | 1.070 | 0,00 | 0 | |||||
| 2026-02-09 | 13F | Atlantic Trust, LLC | 2.798 | -12,26 | 102 | -8,11 | ||||
| 2026-02-17 | 13F | Credit Agricole S A | 222.487 | 9,57 | 8.150 | 14,48 | ||||
| 2026-02-10 | 13F | Godfrey Financial Associates, Inc. | 106 | 4 | ||||||
| 2026-01-14 | 13F | Kaufman Rossin Wealth, LLC | 10.493 | -2,89 | 384 | 1,59 | ||||
| 2026-02-10 | 13F | Bank of New York Mellon Corp | 4.005.657 | 5,65 | 146.727 | 10,38 | ||||
| 2026-02-03 | 13F | RFG Advisory, LLC | 34.204 | -2,48 | 1.253 | 1,87 | ||||
| 2026-02-12 | 13F | Triumph Capital Management | 183 | 3,39 | 7 | 0,00 | ||||
| 2026-01-16 | 13F | Crewe Advisors LLC | 89 | 41,27 | 3 | 50,00 | ||||
| 2026-01-27 | 13F | MASTERINVEST Kapitalanlage GmbH | 24.149 | -2,79 | 889 | 2,18 | ||||
| 2026-02-17 | 13F | Quantinno Capital Management LP | 488.527 | 27,78 | 17.895 | 33,50 | ||||
| 2026-01-28 | 13F | One River Asset Management, LLC | 5.317 | -49,44 | 195 | -47,99 | ||||
| 2026-01-28 | 13F | One River Asset Management, LLC | Put | 42.900 | 0,00 | 1.571 | 4,45 | |||
| 2026-02-17 | 13F | Royal Bank Of Canada | 2.229.704 | 87,37 | 81.675 | 95,76 | ||||
| 2026-02-17 | 13F | Aquatic Capital Management LLC | 0 | -100,00 | 0 | |||||
| 2026-02-23 | 13F | Mv Capital Management, Inc. | 789 | -72,83 | 29 | -69,57 | ||||
| 2026-02-12 | 13F | Swiss National Bank | 1.652.639 | -6,01 | 60.536 | -1,80 | ||||
| 2025-09-17 | NP | GRMAX - Nationwide S&P 500 Index Fund Class A | 19.376 | 0,00 | 644 | 9,17 | ||||
| 2026-01-23 | 13F | Cantor Fitzgerald Investment Adviser L.p. | 284.424 | -4,87 | 10.418 | -0,61 | ||||
| 2026-02-12 | 13F | Trace Wealth Advisors, LLC | 10.200 | 0,00 | 374 | 4,48 | ||||
| 2025-09-24 | NP | SFLNX - Schwab Fundamental US Large Company Index Fund Institutional Shares | 402.528 | 15,73 | 13.372 | 26,42 | ||||
| 2026-02-05 | 13F | Atria Investments Llc | 16.857 | -64,16 | 617 | -62,58 | ||||
| 2026-02-12 | 13F | JPL Wealth Management, LLC | 0 | -100,00 | 0 | |||||
| 2025-11-14 | 13F | Mbb Public Markets I Llc | 0 | -100,00 | 0 | |||||
| 2026-02-05 | 13F | Bessemer Group Inc | 106.339 | 341,61 | 4 | |||||
| 2026-02-06 | 13F | Hudson Valley Investment Advisors Inc /adv | 0 | -100,00 | 0 | |||||
| 2026-02-04 | 13F | Paradigm Asset Management Co Llc | 7.730 | 0,00 | 283 | 4,43 | ||||
| 2025-10-30 | 13F | Traub Capital Management LLC | 0 | -100,00 | 0 | -100,00 | ||||
| 2025-09-26 | NP | BLACKROCK GLOBAL ALLOCATION FUND, INC. - BLACKROCK GLOBAL ALLOCATION FUND, INC. Investor A This fund is a listed as child fund of BlackRock, Inc. and if that institution has disclosed ownership in this security, then these positions will not be double counted when calculating total shares and total value | 14.331 | -80,04 | 476 | -80,56 | ||||
| 2026-02-17 | 13F | Private Advisor Group, LLC | 104.593 | -7,22 | 3.831 | -3,06 | ||||
| 2026-01-21 | 13F | Towarzystwo Funduszy Inwestycyjnych Allianz Polska S.A. | 230 | 8 | ||||||
| 2026-02-17 | 13F | California State Teachers Retirement System | 717.839 | -1,97 | 26.294 | 2,41 | ||||
| 2026-02-17 | 13F | LMR Partners LLP | 0 | -100,00 | 0 | |||||
| 2026-02-17 | 13F | Boothbay Fund Management, Llc | 7.169 | -38,25 | 263 | -35,63 | ||||
| 2026-01-22 | 13F | Financial Consulate, Inc | 282 | 540,91 | 10 | 900,00 | ||||
| 2026-02-04 | 13F | Valeo Financial Advisors, LLC | 10.553 | 14,22 | 387 | 19,50 | ||||
| 2026-02-14 | 13F | Frec Markets, Inc. | 8.949 | 328 | ||||||
| 2026-02-17 | 13F | Optiver Holding B.V. | Put | 1.340.300 | 4.553,82 | 49.095 | 4.765,71 | |||
| 2026-02-20 | 13F | Sunbelt Securities, Inc. | 9.012 | -0,49 | 330 | 4,10 | ||||
| 2026-02-13 | 13F | Neo Ivy Capital Management | 0 | -100,00 | 0 | |||||
| 2026-02-17 | 13F | Optiver Holding B.V. | 44.165 | 1.618 | ||||||
| 2026-02-17 | 13F | Optiver Holding B.V. | Call | 1.066.700 | -5,41 | 39.073 | -1,17 | |||
| 2025-11-07 | 13F | TT Capital Management LLC | 0 | -100,00 | 0 | -100,00 | ||||
| 2026-01-08 | 13F | True Wealth Design, LLC | 5.146 | -11,91 | 188 | -7,84 | ||||
| 2026-03-04 | 13F | Rehmann Capital Advisory Group | 0 | -100,00 | 0 | |||||
| 2025-10-31 | 13F | Symphony Financial, Ltd. Co. | 0 | -100,00 | 0 | -100,00 | ||||
| 2025-11-14 | 13F | G.F.W. Energy XII, L.P. | 0 | -100,00 | 0 | |||||
| 2026-01-15 | 13F | Polianta Ltd | 39.000 | -4,65 | 1 | 0,00 | ||||
| 2026-02-17 | 13F | Bank Of America Corp /de/ | Put | 0 | -100,00 | 0 | ||||
| 2026-02-12 | 13F | Voya Investment Management Llc | 3.090.204 | 61,40 | 113.194 | 68,63 | ||||
| 2026-02-17 | 13F | Banco Bilbao Vizcaya Argentaria, S.a. | 205.702 | -34,59 | 7.516 | -31,80 | ||||
| 2025-11-13 | 13F | Wells Fargo & Company/mn | Call | 0 | -100,00 | 0 | -100,00 | |||
| 2025-09-26 | NP | INVESCO ACTIVELY MANAGED EXCHANGE-TRADED FUND TRUST - Invesco Global Equity Net Zero ETF | 3.695 | 123 | ||||||
| 2025-11-07 | 13F | Sierra Ocean, Llc | 0 | -100,00 | 0 | |||||
| 2026-01-23 | 13F | Steigerwald, Gordon & Koch Inc. | 12 | 0,00 | 0 | |||||
| 2025-09-29 | NP | DUBS - Aptus Large Cap Enhanced Yield ETF | 2.244 | -2,09 | 75 | 7,25 | ||||
| 2026-02-09 | 13F | Legal & General Group Plc | 3.216.122 | -2,15 | 117.807 | 2,23 | ||||
| 2026-01-20 | 13F | Trust Co Of Toledo Na /oh/ | 412 | 0,00 | 15 | 7,14 | ||||
| 2026-02-12 | 13F | IFC & Insurance Marketing, Inc. | 67 | 0 | ||||||
| 2025-09-29 | NP | ACIO - Aptus Collared Income Opportunity ETF | 311.798 | 107,57 | 10.358 | 46,62 | ||||
| 2026-02-18 | 13F | GWM Advisors LLC | 115.235 | 0,95 | 4.221 | 5,50 | ||||
| 2026-01-30 | 13F | State of New Jersey Common Pension Fund D | 194.414 | -2,04 | 7.121 | 2,34 | ||||
| 2026-02-13 | 13F | Ausdal Financial Partners, Inc. | 8.362 | -17,27 | 306 | -13,56 | ||||
| 2026-02-09 | 13F | Frazier Financial Advisors, LLC | 10 | 0,00 | 0 | |||||
| 2026-01-26 | 13F | Quadrant Private Wealth Management, LLC | 6.021 | 221 | ||||||
| 2025-09-29 | NP | ADME - Aptus Drawdown Managed Equity ETF | 34.397 | 37,84 | 1.143 | -2,64 | ||||
| 2026-01-20 | 13F | Independence Bank of Kentucky | 3.162 | 3,03 | 116 | 7,48 | ||||
| 2026-01-16 | 13F | Tema Etfs Llc | 13.249 | -0,27 | 485 | 4,30 | ||||
| 2026-01-27 | 13F | GHP Investment Advisors, Inc. | 328 | 0,61 | 12 | 9,09 | ||||
| 2026-02-06 | 13F | Resona Asset Management Co.,Ltd. | 180.342 | -5,14 | 6.592 | -1,32 | ||||
| 2026-02-12 | 13F | Keel Point, LLC | 8.131 | -7,55 | 298 | -3,57 | ||||
| 2026-02-13 | 13F | Ostrum Asset Management | 4.321 | -24,89 | 158 | -21,39 | ||||
| 2026-01-28 | 13F | Key Client Fiduciary Advisors, LLC | 8.005 | -6,12 | 293 | -1,68 | ||||
| 2026-02-11 | 13F | West Family Investments, Inc. | 5.718 | -47,97 | 209 | 122,34 | ||||
| 2026-02-13 | 13F | Bridgewater Associates, LP | 1.170.881 | 19,56 | 42.889 | 24,92 | ||||
| 2026-01-12 | 13F | Robinson Value Management, Ltd. | 79.579 | 2.915 | ||||||
| 2026-02-11 | 13F | Allianz Asset Management GmbH | 1.322.281 | 58,71 | 48.435 | 65,82 | ||||
| 2026-01-13 | 13F | Adamsbrown Wealth Consultants Llc | 6.765 | 3,76 | 248 | 8,33 | ||||
| 2026-02-10 | 13F | Fideuram Asset Management (Ireland) dac | 7.268 | 263 | ||||||
| 2026-01-15 | 13F | Royal Fund Management, LLC | Call | 12 | -7,69 | 0 | ||||
| 2026-01-15 | 13F | Royal Fund Management, LLC | 70.953 | 25,85 | 2.599 | 31,53 | ||||
| 2026-02-11 | 13F | Group One Trading, L.p. | Put | 374.300 | -10,05 | 13.711 | -6,02 | |||
| 2026-01-20 | 13F | Global Trust Asset Management, LLC | 0 | -100,00 | 0 | -100,00 | ||||
| 2026-02-11 | 13F | Group One Trading, L.p. | 55.931 | -62,18 | 2.049 | -60,50 | ||||
| 2026-02-12 | 13F | M&G Plc | 142.135 | -7,18 | 5.259 | -1,88 | ||||
| 2026-02-11 | 13F | Group One Trading, L.p. | Call | 326.000 | 4,62 | 11.941 | 9,31 | |||
| 2026-02-02 | 13F | Danske Bank A/s | 93.821 | -9,43 | 3.437 | -5,37 | ||||
| 2026-02-10 | 13F | Argent Trust Co | 70.088 | -2,40 | 2.567 | 1,99 | ||||
| 2025-09-29 | NP | CATH - Global X S&P 500 Catholic Values ETF This fund is a listed as child fund of Mirae Asset Global Investments Co., Ltd. and if that institution has disclosed ownership in this security, then these positions will not be double counted when calculating total shares and total value | 11.765 | -4,04 | 391 | 4,84 | ||||
| 2026-02-10 | 13F | Westpac Banking Corp | 7.485 | -74,02 | 274 | -72,87 | ||||
| 2026-02-10 | 13F | Lido Advisors, LLC | 12.838 | 4,67 | 454 | 5,58 | ||||
| 2026-02-12 | 13F | SWAN Capital LLC | 358 | 0,00 | 13 | 8,33 | ||||
| 2026-02-10 | 13F | Peapack Gladstone Financial Corp | 146.302 | -3,08 | 5 | 0,00 | ||||
| 2025-11-07 | 13F | Beacon Capital Management, LLC | 0 | -100,00 | 0 | |||||
| 2026-01-15 | 13F | Fifth Third Wealth Advisors LLC | 5.867 | -7,84 | 215 | -4,04 | ||||
| 2026-02-17 | 13F | Kimmeridge Energy Management Company, LLC | 8.850.790 | 56,51 | 324.204 | 63,52 | ||||
| 2026-01-28 | 13F | Eliot Finkel Investment Counsel, LLC | 132.150 | -1,19 | 4.841 | 3,24 | ||||
| 2026-01-07 | 13F | Retirement Wealth Solutions LLC | 13 | -50,00 | 0 | |||||
| 2026-02-09 | 13F | Hartland & Co., LLC | 30.729 | -12,71 | 1.126 | -8,83 | ||||
| 2026-02-10 | 13F | Natixis Advisors, L.p. | 144.320 | -12,53 | 5 | 0,00 | ||||
| 2026-02-17 | 13F | Public Employees Retirement System Of Ohio | 205.866 | 5,97 | 7.541 | 10,70 | ||||
| 2026-01-26 | 13F | Parcion Private Wealth LLC | 8.139 | 9,65 | 298 | 14,62 | ||||
| 2026-02-11 | 13F | Deseret Mutual Benefit Administrators | 2.561 | 8,01 | 94 | 12,05 | ||||
| 2026-02-13 | 13F | Umb Bank N A/mo | 4.721 | -23,22 | 173 | -20,00 | ||||
| 2025-09-25 | NP | TCAAX - Thrivent Moderately Conservative Allocation Fund Class A | 5.041 | 45,11 | 167 | 59,05 | ||||
| 2026-02-09 | 13F | Fidelis Capital Partners, LLC | 6.109 | 6,45 | 224 | 10,95 | ||||
| 2026-02-11 | 13F | Investors Towarzystwo Funduszy Inwestycyjnych Spolka Akcyjna | 642 | 24 | ||||||
| 2026-02-26 | 13F | Anchor Investment Management, LLC | 1.968 | 0,00 | 72 | 5,88 | ||||
| 2026-02-04 | 13F | Fourth Dimension Wealth, LLC | 76 | -75,32 | 3 | -80,00 | ||||
| 2026-02-09 | 13F | Cary Street Partners Financial Llc | 200.268 | -1,28 | 7.336 | 3,14 | ||||
| 2026-01-14 | 13F | Mb, Levis & Associates, Llc | 351 | 0,29 | 13 | 0,00 | ||||
| 2026-01-26 | 13F | Valmark Advisers, Inc. | 5.783 | 212 | ||||||
| 2026-01-29 | 13F | Teachers Retirement System Of The State Of Kentucky | 51.432 | 0,00 | 2 | 0,00 | ||||
| 2026-02-17 | 13F | Boreal Capital Management LLC | 108 | 0,00 | 4 | 0,00 | ||||
| 2025-09-25 | NP | JNBAX - JPMorgan Income Builder Fund Class A | 95.607 | -5,22 | 3.176 | 3,55 | ||||
| 2025-09-29 | NP | XTR - Global X S&P 500 Tail Risk ETF This fund is a listed as child fund of Mirae Asset Global Investments Co., Ltd. and if that institution has disclosed ownership in this security, then these positions will not be double counted when calculating total shares and total value | 25 | 0,00 | 1 | |||||
| 2026-01-21 | 13F | Aaron Wealth Advisors LLC | 7.719 | 5,47 | 283 | 10,16 | ||||
| 2026-02-13 | 13F | Sofos Investments, Inc. | 0 | -100,00 | 0 | |||||
| 2026-01-23 | 13F | Patton Fund Management, Inc. | 6.691 | 245 | ||||||
| 2026-02-12 | 13F | Rowland & Co Investment Counsel/adv | 0 | -100,00 | 0 | |||||
| 2026-01-15 | 13F | Westend Capital Management LLC | 168 | 0,00 | 6 | 20,00 | ||||
| 2026-01-12 | 13F | M.e. Allison & Co., Inc. | 0 | -100,00 | 0 | |||||
| 2026-01-28 | 13F | DekaBank Deutsche Girozentrale | 214.315 | 0,00 | 12 | 71,43 | ||||
| 2026-02-17 | 13F | Bank Of America Corp /de/ | Call | 0 | -100,00 | 0 | ||||
| 2026-02-02 | 13F | Hussman Strategic Advisors, Inc. | 42.000 | 1.538 | ||||||
| 2025-09-26 | NP | USSPX - 500 Index Fund -Member Shares | 148.971 | -1,90 | 4.949 | 7,17 | ||||
| 2026-01-14 | 13F | Wolff Wiese Magana Llc | 314 | 0,00 | 12 | 0,00 | ||||
| 2025-11-14 | 13F | Virtu Financial LLC | 0 | -100,00 | 0 | |||||
| 2025-09-26 | NP | REAYX - Equity Income Fund Class Y | 8.006 | 0,00 | 266 | 9,05 | ||||
| 2026-02-13 | 13F | Missouri Trust & Investment Co | 100 | 0,00 | 4 | 0,00 | ||||
| 2025-11-13 | 13F | Texas Capital Bancshares Inc/tx | 52 | 2 | ||||||
| 2026-02-11 | 13F | Aspetuck Financial Management LLC | 16.314 | -0,31 | 598 | 4,19 | ||||
| 2025-09-26 | NP | SPGP - Invesco S&P 500 GARP ETF This fund is a listed as child fund of Invesco Ltd. and if that institution has disclosed ownership in this security, then these positions will not be double counted when calculating total shares and total value | 0 | -100,00 | 0 | -100,00 | ||||
| 2026-02-03 | 13F | Farmers & Merchants Investments Inc | 2.752 | 0,00 | 101 | 4,17 | ||||
| 2026-02-13 | 13F | Financial Sense Advisors, Inc. | 77.000 | 93,80 | 2.821 | 102,44 | ||||
| 2026-02-10 | 13F | Envestnet Asset Management Inc | 91.676 | -37,12 | 3.358 | -34,30 | ||||
| 2026-01-29 | 13F | Wealth Alliance Advisory Group, LLC | 15.416 | 0,03 | 565 | 4,44 | ||||
| 2026-01-16 | 13F | Standard Life Aberdeen plc | 358.897 | 35,77 | 13.146 | 40,01 | ||||
| 2025-09-25 | NP | DFAU - Dimensional US Core Equity Market ETF | 124.574 | 0,39 | 4.138 | 9,67 | ||||
| 2025-09-26 | NP | RGEAX - Global Equity Fund Class A | 9.096 | 0,00 | 302 | 9,42 | ||||
| 2026-02-17 | 13F | Ancora Advisors, LLC | 389 | 14 | ||||||
| 2026-01-13 | 13F | Norden Group Llc | 5.947 | 218 | ||||||
| 2026-01-28 | 13F | Barrett & Company, Inc. | 40 | 0,00 | 1 | 0,00 | ||||
| 2026-02-13 | 13F | Dixon Mitchell Investment Counsel Inc. | 3.027 | 111 | ||||||
| 2026-01-26 | 13F | Greenwood Capital Associates Llc | 88.871 | 3.255 | ||||||
| 2025-09-24 | NP | SWLVX - Schwab U.S. Large-Cap Value Index Fund This fund is a listed as child fund of Charles Schwab Investment Management Inc and if that institution has disclosed ownership in this security, then these positions will not be double counted when calculating total shares and total value | 19.084 | -4,74 | 634 | 3,94 | ||||
| 2026-02-13 | 13F | Adams Natural Resources Fund, Inc. | 299.200 | -0,07 | 10.960 | 4,41 | ||||
| 2026-02-10 | 13F | DT Investment Partners, LLC | 450 | 0,00 | 16 | 6,67 | ||||
| 2026-02-17 | 13F | Kemnay Advisory Services Inc. | 3.601 | 132 | ||||||
| 2025-09-26 | NP | SMRI - Bushido Capital US Equity ETF | 268.372 | 17,83 | 8.915 | 28,72 | ||||
| 2026-02-17 | 13F | Blair William & Co/il | 499.650 | 18,85 | 18.302 | 24,17 | ||||
| 2026-01-12 | 13F | Lvm Capital Management Ltd/mi | 13.445 | 0 | ||||||
| 2026-01-12 | 13F | Abound Wealth Management | 76 | 0,00 | 3 | 0,00 | ||||
| 2026-02-17 | 13F | Laird Norton Trust Company, Llc | 43.879 | 1.607 | ||||||
| 2026-02-17 | 13F | Alliancebernstein L.p. | 796.504 | -4,45 | 29.176 | -0,17 | ||||
| 2026-02-12 | 13F | McMillan Office, Inc. | 22 | 1 | ||||||
| 2026-02-17 | 13F | ExodusPoint Capital Management, LP | 0 | -100,00 | 0 | -100,00 | ||||
| 2025-09-29 | NP | CFMCX - Column Mid Cap Fund | 15.492 | 0,00 | 559 | 19,44 | ||||
| 2026-01-27 | 13F | Forum Financial Management, LP | 16.924 | 6,90 | 620 | 11,53 | ||||
| 2026-02-05 | 13F | Center for Financial Planning, Inc. | 1.416 | -31,46 | 52 | -29,17 | ||||
| 2026-02-17 | 13F | Lighthouse Investment Partners, LLC | 0 | -100,00 | 0 | |||||
| 2026-02-03 | 13F | Cheviot Value Management, LLC | 25.431 | -13,20 | 1.013 | 8,00 | ||||
| 2026-02-17 | 13F | Quantitative Investment Management, LLC | 57.033 | 420,09 | 2 | |||||
| 2026-02-13 | 13F | Rafferty Asset Management, LLC | 242.275 | -9,17 | 8.875 | -5,10 | ||||
| 2026-02-09 | 13F | Wellington Shields Capital Management, LLC | 3.928 | 0,00 | 144 | 4,38 | ||||
| 2025-10-24 | 13F | Opal Wealth Advisors, LLC | 0 | -100,00 | 0 | |||||
| 2025-12-09 | 13F | Painted Porch Advisors LLC | 100 | 0,00 | 4 | 0,00 | ||||
| 2025-09-26 | NP | HAMVX - Harbor Mid Cap Value Fund Institutional Class | 33.200 | 0,00 | 1.103 | 9,22 | ||||
| 2026-02-02 | 13F | Mutual Advisors, LLC | 8.379 | -3,31 | 307 | 5,88 | ||||
| 2025-11-14 | 13F | Kamunting Street Capital Management, L.P. | 0 | -100,00 | 0 | |||||
| 2026-02-13 | 13F | Bollard Group LLC | 6.282 | -15,63 | 0 | |||||
| 2026-02-12 | 13F | Advocate Investing Services LLC | 15 | 1 | ||||||
| 2026-01-21 | 13F | MBL Wealth, LLC | 7.852 | 288 | ||||||
| 2026-02-13 | 13F | Pathstone Holdings, LLC | 265.086 | 15,64 | 9.710 | 20,82 | ||||
| 2026-02-11 | 13F | Los Angeles Capital Management Llc | 2.699 | 86 | ||||||
| 2026-02-02 | 13F | Strs Ohio | 497.698 | -0,03 | 18.231 | 4,44 | ||||
| 2026-02-11 | 13F | Inceptionr Llc | 17.483 | 640 | ||||||
| 2026-02-17 | 13F | Mirabella Financial Services Llp | 13.350 | 489 | ||||||
| 2026-02-17 | 13F | Qube Research & Technologies Ltd | 1.216.402 | 61,31 | 44.557 | 68,53 | ||||
| 2025-09-26 | NP | IMCB - iShares Morningstar Mid-Cap ETF | 60.113 | -2,05 | 1.997 | 6,97 | ||||
| 2026-01-15 | 13F | Capital Advisors Inc/ok | 23.708 | -4,81 | 868 | -0,57 | ||||
| 2026-01-20 | 13F | Savvy Advisors, Inc. | 15.339 | -17,72 | 562 | -14,09 | ||||
| 2026-02-12 | 13F | Dimensional Fund Advisors Lp | 9.370.570 | 0,19 | 343.252 | 4,67 | ||||
| 2026-02-13 | 13F | Y-Intercept (Hong Kong) Ltd | 187.753 | -33,00 | 6.877 | -30,01 | ||||
| 2026-01-09 | 13F | Dynamic Advisor Solutions LLC | 8.261 | -14,14 | 303 | -10,39 | ||||
| 2026-02-13 | 13F | Chevy Chase Trust Holdings, Inc. | 318.090 | -1,88 | 11.652 | 2,52 | ||||
| 2026-02-17 | 13F | Qube Research & Technologies Ltd | Put | 197.000 | -52,95 | 7.216 | -50,84 | |||
| 2026-02-17 | 13F | Qube Research & Technologies Ltd | Call | 133.900 | -71,24 | 4.905 | -69,95 | |||
| 2026-01-26 | 13F | Grace & White Inc /ny | 92.436 | -1,28 | 3.386 | 3,14 | ||||
| 2026-01-08 | 13F | Adirondack Trust Co | 139 | -70,04 | 5 | -68,75 | ||||
| 2026-02-20 | 13F | White Knight Strategic Wealth Advisors, LLC | 18.742 | -5,38 | 687 | -1,15 | ||||
| 2025-09-24 | NP | ACWI - iShares MSCI ACWI ETF | 159.052 | -2,35 | 5.284 | 6,66 | ||||
| 2026-02-27 | 13F | Strategic Investment Solutions, Inc. /IL | 100 | 0,00 | 4 | 0,00 | ||||
| 2026-02-10 | 13F | CIBC World Markets Inc. | 857.482 | 40,85 | 31.410 | 47,16 | ||||
| 2026-01-05 | 13F | Catherine Avery Investment Management LLC | 0 | -100,00 | 0 | -100,00 | ||||
| 2025-09-25 | NP | TAAAX - Thrivent Aggressive Allocation Fund Class A | 117.688 | 4,51 | 3.910 | 14,16 | ||||
| 2026-01-30 | 13F/A | M&t Bank Corp | 26.414 | 44,30 | 967 | 50,62 | ||||
| 2026-02-17 | 13F | Amundi | 2.415.209 | 0,32 | 88.469 | 5,26 | ||||
| 2026-02-12 | 13F | Callan Family Office, LLC | 19.298 | 6,07 | 707 | 10,83 | ||||
| 2025-10-16 | 13F | Signature Resources Capital Management, LLC | 0 | -100,00 | 0 | |||||
| 2026-01-15 | 13F | SILVER OAK SECURITIES, Inc | 25.907 | 5,57 | 954 | 10,81 | ||||
| 2026-02-12 | 13F | Rossby Financial, LCC | 116 | 0,00 | 4 | 0,00 | ||||
| 2026-01-22 | 13F | Cliftonlarsonallen Wealth Advisors, Llc | 99.231 | 0,00 | 3.635 | 4,46 | ||||
| 2026-02-13 | 13F | Jacobs Levy Equity Management, Inc | 740.604 | 4,84 | 27.128 | 9,54 | ||||
| 2026-02-04 | 13F | Centric Wealth Management | 37.781 | 1.517 | ||||||
| 2026-01-23 | 13F | Gilliland Jeter Wealth Management LLC | 12.284 | -9,72 | 450 | -5,87 | ||||
| 2025-10-23 | 13F | Caldwell Trust Co | 0 | -100,00 | 0 | -100,00 | ||||
| 2026-01-26 | 13F | KBC Group NV | 77.287 | 0,00 | 3 | 0,00 | ||||
| 2025-09-25 | NP | AAUTX - Thrivent Large Cap Value Fund Class A | 584.882 | 0,95 | 19.430 | 10,27 | ||||
| 2026-02-10 | 13F | Ritter Daniher Financial Advisory LLC / DE | 93 | 3 | ||||||
| 2025-10-21 | 13F | Radnor Capital Management, LLC | 0 | -100,00 | 0 | |||||
| 2025-09-29 | NP | XRMI - Global X S&P 500 Risk Managed Income ETF This fund is a listed as child fund of Mirae Asset Global Investments Co., Ltd. and if that institution has disclosed ownership in this security, then these positions will not be double counted when calculating total shares and total value | 489 | -25,68 | 16 | -20,00 | ||||
| 2025-10-20 | 13F | Kieckhefer Group Llc | 0 | -100,00 | 0 | |||||
| 2026-01-28 | 13F | Davis Capital Management | 6 | -14,29 | 0 | |||||
| 2026-02-10 | 13F | Daiwa Securities Group Inc. | 151.015 | -2,26 | 6 | 0,00 | ||||
| 2026-03-06 | 13F | Hsbc Holdings Plc | 2.081.059 | -25,58 | 76.207 | -22,05 | ||||
| 2026-02-11 | 13F | Winnow Wealth Llc | 9 | 0,00 | 0 | |||||
| 2025-09-25 | NP | TMAAX - Thrivent Moderately Aggressive Allocation Fund Class A | 91.682 | 24,28 | 3.046 | 35,76 | ||||
| 2026-02-12 | 13F | Jane Street Group, Llc | Call | 1.312.000 | 69,29 | 48.059 | 76,87 | |||
| 2026-02-12 | 13F | Jane Street Group, Llc | 72.885 | -89,32 | 2.670 | -88,85 | ||||
| 2026-02-13 | 13F | Quinn Opportunity Partners LLC | 20.000 | 0,00 | 733 | 4,42 | ||||
| 2026-01-22 | 13F | Foundation Resource Management Inc | 127.827 | 5,09 | 4.682 | 9,80 | ||||
| 2026-02-12 | 13F | Jane Street Group, Llc | Put | 878.400 | -15,14 | 32.176 | -11,34 | |||
| 2026-03-02 | 13F | Tobam | 1.633 | 16,39 | 0 | |||||
| 2025-09-24 | NP | IMRFX - Columbia Global Opportunities Fund Class A | 0 | -100,00 | 0 | -100,00 | ||||
| 2026-02-17 | 13F | Sovereign's Capital Management, LLC | 13.289 | -65,99 | 487 | -64,50 | ||||
| 2025-09-25 | NP | DXUV - Dimensional US Vector Equity ETF | 9.081 | 22,14 | 302 | 33,19 | ||||
| 2026-02-05 | 13F | Convergence Investment Partners, LLC | 23.867 | 874 | ||||||
| 2026-02-10 | 13F | Basepoint Wealth LLC | 1.490 | 55 | ||||||
| 2026-02-12 | 13F | Penserra Capital Management LLC | 54 | -99,62 | 0 | |||||
| 2026-02-12 | 13F | StoneX Group Inc. | 0 | -100,00 | 0 | |||||
| 2026-02-17 | 13F | EnCap Energy Capital Fund XI, L.P. | 11.806.148 | 0,00 | 432.459 | 4,48 | ||||
| 2026-01-26 | 13F | PDS Planning, Inc | 5.745 | 0,17 | 210 | 4,48 | ||||
| 2026-01-27 | 13F | Gf Fund Management Co. Ltd. | 176.794 | 1,51 | 6.476 | 6,04 | ||||
| 2026-02-03 | 13F | Ballentine Partners, LLC | 10.754 | 5,58 | 394 | 10,08 | ||||
| 2026-02-17 | 13F | Point72 Asset Management, L.P. | Put | 174.900 | 361,48 | 6.407 | 382,38 | |||
| 2026-01-20 | 13F | RPG Investment Advisory, LLC | 284.705 | -0,84 | 10.429 | 3,64 | ||||
| 2026-02-10 | 13F | Private Wealth Asset Management, LLC | 8 | 0,00 | 0 | |||||
| 2026-02-17 | 13F | Point72 Asset Management, L.P. | Call | 492.100 | 397,57 | 18.026 | 419,90 | |||
| 2026-02-12 | 13F | Brinker Capital Investments, LLC | 57.577 | 1,48 | 2.109 | 6,03 | ||||
| 2026-01-21 | 13F | Newbridge Financial Services Group, Inc. | 2.933 | 44,63 | 107 | 50,70 | ||||
| 2026-02-11 | 13F | Hilton Head Capital Partners, LLC | 549 | 20 | ||||||
| 2026-01-27 | 13F | Evergreen Capital Management Llc | 11.368 | 76,17 | 416 | 84,07 | ||||
| 2025-11-13 | 13F | Total Investment Management Inc | 0 | -100,00 | 0 | |||||
| 2026-02-13 | 13F | Financial Sense Advisors, Inc. | Call | 0 | -100,00 | 0 | -100,00 | |||
| 2026-02-11 | 13F | Mirae Asset Securities (usa) Inc. | 63.650 | 2.332 | ||||||
| 2026-01-22 | 13F | Venturi Wealth Management, LLC | 5.367 | -20,75 | 197 | -17,30 | ||||
| 2026-02-17 | 13F | Susquehanna Fundamental Investments, Llc | 0 | -100,00 | 0 | |||||
| 2026-02-05 | 13F | Navalign, LLC | 100 | 4 | ||||||
| 2026-02-10 | 13F | GKV Capital Management Co., Inc. | 10.000 | 0,00 | 366 | 4,57 | ||||
| 2026-02-13 | 13F | Visionary Wealth Advisors | 7.637 | -0,18 | 280 | 4,10 | ||||
| 2026-02-05 | 13F | Amalgamated Bank | 133.450 | 11,43 | 5 | 0,00 | ||||
| 2026-01-26 | 13F | Whittier Trust Co Of Nevada Inc | 4.009 | 41,21 | 144 | 45,92 | ||||
| 2026-02-17 | 13F | Peconic Partners Llc | 300.000 | 10.989 | ||||||
| 2025-09-25 | NP | JVAL - JPMorgan U.S. Value Factor ETF | 19.930 | -4,13 | 662 | 4,75 | ||||
| 2026-02-09 | 13F | Hantz Financial Services, Inc. | 10.950 | 200,58 | 0 | |||||
| 2025-09-24 | NP | SWPPX - Schwab S&P 500 Index Fund This fund is a listed as child fund of Charles Schwab Investment Management Inc and if that institution has disclosed ownership in this security, then these positions will not be double counted when calculating total shares and total value | 1.430.017 | -2,12 | 47.505 | 6,93 | ||||
| 2026-01-05 | 13F | GAMMA Investing LLC | 30.272 | 4,03 | 1.109 | 8,63 | ||||
| 2026-02-17 | 13F | SageView Advisory Group, LLC | 1.566 | 57 | ||||||
| 2025-09-29 | NP | PBP - Invesco S&P 500 BuyWrite ETF This fund is a listed as child fund of Invesco Ltd. and if that institution has disclosed ownership in this security, then these positions will not be double counted when calculating total shares and total value | 3.428 | 73,22 | 114 | 88,33 | ||||
| 2026-02-17 | 13F | PDT Partners, LLC | 0 | -100,00 | 0 | |||||
| 2026-02-17 | 13F | Aventail Capital Group, LP | 985.035 | 80,82 | 36.082 | 88,92 | ||||
| 2026-01-30 | 13F | Ktf Investments, Llc | 7.000 | 256 | ||||||
| 2026-02-17 | 13F | Limestone Investment Advisors LP | Call | 0 | -100,00 | 0 | -100,00 | |||
| 2026-02-17 | 13F | Limestone Investment Advisors LP | Put | 0 | -100,00 | 0 | -100,00 | |||
| 2025-09-29 | NP | GUSH - Direxion Daily S&P Oil & Gas Exp. & Prod. Bull 3X Shares Direxion Daily S&P Oil & Gas Exp. & Prod. Bull 3X Shares | 146.722 | 15,65 | 4.874 | 26,33 | ||||
| 2026-02-12 | 13F | Marex Group plc | 7.602 | -48,72 | 278 | -46,44 | ||||
| 2026-02-11 | 13F | Parallel Advisors, LLC | 16.285 | 21,67 | 597 | 27,08 | ||||
| 2026-01-26 | 13F | Private Trust Co Na | 2.423 | 4,89 | 89 | 10,00 | ||||
| 2025-10-14 | 13F | Livelsberger Financial Advisory | 0 | -100,00 | 0 | |||||
| 2025-09-25 | NP | THMAX - Thrivent Moderate Allocation Fund Class A | 68.139 | 10,42 | 2.264 | 20,63 | ||||
| 2026-01-14 | 13F | Woodstock Corp | 13.387 | 0,00 | 490 | 4,48 | ||||
| 2026-01-29 | 13F | Quent Capital, LLC | 4.530 | -3,37 | 166 | 0,61 | ||||
| 2026-01-28 | 13F | Arizona State Retirement System | 165.275 | -8,02 | 6.054 | -3,90 | ||||
| 2026-02-11 | 13F | Vise Technologies, Inc. | 20.916 | 29,57 | 766 | 35,58 | ||||
| 2026-01-30 | 13F | Four Tree Island Advisory LLC | 9.965 | 0,00 | 365 | 4,58 | ||||
| 2026-02-02 | 13F | Sachetta, LLC | 323 | 3,19 | 12 | 10,00 | ||||
| 2026-02-13 | 13F | Pin Oak Investment Advisors Inc | 3.723 | -39,41 | 0 | -100,00 | ||||
| 2025-09-25 | NP | JFLI - JPMorgan Flexible Income ETF | 741 | 6,62 | 25 | 14,29 | ||||
| 2025-11-12 | 13F | Mengis Capital Management, Inc. | 0 | -100,00 | 0 | |||||
| 2026-02-17 | 13F | Hilltop Holdings Inc. | 16.194 | -5,18 | 593 | -0,84 | ||||
| 2026-01-23 | 13F | Bridgewater Advisors Inc. | 9.362 | 11,25 | 353 | 29,78 | ||||
| 2026-02-10 | 13F | Connor, Clark & Lunn Investment Management Ltd. | 54.258 | 1.987 | ||||||
| 2026-02-17 | 13F | Tortoise Capital Advisors, L.l.c. | 140.604 | -37,25 | 5.150 | -34,45 | ||||
| 2026-02-09 | 13F | MQS Management LLC | 0 | -100,00 | 0 | |||||
| 2026-02-17 | 13F | Jones Financial Companies Lllp | 49.863 | -20,30 | 1.826 | -21,05 | ||||
| 2026-01-27 | 13F | Friedenthal Financial | 174 | 13,73 | 6 | 20,00 | ||||
| 2025-09-26 | NP | ETTOX - E*TRADE No Fee Total Market Index Fund | 276 | 55,06 | 9 | 80,00 | ||||
| 2026-01-29 | 13F | Nbc Securities, Inc. | Call | 0 | -100,00 | 0 | ||||
| 2026-02-12 | 13F | Great Lakes Retirement, Inc. | 486.895 | 1,60 | 17.835 | 6,15 | ||||
| 2026-01-16 | 13F | Trust Co Of Vermont | 942 | 0,00 | 35 | 3,03 | ||||
| 2026-02-13 | 13F | Royal London Asset Management Ltd | 277.996 | -4,72 | 10.183 | -0,46 | ||||
| 2026-01-06 | 13F | Canal Capital Management, LLC | 177.216 | 3,42 | 6.491 | 8,06 | ||||
| 2026-02-11 | 13F | Rise Advisors, LLC | 0 | -100,00 | 0 | |||||
| 2026-02-23 | 13F | Beaird Harris Wealth Management, LLC | 1.473 | 0,00 | 54 | 3,92 | ||||
| 2026-02-02 | 13F | Principal Financial Group Inc | 712.346 | 1,69 | 26.093 | 6,25 | ||||
| 2026-02-09 | 13F | Kingsview Wealth Management, LLC | 21.062 | 18,39 | 771 | 23,76 | ||||
| 2026-01-20 | 13F | Accel Wealth Management | 8.228 | -22,49 | 301 | -19,09 | ||||
| 2025-11-14 | 13F | Full Sail Capital, LLC | 32.179 | -1,29 | 1.128 | 8,88 | ||||
| 2026-01-30 | 13F | Torren Management, LLC | 1.324 | 49 | ||||||
| 2026-01-12 | 13F | DAVENPORT & Co LLC | 26.043 | -9,90 | 954 | -5,92 | ||||
| 2026-01-26 | 13F | Independent Wealth Network Inc. | 8.881 | 1,29 | 325 | 5,86 | ||||
| 2026-02-05 | 13F | Canada Post Corp Registered Pension Plan | 20.008 | -52,76 | 733 | -53,82 | ||||
| 2026-02-09 | 13F | Keating Financial Advisory Services, Inc. | 390 | 14 | ||||||
| 2026-02-17 | 13F | Second Line Capital, LLC | 6.696 | 3,08 | 245 | 7,93 | ||||
| 2025-11-14 | 13F | WNY Asset Management, LLC | 25.918 | -0,62 | 909 | 9,53 | ||||
| 2026-01-27 | 13F | CenterStar Asset Management, LLC | Put | 37.000 | 1.355 | |||||
| 2026-01-30 | 13F | Wealthfront Advisers Llc | 248.083 | -1,51 | 9.087 | 2,90 | ||||
| 2025-11-14 | 13F | Eqis Capital Management, Inc. | 0 | -100,00 | 0 | |||||
| 2026-01-15 | 13F | Fortitude Family Office, LLC | 185 | 43,41 | 7 | 50,00 | ||||
| 2025-11-14 | 13F | Cornerstone Select Advisors, LLC | 0 | -100,00 | 0 | |||||
| 2026-01-28 | 13F | B. Metzler seel. Sohn & Co. AG | 21.900 | 0,00 | 802 | 4,56 | ||||
| 2026-01-16 | 13F | Mattern Wealth Management LLC | 5.992 | 0,00 | 219 | 4,29 | ||||
| 2026-01-30 | 13F | Caldwell Securities, Inc | 1.170 | -16,73 | 43 | -14,29 | ||||
| 2026-02-12 | 13F | Gagnon Securities Llc | 19.111 | -5,76 | 700 | -1,41 | ||||
| 2025-11-06 | 13F | Abich Financial Wealth Management LLC | 0 | -100,00 | 0 | -100,00 | ||||
| 2026-02-17 | 13F | NorthRock Partners, LLC | 0 | -100,00 | 0 | |||||
| 2026-01-29 | 13F | Pictet Asset Management Holding SA | 242.433 | -2,15 | 8.880 | 2,23 | ||||
| 2026-01-29 | 13F | Comerica Bank | 183.676 | 14,29 | 6.728 | 19,42 | ||||
| 2025-10-17 | 13F | Slocum, Gordon & Co LLP | 0 | -100,00 | 0 | -100,00 | ||||
| 2026-02-09 | 13F | Bleakley Financial Group, LLC | 20.327 | 15,30 | 745 | 20,39 | ||||
| 2026-01-23 | 13F | Avion Wealth | 7.661 | 0,49 | 0 | |||||
| 2026-02-13 | 13F | QTR Family Wealth, LLC | 0 | -100,00 | 0 | |||||
| 2026-01-29 | 13F | Concurrent Investment Advisors, LLC | 130.591 | 61,11 | 4.784 | 68,36 | ||||
| 2026-01-07 | 13F | Corsicana & Co. | 215 | 0,00 | 8 | 0,00 | ||||
| 2026-01-16 | 13F | FNY Investment Advisers, LLC | 500 | -26,69 | 0 | |||||
| 2026-02-13 | 13F | Arkadios Wealth Advisors | 118.115 | 6,69 | 4.327 | 11,47 | ||||
| 2026-02-17 | 13F | Investment Management Corp of Ontario | 51.247 | 79,05 | 1.877 | 87,14 | ||||
| 2026-02-05 | 13F | Gabelli Funds Llc | 309.000 | 0,00 | 11.319 | 4,48 | ||||
| 2025-09-26 | NP | SUNAMERICA SERIES TRUST - SA Large Cap Value Index Portfolio Class 1 | 17.089 | -1,05 | 568 | 8,00 | ||||
| 2026-02-05 | 13F | Qsemble Capital Management, LP | 26.542 | -89,78 | 972 | -89,32 | ||||
| 2026-02-12 | 13F | Sprott Inc. | 19.439 | 203,73 | 712 | 217,86 | ||||
| 2026-01-12 | 13F | Seacrest Wealth Management, Llc | 11.201 | 0,21 | 386 | -1,03 | ||||
| 2026-02-17 | 13F | Rakuten Investment Management, Inc. | 81.495 | 532,48 | 2.948 | 232,73 | ||||
| 2026-02-11 | 13F | Cedar Mountain Advisors, LLC | 94 | 0,00 | 3 | 0,00 | ||||
| 2026-02-12 | 13F | Johnson Financial Group, Inc. | 27.451 | 18,96 | 1.006 | 24,23 | ||||
| 2026-02-17 | 13F | Wellington Management Group Llp | 0 | -100,00 | 0 | |||||
| 2026-01-16 | 13F | Perigon Wealth Management, LLC | 11.792 | -16,01 | 432 | -12,40 | ||||
| 2026-02-13 | 13F | Cozad Asset Management Inc | 61.945 | 9,32 | 2.269 | 14,25 | ||||
| 2026-02-02 | 13F | Horizon Investments, LLC | 84.858 | 10,33 | 3.108 | 15,28 | ||||
| 2026-02-11 | 13F | CNB Bank | 3.800 | -24,00 | 139 | -20,57 | ||||
| 2026-01-12 | 13F | Byrne Asset Management LLC | 0 | -100,00 | 0 | |||||
| 2025-09-24 | NP | EIVPX - Parametric Volatility Risk Premium - Defensive Fund Institutional Class | 19.416 | -48,27 | 645 | -43,56 | ||||
| 2025-09-25 | NP | DFLV - Dimensional US Large Cap Value ETF | 200.992 | 0,00 | 6.677 | 9,23 | ||||
| 2026-01-30 | 13F | Wealth Forward, LLC | 7.007 | -4,80 | 257 | -0,78 | ||||
| 2026-02-11 | 13F | Winton Capital Group Ltd | 754.273 | 15,81 | 27.629 | 21,00 | ||||
| 2025-09-26 | NP | FZROX - Fidelity ZERO Total Market Index Fund This fund is a listed as child fund of Fmr Llc and if that institution has disclosed ownership in this security, then these positions will not be double counted when calculating total shares and total value | 300.987 | 0,16 | 9.999 | 9,41 | ||||
| 2026-02-10 | 13F | Acadian Asset Management Llc | 0 | -100,00 | 0 | |||||
| 2026-02-06 | 13F | Trajan Wealth LLC | 6.446 | -7,46 | 236 | -3,28 | ||||
| 2026-01-29 | 13F | IMC-Chicago, LLC | 0 | -100,00 | 0 | -100,00 | ||||
| 2026-01-30 | 13F | Activest Wealth Management | 580 | -25,06 | 21 | -22,22 | ||||
| 2026-02-18 | 13F | Mackenzie Financial Corp | Put | 27.500 | -7,09 | 8 | 133,33 | |||
| 2025-10-20 | 13F | Segment Wealth Management, LLC | 0 | -100,00 | 0 | |||||
| 2026-02-03 | 13F | CGC Financial Services, LLC | 4 | 0,00 | 0 | |||||
| 2025-10-23 | 13F | Duncker Streett & Co Inc | 0 | -100,00 | 0 | |||||
| 2026-01-28 | 13F | Geneos Wealth Management Inc. | 11.684 | -11,84 | 428 | -7,97 | ||||
| 2026-01-26 | 13F | Asset Dedication, LLC | 946 | 0,00 | 35 | 3,03 | ||||
| 2026-02-12 | 13F | Brown Brothers Harriman & Co | 8.623 | 159,96 | 316 | 171,55 | ||||
| 2025-11-13 | 13F | Css Llc/il | Call | 0 | -100,00 | 0 | -100,00 | |||
| 2026-01-21 | 13F | Daytona Street Capital LLC | 5.600 | 205 | ||||||
| 2026-02-17 | 13F | Russell Investments Group, Ltd. | 888.465 | 4,13 | 32.547 | 8,79 | ||||
| 2026-02-12 | 13F | Cloud Capital Management, LLC | 0 | -100,00 | 0 | |||||
| 2026-02-11 | 13F | IMA Wealth, Inc. | 85 | 962,50 | 3 | |||||
| 2026-02-06 | 13F | Pnc Financial Services Group, Inc. | 172.931 | -3,67 | 6.334 | 0,65 | ||||
| 2026-02-09 | 13F | CBIZ Investment Advisory Services, LLC | 445 | 12,94 | 16 | 23,08 | ||||
| 2026-02-03 | 13F | International Assets Investment Management, Llc | 50.128 | -16,12 | 1.836 | -5,89 | ||||
| 2026-02-09 | 13F | Harbour Investments, Inc. | 7.901 | -6,34 | 289 | -2,03 | ||||
| 2026-02-13 | 13F | Marshall Wace, Llp | Call | 0 | -100,00 | 0 | -100,00 | |||
| 2026-02-13 | 13F | Marshall Wace, Llp | Put | 0 | -100,00 | 0 | -100,00 | |||
| 2026-02-13 | 13F | Marshall Wace, Llp | 0 | -100,00 | 0 | -100,00 | ||||
| 2026-02-17 | 13F | Adams Wealth Management | 74.461 | 1,10 | 2.728 | 5,62 | ||||
| 2025-09-24 | NP | TOK - iShares MSCI Kokusai ETF | 2.014 | 0,00 | 67 | 8,20 | ||||
| 2025-09-26 | NP | FIFNX - Fidelity Founders Fund This fund is a listed as child fund of Fmr Llc and if that institution has disclosed ownership in this security, then these positions will not be double counted when calculating total shares and total value | 2.524 | 0,00 | 84 | 9,21 | ||||
| 2026-01-30 | 13F | Valued Wealth Advisors LLC | 84 | 115,38 | 3 | 200,00 | ||||
| 2025-11-13 | 13F | Herold Advisors, Inc. | 0 | -100,00 | 0 | |||||
| 2026-02-02 | 13F | PKO Investment Management Joint-Stock Co | 13.861 | -21,52 | 508 | -18,09 | ||||
| 2026-02-10 | 13F | Bnp Paribas | 600 | 0,00 | 22 | 4,76 | ||||
| 2025-10-27 | 13F | Kiker Wealth Management, LLC | 0 | -100,00 | 0 | -100,00 | ||||
| 2026-02-06 | 13F | BOK Financial Private Wealth, Inc. | 1.525 | 56 | ||||||
| 2026-02-04 | 13F | Midwest Trust Co | 6.065 | -3,62 | 222 | 0,91 | ||||
| 2026-02-12 | 13F | Renaissance Technologies Llc | 637.549 | -72,84 | 23.353 | -71,63 | ||||
| 2026-02-13 | 13F | Alyeska Investment Group, L.P. | 0 | -100,00 | 0 | -100,00 | ||||
| 2025-11-04 | 13F | Pineridge Advisors LLC | 100 | 0,00 | 4 | 0,00 | ||||
| 2026-01-29 | 13F | Scissortail Wealth Management, LLC | 54.505 | -0,71 | 1.997 | 3,74 | ||||
| 2026-02-12 | 13F | Counterpoint Mutual Funds LLC | 0 | -100,00 | 0 | |||||
| 2025-09-25 | NP | VT - Vanguard Total World Stock Index Fund ETF Shares | 424.956 | 4,66 | 14.117 | 14,34 | ||||
| 2026-02-04 | 13F | Plato Investment Management Ltd | 19.910 | 733 | ||||||
| 2026-02-13 | 13F | Gts Securities Llc | 9.484 | 347 | ||||||
| 2026-02-10 | 13F | Sittner & Nelson, Llc | 474 | 0,00 | 21 | 25,00 | ||||
| 2026-01-27 | 13F | CenterStar Asset Management, LLC | Call | 19.700 | 722 | 2.084,85 | ||||
| 2025-09-24 | NP | IYE - iShares U.S. Energy ETF | 434.519 | -1,72 | 14.435 | 7,36 | ||||
| 2026-02-17 | 13F | Prelude Capital Management, Llc | 17.558 | 643 | ||||||
| 2026-01-30 | 13F | Bogart Wealth, LLC | 1.233 | -44,78 | 45 | -42,31 | ||||
| 2026-02-06 | 13F | Legato Capital Management LLC | 21.890 | 802 | ||||||
| 2026-02-10 | 13F/A | Guinness Atkinson Asset Management Inc | 9.419 | 24,59 | 341 | 26,87 | ||||
| 2026-02-11 | 13F | Nemes Rush Group LLC | 357 | 5,31 | 13 | 18,18 | ||||
| 2025-09-24 | NP | PMPRX - MidCap Value Fund I R-3 | 505.556 | 0,13 | 16.795 | 9,38 | ||||
| 2025-09-26 | NP | RTDAX - Multifactor U.S. Equity Fund Class A | 8.403 | -4,03 | 279 | 4,89 | ||||
| 2026-01-30 | 13F | Citizens National Bank Trust Department | 18.773 | -6,42 | 688 | -2,28 | ||||
| 2026-02-05 | 13F | Stoneridge Investment Partners Llc | 28.496 | -1,57 | 1 | 0,00 | ||||
| 2026-02-13 | 13F | Prudential Financial Inc | 1.475.832 | 241,32 | 54.060 | 256,61 | ||||
| 2025-11-07 | 13F | Axxcess Wealth Management, Llc | 0 | -100,00 | 0 | -100,00 | ||||
| 2026-02-05 | 13F | Thrivent Financial For Lutherans | 4.669.486 | -0,91 | 171 | 3,64 | ||||
| 2025-10-21 | 13F | Wealth Management Associates, Inc. | 0 | -100,00 | 0 | |||||
| 2026-02-13 | 13F | DC Investments Management, LLC | 80.637 | 7,67 | 2.954 | 12,50 | ||||
| 2026-02-11 | 13F | Harvest Fund Management Co., Ltd | 5.384 | 0,00 | 0 | |||||
| 2026-02-12 | 13F | Wealthspire Advisors, LLC | 6.240 | 1.097,70 | 229 | 1.166,67 | ||||
| 2025-09-25 | NP | PTMAX - PGIM QMA LARGE-CAP CORE EQUITY FUND Class A | 8.000 | -38,46 | 266 | -32,91 | ||||
| 2025-09-29 | NP | EGLE - Global X S&P 500 U.S. Revenue Leaders ETF | 39 | -35,00 | 1 | 0,00 | ||||
| 2026-02-13 | 13F | Ieq Capital, Llc | 671.522 | -18,54 | 24.598 | -14,90 | ||||
| 2026-01-28 | 13F | Kerusso Capital Management LLC | 136.278 | 169,39 | 4.992 | 181,50 | ||||
| 2025-10-15 | 13F | Chesapeake Asset Management Llc | 0 | -100,00 | 0 | |||||
| 2026-01-27 | 13F | Autumn Glory Partners, LLC | 34.875 | -15,74 | 1.277 | -11,99 | ||||
| 2025-11-13 | 13F | South Plains Financial, Inc. | 0 | -100,00 | 0 | |||||
| 2026-02-18 | 13F | Beacon Pointe Advisors, LLC | 10.238 | 59,45 | 375 | 66,67 | ||||
| 2026-02-11 | 13F | Jpmorgan Chase & Co | 2.241.134 | -22,59 | 82.093 | -19,13 | ||||
| 2026-02-11 | 13F | Jpmorgan Chase & Co | Call | 200.000 | 0,00 | 7.326 | 4,48 | |||
| 2026-02-11 | 13F | Jpmorgan Chase & Co | Put | 250.600 | 24,93 | 9.179 | 30,51 | |||
| 2026-01-21 | 13F | Register Financial Advisors LLC | 6.218 | -10,00 | 228 | -6,20 | ||||
| 2026-02-13 | 13F | SRS Capital Advisors, Inc. | 12.348 | -94,48 | 452 | -94,24 | ||||
| 2026-02-12 | 13F | Bank of Jackson Hole Trust | 0 | -100,00 | 0 | |||||
| 2026-01-26 | 13F | Whittier Trust Co | 928 | -46,02 | 33 | -44,07 | ||||
| 2026-01-29 | 13F | IMC-Chicago, LLC | Put | 231.100 | -42,44 | 8.465 | -39,86 | |||
| 2026-01-29 | 13F | IMC-Chicago, LLC | Call | 603.000 | 7,14 | 22.088 | 11,94 | |||
| 2026-01-15 | 13F | Frank, Rimerman Advisors LLC | 6.096 | -0,47 | 223 | 4,21 | ||||
| 2026-01-23 | 13F | Chronos Wealth Management, LLC | 5.700 | 209 | ||||||
| 2026-02-13 | 13F | Cornercap Investment Counsel Inc | 43.381 | -1,36 | 1.589 | 3,11 | ||||
| 2026-01-23 | 13F | U.S. Capital Wealth Advisors, LLC | 117.102 | -0,41 | 4.289 | 4,05 | ||||
| 2026-01-15 | 13F | Shrier Wealth Management, Llc | 5.736 | 210 | ||||||
| 2025-09-29 | NP | KCXIX - Knights of Columbus U.S. All Cap Index Fund I Shares | 2.871 | -0,21 | 95 | 9,20 | ||||
| 2026-02-13 | 13F | Smartleaf Asset Management LLC | 6.145 | 18,31 | 226 | 22,83 | ||||
| 2026-01-30 | 13F | North Star Investment Management Corp. | 2.625 | 4,25 | 96 | 9,09 | ||||
| 2026-02-10 | 13F | MUFG Securities EMEA plc | 943.817 | 7.667,40 | 34.572 | 8.015,49 | ||||
| 2026-02-03 | 13F | Stiles Financial Services Inc | 39.602 | -31,20 | 1.451 | -28,15 | ||||
| 2026-01-28 | 13F | CAPROCK Group, Inc. | 42.694 | -19,31 | 1.564 | -18,17 | ||||
| 2026-01-14 | 13F | Accurate Wealth Management, LLC | 24.861 | -27,36 | 889 | -20,55 | ||||
| 2026-01-28 | 13F | Loring Wolcott & Coolidge Fiduciary Advisors Llp/ma | 3.835 | 0,00 | 151 | 17,97 | ||||
| 2026-01-15 | 13F | J. Safra Sarasin Holding AG | 14.189 | -11,68 | 520 | -7,82 | ||||
| 2026-01-15 | 13F | Highline Wealth Partners Llc | 24 | 0,00 | 1 | |||||
| 2026-02-17 | 13F | SummitTX Capital, L.P. | 0 | -100,00 | 0 | |||||
| 2026-02-06 | 13F | Profund Advisors Llc | 21.927 | -14,89 | 803 | -11,07 | ||||
| 2026-02-12 | 13F | Commonwealth Equity Services, Llc | 209.244 | -6,72 | 7.665 | 109.385,71 | ||||
| 2026-02-09 | 13F | Mizuho Securities Usa Llc | 45.676 | -1,21 | 1.693 | 1,38 | ||||
| 2026-01-23 | 13F | Brown, Lisle/cummings, Inc. | 10.899 | 1,87 | 399 | 6,40 | ||||
| 2025-11-14 | 13F | Bridgefront Capital, LLC | 0 | -100,00 | 0 | -100,00 | ||||
| 2026-01-20 | 13F | Philip James Wealth Mangement, LLC | 161.368 | 43,75 | 5.911 | 50,19 | ||||
| 2025-09-26 | NP | USISX - Income Stock Fund Shares | 399.703 | -29,56 | 13.278 | -23,04 | ||||
| 2026-02-05 | 13F | DnB Asset Management AS | 122.555 | 0,40 | 4.489 | 4,91 | ||||
| 2026-02-13 | 13F | Walleye Capital LLC | Call | 109.200 | 970,59 | 4.000 | 1.020,17 | |||
| 2026-02-13 | 13F | Walleye Capital LLC | Put | 124.100 | 260,76 | 4.546 | 276,87 | |||
| 2025-09-26 | NP | FNILX - Fidelity ZERO Large Cap Index Fund This fund is a listed as child fund of Fmr Llc and if that institution has disclosed ownership in this security, then these positions will not be double counted when calculating total shares and total value | 164.426 | 1,37 | 5.462 | 10,75 | ||||
| 2025-09-26 | NP | LSEQ - Harbor Long-Short Equity ETF | Short | -13.718 | 11,01 | -456 | 21,33 | |||
| 2026-02-13 | 13F | Walleye Capital LLC | 72.101 | 801,15 | 2.641 | 843,21 | ||||
| 2026-02-10 | 13F | Gulf International Bank (UK) Ltd | 28.703 | 0,23 | 1 | 0,00 | ||||
| 2026-02-17 | 13F | Raymond James Financial Inc | 2.007.657 | -22,39 | 73.540 | -18,92 | ||||
| 2026-01-09 | 13F | 180 Wealth Advisors, Llc | 25.246 | 9,82 | 925 | 14,78 | ||||
| 2026-02-03 | 13F | Strengthening Families & Communities, LLC | 402 | 125,84 | 15 | 133,33 | ||||
| 2026-01-20 | 13F | Cromwell Holdings LLC | 1.810 | -19,56 | 66 | -15,38 | ||||
| 2026-02-17 | 13F | Wiley Bros.-aintree Capital, Llc | 34.711 | -12,54 | 1.273 | -8,55 | ||||
| 2026-01-28 | 13F | Quaker Wealth Management, LLC | 13 | 44,44 | 0 | |||||
| 2025-10-28 | 13F | Mascoma Wealth Management LLC | 0 | -100,00 | 0 | |||||
| 2026-02-11 | 13F | Manchester Capital Management LLC | 1.082 | 40 | ||||||
| 2026-02-10 | 13F | Winthrop Capital Management, LLC | 0 | -100,00 | 0 | |||||
| 2026-01-06 | 13F | Collective Family Office Llc | 7.937 | 8,71 | 291 | 13,73 | ||||
| 2026-02-09 | 13F | Leavell Investment Management, Inc. | 10.763 | -0,04 | 394 | 4,51 | ||||
| 2026-02-06 | 13F | Cedar Wealth Management, LLC | 707 | 0,57 | 26 | 4,17 | ||||
| 2025-11-20 | 13F | Ariadne Wealth Management, LP | 0 | -100,00 | 0 | |||||
| 2026-02-09 | 13F | Quest Partners LLC | 27.843 | -32,17 | 1.020 | -29,19 | ||||
| 2026-02-05 | 13F | Rahlfs Capital, Llc | 11.425 | 0,00 | 418 | 4,50 | ||||
| 2026-02-13 | 13F | OMERS ADMINISTRATION Corp | 77.532 | 239,32 | 2.840 | 254,43 | ||||
| 2026-02-10 | 13F | Heritage Trust Co | 61.259 | -6,10 | 2.244 | -1,92 | ||||
| 2026-02-03 | 13F | Bernzott Capital Advisors | 103.021 | -3,79 | 3.774 | 0,51 | ||||
| 2026-02-17 | 13F | Adage Capital Partners Gp, L.l.c. | 4.456.292 | -3,08 | 163.234 | 1,26 | ||||
| 2026-02-09 | 13F | Huntington National Bank | 5.412 | 13,27 | 198 | 18,56 | ||||
| 2026-02-17 | 13F | Graham Capital Management, L.P. | 14.325 | -78,34 | 525 | -77,39 | ||||
| 2026-02-17 | 13F | Fmr Llc | 2.827.212 | 41,18 | 103.561 | 47,50 | ||||
| 2026-02-17 | 13F | CWM Advisors, LLC | 66.724 | -0,07 | 2.444 | 4,44 | ||||
| 2026-01-23 | 13F | TFC Financial Management | 113 | 0,00 | 4 | 33,33 | ||||
| 2026-02-09 | 13F | Choate Investment Advisors | 7.532 | 276 | ||||||
| 2026-02-05 | 13F | Blume Capital Management, Inc. | 2.935 | -13,29 | 108 | -9,32 | ||||
| 2025-09-29 | NP | XCLR - Global X S&P 500 Collar 95-110 ETF This fund is a listed as child fund of Mirae Asset Global Investments Co., Ltd. and if that institution has disclosed ownership in this security, then these positions will not be double counted when calculating total shares and total value | 34 | 13,33 | 1 | |||||
| 2026-01-12 | 13F | Gilman Hill Asset Management, LLC | 229.206 | -3,40 | 8.396 | 0,93 | ||||
| 2026-02-13 | 13F | MAI Capital Management | 12.925 | -30,09 | 473 | -27,01 | ||||
| 2026-02-17 | 13F | IHT Wealth Management, LLC | 20.514 | -8,35 | 751 | -4,21 | ||||
| 2026-02-17 | 13F | Captrust Financial Advisors | 1.411.172 | -2,26 | 51.691 | 2,12 | ||||
| 2026-02-13 | 13F | Glen Eagle Advisors, LLC | 266 | 1.166,67 | 10 | |||||
| 2025-11-13 | 13F | Glenmede Investment Management, LP | 172.000 | -50,46 | 6.030 | -45,40 | ||||
| 2025-10-30 | 13F | Keebeck Alpha, LP | 0 | -100,00 | 0 | -100,00 | ||||
| 2025-09-25 | NP | JPUS - JPMorgan Diversified Return U.S. Equity ETF | 8.647 | -12,20 | 287 | -4,01 | ||||
| 2026-01-30 | 13F | Turning Point Benefit Group, Inc. | 82 | 485,71 | 3 | |||||
| 2026-02-13 | 13F | OpenArc Corporate Advisory, LLC | 6.139 | 225 | ||||||
| 2026-02-17 | 13F | Cetera Investment Advisers | 324.238 | -2,34 | 11.877 | 2,03 | ||||
| 2026-01-06 | 13F | Board of the Pension Protection Fund | 1.200 | -95,20 | 44 | -95,09 | ||||
| 2026-02-13 | 13F | Victory Capital Management Inc | 13.916.979 | 17,48 | 509.779 | 22,74 | ||||
| 2026-01-07 | 13F | Hilltop National Bank | 13.359 | -2,20 | 489 | 2,30 | ||||
| 2026-01-15 | 13F | Spirit Of America Management Corp/ny | 36.450 | -5,20 | 1.335 | -0,96 | ||||
| 2025-09-25 | NP | DFVEX - U.s. Vector Equity Portfolio - Institutional Class This fund is a listed as child fund of Dimensional Fund Advisors Lp and if that institution has disclosed ownership in this security, then these positions will not be double counted when calculating total shares and total value | 149.070 | 0,00 | 4.952 | 9,24 | ||||
| 2026-02-13 | 13F | Ingalls & Snyder Llc | 40.748 | -1,44 | 1 | 0,00 | ||||
| 2026-02-13 | 13F | Ingalls & Snyder Llc | Call | 24.900 | -1,58 | 1 | ||||
| 2026-02-24 | 13F | Bell Investment Advisors, Inc | 165 | 75,53 | 6 | 100,00 | ||||
| 2026-01-20 | 13F | Nvwm, Llc | 15 | 50,00 | 1 | |||||
| 2026-02-12 | 13F | Custom Index Systems, Llc | 6.420 | -7,59 | 235 | -3,29 | ||||
| 2026-02-12 | 13F | Compass Capital Management, Inc | 165.832 | -22,01 | 6.074 | -18,52 | ||||
| 2026-02-09 | 13F | AIA Group Ltd | 100.612 | 3.685 | ||||||
| 2026-01-29 | 13F/A | Lazari Capital Management, Inc. | 27.327 | -4,76 | 1.001 | -0,50 | ||||
| 2026-02-09 | 13F | Onefund, Llc | 1.836 | 6,07 | 67 | 11,67 | ||||
| 2026-02-12 | 13F | Summit Financial, LLC | 28.709 | 2,43 | 1.052 | 7,03 | ||||
| 2025-11-14 | 13F | Chiron Capital Management, Llc | 32.315 | 13,33 | 1.133 | 24,81 | ||||
| 2026-02-11 | 13F | J.Safra Asset Management Corp | 0 | -100,00 | 0 | |||||
| 2026-01-30 | 13F | Rogco, Lp | 500 | 18 | ||||||
| 2026-02-13 | 13F | Panagora Asset Management Inc | 3.609.228 | 42.376,50 | 132.206 | 44.413,80 | ||||
| 2026-01-14 | 13F | Lineweaver Wealth Advisors, LLC | 0 | -100,00 | 0 | |||||
| 2026-02-12 | 13F | Federated Hermes, Inc. | 235.079 | 3,23 | 8.611 | 7,84 | ||||
| 2026-01-07 | 13F | Sagespring Wealth Partners, Llc | 5.892 | 216 | ||||||
| 2025-09-25 | NP | DFVX - Dimensional US Large Cap Vector ETF | 17.716 | 0,00 | 589 | 9,29 | ||||
| 2026-01-22 | 13F | Accordant Advisory Group Inc | 4 | 0 | ||||||
| 2026-02-03 | 13F | Sequoia Financial Advisors, LLC | 63.197 | 4,72 | 2.315 | 9,41 | ||||
| 2026-02-09 | 13F | Cary Street Partner Investment Advisory Llc | 1.480 | 21,01 | 54 | 28,57 | ||||
| 2026-02-17 | 13F | Voloridge Investment Management, Llc | 11.798 | -94,64 | 432 | -94,40 | ||||
| 2026-01-27 | 13F | Tred Avon Family Wealth, Llc | 11.067 | -11,87 | 405 | -7,95 | ||||
| 2026-01-27 | 13F | TD Waterhouse Canada Inc. | 4.365 | -20,20 | 160 | -15,87 | ||||
| 2026-02-05 | 13F | Sapient Capital Llc | 16.951 | -1,50 | 624 | 2,13 | ||||
| 2026-02-11 | 13F | Janney Montgomery Scott LLC | 161.577 | -9,84 | 6 | -16,67 | ||||
| 2025-09-26 | NP | LVPIX - Large-cap Value Profund Investor Class | 117 | -96,78 | 4 | -97,27 | ||||
| 2026-02-10 | 13F | Nomura Asset Management Co Ltd | 233.625 | -10,65 | 8.558 | -6,65 | ||||
| 2026-02-13 | 13F | Public Sector Pension Investment Board | 0 | -100,00 | 0 | |||||
| 2025-09-25 | NP | HFLGX - Hennessy Cornerstone Large Growth Fund Investor Class | 71.000 | -0,70 | 2.359 | 8,46 | ||||
| 2026-01-21 | 13F | Bank Of Stockton | 10.771 | 9,23 | 395 | 14,20 | ||||
| 2025-09-24 | NP | FAB - First Trust Multi Cap Value AlphaDEX Fund This fund is a listed as child fund of First Trust Advisors Lp and if that institution has disclosed ownership in this security, then these positions will not be double counted when calculating total shares and total value | 16.714 | 20,14 | 555 | 31,21 | ||||
| 2026-02-12 | 13F | Federation des caisses Desjardins du Quebec | 28.640 | 27,89 | 1.049 | 33,50 | ||||
| 2026-02-17 | 13F | Citadel Advisors Llc | Put | 1.758.800 | -26,66 | 64.425 | -23,37 | |||
| 2026-02-17 | 13F | Citadel Advisors Llc | 2.849.684 | 58,54 | 104.384 | 65,64 | ||||
| 2026-02-06 | 13F | ProShare Advisors LLC | 164.154 | 3,05 | 6.013 | 7,65 | ||||
| 2026-02-12 | 13F | Ci Investments Inc. | 6.458 | 36,62 | 237 | |||||
| 2026-02-17 | 13F | Citadel Advisors Llc | Call | 2.132.400 | 12,55 | 78.110 | 17,59 | |||
| 2026-02-03 | 13F | Orion Capital Management LLC | 0 | -100,00 | 0 | |||||
| 2025-09-29 | NP | XYLD - Global X S&P 500 Covered Call ETF This fund is a listed as child fund of Mirae Asset Global Investments Co., Ltd. and if that institution has disclosed ownership in this security, then these positions will not be double counted when calculating total shares and total value | 37.193 | -15,39 | 1.236 | -7,56 | ||||
| 2026-02-17 | 13F | Nomura Holdings Inc | 31.826 | -39,98 | 1.166 | -37,33 | ||||
| 2026-02-13 | 13F | SIR Capital Management, L.P. | 505.745 | -65,35 | 18.525 | -63,80 | ||||
| 2026-02-17 | 13F | Nomura Holdings Inc | Put | 50.000 | 0,00 | 1.832 | 4,45 | |||
| 2026-02-17 | 13F | Warren Averett Asset Management, LLC | 19.696 | -27,98 | 721 | -24,74 | ||||
| 2026-02-05 | 13F | Cornerstone Wealth Management, LLC | 22.198 | -9,76 | 813 | -5,68 | ||||
| 2026-01-27 | 13F | Financial Management Professionals, Inc. | 217 | 0,00 | 8 | 0,00 | ||||
| 2026-02-13 | 13F | Treasurer of the State of North Carolina | 329.264 | -15,49 | 12 | -7,69 | ||||
| 2026-01-15 | 13F | Hara Capital LLC | 700 | 0,00 | 26 | 4,17 | ||||
| 2025-11-05 | 13F | Koesten, Hirschmann & Crabtree, INC. | 0 | -100,00 | 0 | |||||
| 2026-02-09 | 13F | King Luther Capital Management Corp | 479.570 | -1,71 | 17.567 | 2,69 | ||||
| 2026-02-12 | 13F | Advisory Resource Group | 6.289 | 0,24 | 230 | 5,02 | ||||
| 2025-11-14 | 13F | Peak6 Llc | 0 | -100,00 | 0 | -100,00 | ||||
| 2025-09-24 | NP | VLUE - iShares Edge MSCI USA Value Factor ETF | 834.706 | 115,30 | 27.729 | 135,20 | ||||
| 2026-01-15 | 13F | Econ Financial Services Corp | 19.302 | 707 | ||||||
| 2026-01-28 | 13F | Outfitter Financial LLC | 24.000 | 0,00 | 879 | 4,52 | ||||
| 2025-10-30 | 13F | Ridgewood Investments LLC | Call | 0 | -100,00 | 0 | -100,00 | |||
| 2026-01-27 | 13F | Wealth Enhancement Trust Services, Inc. | 3.426 | 125 | ||||||
| 2025-11-12 | 13F | Quantbot Technologies LP | 0 | -100,00 | 0 | |||||
| 2026-02-17 | 13F | D. E. Shaw & Co., Inc. | Call | 245.800 | -27,85 | 9.004 | -24,62 | |||
| 2026-02-17 | 13F | D. E. Shaw & Co., Inc. | 43.179 | -51,37 | 1.582 | -49,21 | ||||
| 2026-02-12 | 13F | Foster Dykema Cabot & Partners, Llc | 250 | 0,00 | 9 | 12,50 | ||||
| 2026-02-12 | 13F | Intrinsic Edge Capital Management LLC | 112.804 | 0,00 | 4.132 | 4,50 | ||||
| 2026-02-17 | 13F | D. E. Shaw & Co., Inc. | Put | 1.314.000 | -8,96 | 48.132 | -4,88 | |||
| 2025-09-25 | NP | JPME - JPMorgan Diversified Return U.S. Mid Cap Equity ETF | 24.449 | -12,96 | 812 | -4,92 | ||||
| 2026-02-12 | 13F | Keynote Financial Services Llc | 0 | -100,00 | 0 | |||||
| 2026-01-28 | 13F | Papp L Roy & Associates | 8.720 | -14,29 | 319 | -10,39 | ||||
| 2026-02-19 | 13F | Atomi Financial Group, Inc. | 6.390 | -15,04 | 234 | -11,03 | ||||
| 2026-02-06 | 13F | IFP Advisors, Inc | 16.203 | 3,29 | 594 | 8,01 | ||||
| 2026-01-16 | 13F | Crowley Wealth Management, Inc. | 0 | -100,00 | 0 | |||||
| 2026-02-10 | 13F | Koss-Olinger Consulting, LLC | 41.744 | -23,93 | 1.529 | -12,43 | ||||
| 2025-09-24 | NP | BLACKROCK FUNDS - iShares Russell Mid-Cap Index Fund Institutional | 107.582 | 0,00 | 3.574 | 9,23 | ||||
| 2026-01-30 | 13F | American Capital Advisory, LLC | 19 | 90,00 | 1 | |||||
| 2026-01-23 | 13F | Visionary Horizons, LLC | 14.011 | -4,56 | 513 | -0,19 | ||||
| 2026-01-14 | 13F | Spire Wealth Management | 2.009 | 1,57 | 74 | 5,80 | ||||
| 2026-02-09 | 13F | Catalyst Funds Management Pty Ltd | 0 | -100,00 | 0 | |||||
| 2026-02-17 | 13F | Gladstone Institutional Advisory LLC | 9.498 | 348 | ||||||
| 2026-01-27 | 13F | Brighton Jones Llc | 0 | -100,00 | 0 | |||||
| 2025-09-26 | NP | Invesco Exchange-Traded Fund Trust II - Invesco MSCI Global Climate 500 ETF | 39.505 | 22,58 | 1.312 | 33,88 | ||||
| 2026-02-10 | 13F | Fortis Advisors, LLC | 7.900 | 0,00 | 289 | 4,71 | ||||
| 2025-09-26 | NP | BKLC - BNY Mellon US Large Cap Core Equity ETF | 46.140 | 26,48 | 1.533 | 38,14 | ||||
| 2026-02-05 | 13F | Stephens Inc /ar/ | 68.450 | -4,52 | 2.507 | -0,24 | ||||
| 2025-12-16 | 13F | Garde Capital, Inc. | 0 | -100,00 | 0 | |||||
| 2026-01-14 | 13F | Wedge Capital Management L L P/nc | 271.111 | 9.931 | ||||||
| 2026-02-12 | 13F | Kovack Advisors, Inc. | 15.798 | 25,15 | 477 | 7,92 | ||||
| 2026-01-29 | 13F | Nbc Securities, Inc. | 2.051 | -8,88 | 75 | -3,85 | ||||
| 2026-02-12 | 13F | Caerus Investment Advisors, LLC | 7.977 | -55,13 | 292 | -53,13 | ||||
| 2025-11-12 | 13F | HAP Trading, LLC | Call | 14.600 | 16 | |||||
| 2025-11-12 | 13F | HAP Trading, LLC | Put | 19.900 | 36 | |||||
| 2026-01-07 | 13F | Riversedge Advisors, Llc | 11.686 | -0,38 | 428 | 4,14 | ||||
| 2026-01-21 | 13F | Yousif Capital Management, Llc | 76.935 | -6,76 | 2.792 | -3,49 | ||||
| 2026-01-29 | 13F | UBS Group AG | Put | 1.026.800 | -13,17 | 37.612 | -9,29 | |||
| 2026-01-21 | 13F | Stone House Investment Management, LLC | 1.049 | 0,00 | 38 | 5,56 | ||||
| 2026-01-29 | 13F | UBS Group AG | Call | 667.573 | 39,48 | 24.453 | 45,73 | |||
| 2026-01-29 | 13F | UBS Group AG | 3.629.873 | -20,81 | 132.962 | -17,26 | ||||
| 2026-01-20 | 13F | YANKCOM Partnership | 52 | 2 | ||||||
| 2026-02-03 | 13F | Chesapeake Capital Corp /il/ | 14.865 | 545 | ||||||
| 2026-02-13 | 13F | Walleye Trading LLC | Put | 380.500 | -11,24 | 13.938 | -7,27 | |||
| 2025-11-03 | 13F | Core Alternative Capital | 0 | -100,00 | 0 | |||||
| 2026-02-13 | 13F | Walleye Trading LLC | Call | 780.200 | -6,79 | 28.579 | -2,61 | |||
| 2025-10-21 | 13F | OMC Financial Services LTD | 0 | -100,00 | 0 | |||||
| 2025-10-30 | 13F | Allegiance Financial Group Advisory Services LLC | 0 | -100,00 | 0 | |||||
| 2025-09-26 | NP | JHML - John Hancock Multifactor Large Cap ETF | 13.616 | 0,74 | 452 | 9,98 | ||||
| 2026-02-14 | 13F | Rockefeller Capital Management L.P. | 298.876 | -5,12 | 10.948 | -0,88 | ||||
| 2025-09-22 | NP | TLORX - Transamerica Large Value Opportunities R | 17.548 | -1,92 | 583 | 6,99 | ||||
| 2026-02-10 | 13F | GoodHaven Capital Management, LLC | 454.671 | 1,72 | 16.655 | 6,28 | ||||
| 2026-02-12 | 13F | Steward Partners Investment Advisory, Llc | 82.020 | -3,90 | 3.004 | 0,40 | ||||
| 2025-09-29 | NP | ZIG - The Acquirers Fund | 33.224 | 0,30 | 1.104 | 9,53 | ||||
| 2026-01-30 | 13F | Us Bancorp \de\ | 119.166 | 5,17 | 4.365 | 9,89 | ||||
| 2026-01-20 | 13F | Signaturefd, Llc | 15.154 | 0,13 | 555 | 4,72 | ||||
| 2026-02-11 | 13F | Waddell & Associates, Llc | 10.458 | 23,50 | 383 | 29,39 | ||||
| 2026-02-12 | 13F | BRYN MAWR TRUST Co | 15.655 | 4,17 | 573 | 8,94 | ||||
| 2026-02-17 | 13F | Tudor Investment Corp Et Al | Put | 60.800 | -63,15 | 2.227 | -61,50 | |||
| 2026-02-17 | 13F | Tudor Investment Corp Et Al | Call | 49.600 | -74,84 | 1.817 | -73,72 | |||
| 2026-01-14 | 13F | Generali Investments CEE, investicni spolecnost, a.s. | 13.900 | 0,00 | 509 | 4,52 | ||||
| 2026-01-23 | 13F | Assetmark, Inc | 4.319 | -19,94 | 158 | -16,40 | ||||
| 2025-09-26 | NP | UVALX - Value Fund Shares | 184.247 | 0,00 | 6.121 | 9,25 | ||||
| 2025-09-26 | NP | FLCOX - Fidelity Large Cap Value Index Fund This fund is a listed as child fund of Fmr Llc and if that institution has disclosed ownership in this security, then these positions will not be double counted when calculating total shares and total value | 256.188 | -6,42 | 8.511 | 2,23 | ||||
| 2026-02-03 | 13F | Gateway Investment Advisers Llc | 7.137 | 261 | ||||||
| 2026-02-18 | 13F | State of Tennessee, Treasury Department | 244.706 | 32,51 | 9.840 | 51,98 | ||||
| 2025-11-14 | 13F | Wetherby Asset Management Inc | 30.343 | -3,60 | 1.064 | 6,19 |