Grundlæggende statistik
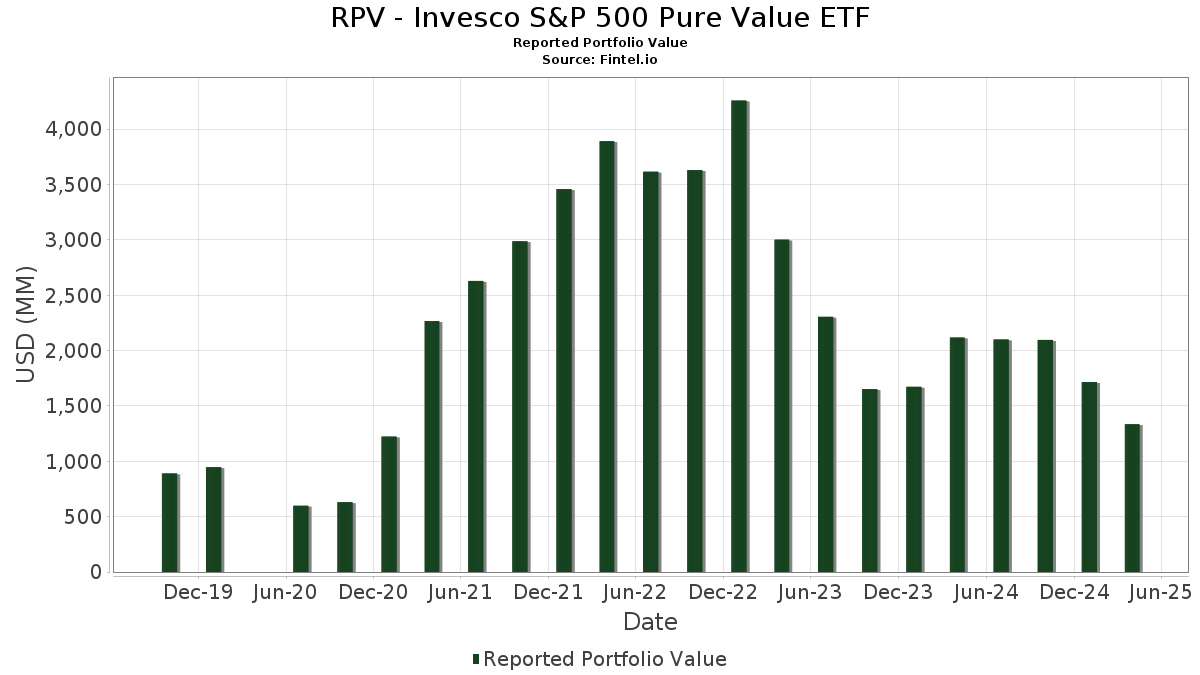
| Porteføljeværdi | $ 1.322.918.218 |
| Nuværende stillinger | 109 |
Seneste beholdninger, ydeevne, AUM (fra 13F, 13D)
RPV - Invesco S&P 500 Pure Value ETF har afsløret 109 samlede besiddelser i deres seneste SEC-arkivering. Den seneste porteføljeværdi er beregnet til at være $ 1.322.918.218 USD. Faktiske aktiver under forvaltning (AUM) er denne værdi plus kontanter (som ikke er oplyst). RPV - Invesco S&P 500 Pure Value ETFs største beholdninger er CVS Health Corporation (US:CVS) , Ford Motor Company (US:F) , General Motors Company (US:GM) , The Mosaic Company (US:MOS) , and Archer-Daniels-Midland Company (US:ADM) .
Top øger dette kvartal
Vi bruger ændringen i porteføljeallokeringen, fordi dette er den mest meningsfulde metrik. Ændringer kan skyldes handler eller ændringer i aktiekurser.
| Sikkerhed | Aktier (MM) |
Værdi (MM$) |
Portefølje % | ΔPortefølje % |
|---|---|---|---|---|
| 20,68 | 20,68 | 1,5483 | 1,5483 | |
| 7,94 | 7,94 | 0,5948 | 0,5948 | |
| WBD / Warner Bros. Discovery, Inc. | 1,73 | 22,73 | 1,7019 | 0,5017 |
| IVZ / Invesco Ltd. | 0,99 | 20,77 | 1,5548 | 0,4491 |
| C / Citigroup Inc. | 0,27 | 25,49 | 1,9083 | 0,4130 |
| DLTR / Dollar Tree, Inc. | 0,19 | 22,14 | 1,6577 | 0,3789 |
| JBL / Jabil Inc. | 0,06 | 13,89 | 1,0402 | 0,3085 |
| MOS / The Mosaic Company | 0,97 | 35,06 | 2,6247 | 0,2473 |
| GM / General Motors Company | 0,66 | 35,12 | 2,6293 | 0,2363 |
| MPC / Marathon Petroleum Corporation | 0,13 | 21,73 | 1,6269 | 0,2198 |
Top falder i dette kvartal
Vi bruger ændringen i porteføljeallokeringen, fordi dette er den mest meningsfulde metrik. Ændringer kan skyldes handler eller ændringer i aktiekurser.
| Sikkerhed | Aktier (MM) |
Værdi (MM$) |
Portefølje % | ΔPortefølje % |
|---|---|---|---|---|
| CNC / Centene Corporation | 0,56 | 14,48 | 1,0840 | -1,5885 |
| MOH / Molina Healthcare, Inc. | 0,05 | 7,61 | 0,5695 | -0,6945 |
| ANTM / Anthem Inc | 0,04 | 10,89 | 0,8154 | -0,4825 |
| CI / The Cigna Group | 0,06 | 16,59 | 1,2422 | -0,4550 |
| CVS / CVS Health Corporation | 0,64 | 39,75 | 2,9758 | -0,4544 |
| TSN / Tyson Foods, Inc. | 0,38 | 20,11 | 1,5054 | -0,3882 |
| LKQ / LKQ Corporation | 0,36 | 10,47 | 0,7841 | -0,3028 |
| TAP / Molson Coors Beverage Company | 0,28 | 13,58 | 1,0165 | -0,2699 |
| CAG / Conagra Brands, Inc. | 0,37 | 6,72 | 0,5029 | -0,2264 |
| DOW / Dow Inc. | 0,31 | 7,18 | 0,5374 | -0,2191 |
13F og Fondsarkivering
Denne formular blev indsendt den 2025-09-29 for rapporteringsperioden 2025-07-31. Klik på linkikonet for at se den fulde transaktionshistorik.
Opgrader for at låse op for premium-data og eksportere til Excel ![]() .
.
| Sikkerhed | Type | Gennemsnitlig aktiekurs | Aktier (MM) |
Δ Aktier (%) |
Værdi ($MM) |
Δ Aktier (%) |
Portefølje (%) |
ΔPortefølje (%) |
|
|---|---|---|---|---|---|---|---|---|---|
| CVS / CVS Health Corporation | 0,64 | -2,46 | 39,75 | -9,20 | 2,9758 | -0,4544 | |||
| F / Ford Motor Company | 3,21 | -2,47 | 35,59 | 7,86 | 2,6646 | 0,0788 | |||
| GM / General Motors Company | 0,66 | -2,46 | 35,12 | 15,00 | 2,6293 | 0,2363 | |||
| MOS / The Mosaic Company | 0,97 | -2,45 | 35,06 | 15,55 | 2,6247 | 0,2473 | |||
| ADM / Archer-Daniels-Midland Company | 0,58 | -2,48 | 31,26 | 10,66 | 2,3404 | 0,1266 | |||
| CH1300646267 / Bunge Global SA | 0,36 | -2,47 | 28,44 | -1,18 | 2,1289 | -0,1260 | |||
| PARA / Paramount Global | 2,12 | -2,46 | 26,69 | 4,43 | 1,9981 | -0,0044 | |||
| VLO / Valero Energy Corporation | 0,19 | -2,48 | 25,50 | 15,35 | 1,9089 | 0,1768 | |||
| C / Citigroup Inc. | 0,27 | -2,52 | 25,49 | 33,58 | 1,9083 | 0,4130 | |||
| DG / Dollar General Corporation | 0,23 | -2,45 | 24,14 | 9,22 | 1,8072 | 0,0753 | |||
| KR / The Kroger Co. | 0,34 | -2,44 | 24,13 | -5,29 | 1,8064 | -0,1899 | |||
| WBD / Warner Bros. Discovery, Inc. | 1,73 | -2,29 | 22,73 | 48,42 | 1,7019 | 0,5017 | |||
| DLTR / Dollar Tree, Inc. | 0,19 | -2,30 | 22,14 | 35,68 | 1,6577 | 0,3789 | |||
| MPC / Marathon Petroleum Corporation | 0,13 | -2,29 | 21,73 | 21,01 | 1,6269 | 0,2198 | |||
| HUM / Humana Inc. | 0,09 | -2,46 | 21,71 | -7,07 | 1,6255 | -0,2052 | |||
| CAH / Cardinal Health, Inc. | 0,14 | -2,50 | 21,56 | 7,11 | 1,6139 | 0,0368 | |||
| WBA / Walgreens Boots Alliance, Inc. | 1,84 | -2,47 | 21,38 | 3,48 | 1,6007 | -0,0183 | |||
| PSX / Phillips 66 | 0,17 | -2,61 | 21,18 | 15,66 | 1,5859 | 0,1508 | |||
| IVZ / Invesco Ltd. | 0,99 | -2,42 | 20,77 | 47,17 | 1,5548 | 0,4491 | |||
| Invesco Private Prime Fund / STIV (N/A) | 20,68 | 20,68 | 1,5483 | 1,5483 | |||||
| TSN / Tyson Foods, Inc. | 0,38 | -2,57 | 20,11 | -16,79 | 1,5054 | -0,3882 | |||
| HII / Huntington Ingalls Industries, Inc. | 0,07 | -2,33 | 19,86 | 18,24 | 1,4867 | 0,1707 | |||
| COR / Cencora, Inc. | 0,07 | -2,60 | 19,81 | -4,80 | 1,4835 | -0,1474 | |||
| MCK / McKesson Corporation | 0,03 | -2,49 | 19,35 | -5,13 | 1,4490 | -0,1496 | |||
| APTV / Aptiv PLC | 0,25 | -2,45 | 17,00 | 17,35 | 1,2726 | 0,1375 | |||
| CI / The Cigna Group | 0,06 | -2,58 | 16,59 | -23,40 | 1,2422 | -0,4550 | |||
| BEN / Franklin Resources, Inc. | 0,68 | -2,45 | 16,42 | 24,79 | 1,2293 | 0,1983 | |||
| L / Loews Corporation | 0,18 | -2,43 | 16,13 | 1,74 | 1,2075 | -0,0347 | |||
| KHC / The Kraft Heinz Company | 0,58 | -2,34 | 16,01 | -7,84 | 1,1987 | -0,1627 | |||
| AIG / American International Group, Inc. | 0,21 | -2,50 | 15,95 | -7,15 | 1,1944 | -0,1520 | |||
| MHK / Mohawk Industries, Inc. | 0,13 | -2,09 | 15,02 | 5,42 | 1,1249 | 0,0080 | |||
| EG / Everest Group, Ltd. | 0,04 | -2,31 | 14,84 | -8,58 | 1,1108 | -0,1609 | |||
| CNC / Centene Corporation | 0,56 | -2,54 | 14,48 | -57,55 | 1,0840 | -1,5885 | |||
| PRU / Prudential Financial, Inc. | 0,14 | -2,09 | 14,02 | -1,26 | 1,0493 | -0,0630 | |||
| JBL / Jabil Inc. | 0,06 | -2,28 | 13,89 | 48,80 | 1,0402 | 0,3085 | |||
| TAP / Molson Coors Beverage Company | 0,28 | -2,34 | 13,58 | -17,30 | 1,0165 | -0,2699 | |||
| HPE / Hewlett Packard Enterprise Company | 0,65 | -2,07 | 13,45 | 24,91 | 1,0069 | 0,1632 | |||
| VTRS / Viatris Inc. | 1,51 | -2,11 | 13,16 | 1,61 | 0,9851 | -0,0297 | |||
| CFG / Citizens Financial Group, Inc. | 0,27 | -2,29 | 13,05 | 26,41 | 0,9770 | 0,1680 | |||
| ANTM / Anthem Inc | 0,04 | -2,31 | 10,89 | -34,25 | 0,8154 | -0,4825 | |||
| KMX / CarMax, Inc. | 0,19 | -2,10 | 10,68 | -14,31 | 0,7996 | -0,1770 | |||
| LUV / Southwest Airlines Co. | 0,34 | -2,45 | 10,53 | 7,91 | 0,7882 | 0,0237 | |||
| APA / APA Corporation | 0,55 | -2,33 | 10,52 | 21,23 | 0,7875 | 0,1076 | |||
| LKQ / LKQ Corporation | 0,36 | -2,10 | 10,47 | -24,49 | 0,7841 | -0,3028 | |||
| STT / State Street Corporation | 0,09 | -2,34 | 10,23 | 23,88 | 0,7659 | 0,1188 | |||
| EXC / Exelon Corporation | 0,22 | -2,10 | 10,02 | -6,19 | 0,7505 | -0,0869 | |||
| LYB / LyondellBasell Industries N.V. | 0,17 | -2,34 | 9,92 | -2,81 | 0,7425 | -0,0571 | |||
| T / AT&T Inc. | 0,36 | -2,35 | 9,74 | -3,37 | 0,7293 | -0,0606 | |||
| COF / Capital One Financial Corporation | 0,05 | -2,33 | 9,72 | 16,49 | 0,7276 | 0,0739 | |||
| SYY / Sysco Corporation | 0,12 | -2,35 | 9,49 | 8,87 | 0,7105 | 0,0274 | |||
| BBY / Best Buy Co., Inc. | 0,14 | -2,47 | 9,20 | -4,85 | 0,6889 | -0,0689 | |||
| MET / MetLife, Inc. | 0,12 | -2,33 | 9,13 | -1,57 | 0,6834 | -0,0433 | |||
| AES / The AES Corporation | 0,69 | -2,34 | 9,06 | 28,44 | 0,6780 | 0,1255 | |||
| NUE / Nucor Corporation | 0,06 | -2,34 | 8,85 | 17,06 | 0,6628 | 0,0701 | |||
| SWK / Stanley Black & Decker, Inc. | 0,13 | -2,33 | 8,77 | 10,08 | 0,6569 | 0,0323 | |||
| INTC / Intel Corporation | 0,44 | -2,33 | 8,68 | -3,79 | 0,6498 | -0,0571 | |||
| MGM / MGM Resorts International | 0,23 | -2,35 | 8,44 | 13,14 | 0,6319 | 0,0473 | |||
| UHS / Universal Health Services, Inc. | 0,05 | -2,34 | 8,43 | -8,19 | 0,6313 | -0,0884 | |||
| Invesco Private Government Fund / STIV (N/A) | 7,94 | 7,94 | 0,5948 | 0,5948 | |||||
| SW / Smurfit Westrock Plc | 0,18 | -2,33 | 7,82 | 3,15 | 0,5857 | -0,0086 | |||
| ALL / The Allstate Corporation | 0,04 | -2,32 | 7,79 | 0,08 | 0,5830 | -0,0267 | |||
| TGT / Target Corporation | 0,08 | -2,35 | 7,75 | 1,49 | 0,5800 | -0,0182 | |||
| GPC / Genuine Parts Company | 0,06 | -2,34 | 7,62 | 7,07 | 0,5705 | 0,0128 | |||
| MOH / Molina Healthcare, Inc. | 0,05 | -2,32 | 7,61 | -52,84 | 0,5695 | -0,6945 | |||
| EVRG / Evergy, Inc. | 0,11 | -2,33 | 7,59 | 0,07 | 0,5683 | -0,0261 | |||
| SJM / The J. M. Smucker Company | 0,07 | -2,33 | 7,42 | -9,82 | 0,5552 | -0,0893 | |||
| DOW / Dow Inc. | 0,31 | -2,34 | 7,18 | -25,64 | 0,5374 | -0,2191 | |||
| CZR / Caesars Entertainment, Inc. | 0,27 | -2,33 | 7,07 | -3,70 | 0,5296 | -0,0460 | |||
| HSIC / Henry Schein, Inc. | 0,10 | -2,37 | 7,00 | 1,66 | 0,5240 | -0,0155 | |||
| BAC / Bank of America Corporation | 0,15 | -2,35 | 6,96 | 15,75 | 0,5210 | 0,0499 | |||
| EQT / EQT Corporation | 0,13 | -2,33 | 6,91 | 6,18 | 0,5172 | 0,0074 | |||
| ED / Consolidated Edison, Inc. | 0,07 | -2,32 | 6,90 | -10,34 | 0,5168 | -0,0864 | |||
| DVN / Devon Energy Corporation | 0,20 | -2,34 | 6,78 | 6,69 | 0,5074 | 0,0096 | |||
| CAG / Conagra Brands, Inc. | 0,37 | -2,33 | 6,72 | -27,83 | 0,5029 | -0,2264 | |||
| AIZ / Assurant, Inc. | 0,04 | -2,31 | 6,67 | -5,07 | 0,4994 | -0,0512 | |||
| VZ / Verizon Communications Inc. | 0,16 | -2,34 | 6,66 | -5,22 | 0,4985 | -0,0520 | |||
| VICI / VICI Properties Inc. | 0,20 | -2,34 | 6,65 | -0,57 | 0,4982 | -0,0262 | |||
| XOM / Exxon Mobil Corporation | 0,06 | -2,32 | 6,65 | 3,25 | 0,4976 | -0,0069 | |||
| TFC / Truist Financial Corporation | 0,15 | -2,35 | 6,62 | 11,34 | 0,4955 | 0,0297 | |||
| ARE / Alexandria Real Estate Equities, Inc. | 0,09 | -2,32 | 6,60 | 2,74 | 0,4939 | -0,0092 | |||
| PNW / Pinnacle West Capital Corporation | 0,07 | -2,36 | 6,58 | -7,04 | 0,4924 | -0,0620 | |||
| TRV / The Travelers Companies, Inc. | 0,03 | -2,35 | 6,57 | -3,78 | 0,4915 | -0,0432 | |||
| FANG / Diamondback Energy, Inc. | 0,04 | -2,32 | 6,31 | 10,00 | 0,4727 | 0,0229 | |||
| ES / Eversource Energy | 0,09 | -2,35 | 6,21 | 8,51 | 0,4648 | 0,0165 | |||
| CVX / Chevron Corporation | 0,04 | -2,33 | 6,20 | 8,85 | 0,4640 | 0,0178 | |||
| FDX / FedEx Corporation | 0,03 | -2,28 | 6,12 | 3,85 | 0,4585 | -0,0037 | |||
| OXY / Occidental Petroleum Corporation | 0,14 | -2,33 | 6,09 | 8,89 | 0,4557 | 0,0177 | |||
| BIIB / Biogen Inc. | 0,05 | -2,35 | 6,08 | 3,23 | 0,4553 | -0,0063 | |||
| TXT / Textron Inc. | 0,08 | -2,35 | 5,99 | 7,93 | 0,4484 | 0,0135 | |||
| LEN / Lennar Corporation | 0,05 | -2,35 | 5,97 | 0,86 | 0,4470 | -0,0169 | |||
| CMCSA / Comcast Corporation | 0,18 | -2,34 | 5,94 | -5,11 | 0,4450 | -0,0458 | |||
| MTB / M&T Bank Corporation | 0,03 | -2,30 | 5,94 | 8,61 | 0,4447 | 0,0161 | |||
| RF / Regions Financial Corporation | 0,23 | -2,42 | 5,93 | 21,11 | 0,4442 | 0,0603 | |||
| PFG / Principal Financial Group, Inc. | 0,07 | -2,33 | 5,83 | 2,51 | 0,4366 | -0,0091 | |||
| KEY / KeyCorp | 0,32 | -2,43 | 5,72 | 17,84 | 0,4283 | 0,0478 | |||
| HBAN / Huntington Bancshares Incorporated | 0,34 | -2,43 | 5,67 | 10,34 | 0,4243 | 0,0218 | |||
| CB / Chubb Limited | 0,02 | -2,33 | 5,64 | -9,16 | 0,4223 | -0,0643 | |||
| COG / Cabot Oil & Gas Corp. | 0,22 | -2,34 | 5,46 | -3,02 | 0,4087 | -0,0324 | |||
| STLD / Steel Dynamics, Inc. | 0,04 | -2,42 | 5,40 | -4,03 | 0,4045 | -0,0367 | |||
| DHI / D.R. Horton, Inc. | 0,04 | -2,40 | 5,28 | 10,36 | 0,3950 | 0,0203 | |||
| DD / DuPont de Nemours, Inc. | 0,07 | -2,43 | 5,16 | 6,32 | 0,3865 | 0,0060 | |||
| IP / International Paper Company | 0,11 | -2,41 | 5,10 | -0,16 | 0,3816 | -0,0184 | |||
| FOXA / Fox Corporation | 0,09 | -2,44 | 5,07 | 9,27 | 0,3796 | 0,0159 | |||
| GPN / Global Payments Inc. | 0,06 | -2,41 | 4,98 | 2,26 | 0,3731 | -0,0088 | |||
| EMN / Eastman Chemical Company | 0,06 | -2,45 | 4,66 | -8,01 | 0,3490 | -0,0481 | |||
| PCG / PG&E Corporation | 0,32 | -2,35 | 4,47 | -17,13 | 0,3346 | -0,0880 | |||
| BAX / Baxter International Inc. | 0,19 | -2,33 | 4,23 | -31,82 | 0,3169 | -0,1696 | |||
| FOX / Fox Corporation | 0,05 | -2,46 | 2,77 | 7,86 | 0,2075 | 0,0062 | |||
| US8252528851 / Invesco Government & Agency Portfolio, Institutional Class | 0,13 | -69,69 | 0,13 | -69,78 | 0,0095 | -0,0232 |