Grundlæggende statistik
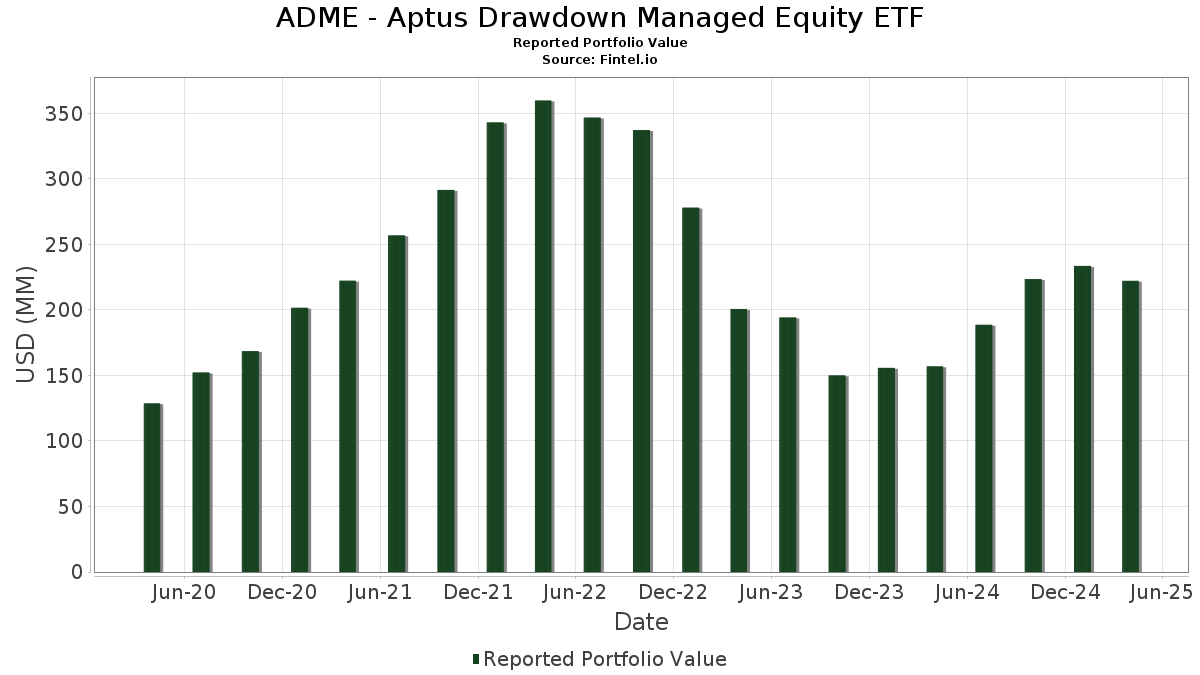
| Porteføljeværdi | $ 222.126.150 |
| Nuværende stillinger | 88 |
Seneste beholdninger, ydeevne, AUM (fra 13F, 13D)
ADME - Aptus Drawdown Managed Equity ETF har afsløret 88 samlede besiddelser i deres seneste SEC-arkivering. Den seneste porteføljeværdi er beregnet til at være $ 222.126.150 USD. Faktiske aktiver under forvaltning (AUM) er denne værdi plus kontanter (som ikke er oplyst). ADME - Aptus Drawdown Managed Equity ETFs største beholdninger er Apple Inc. (US:AAPL) , Microsoft Corporation (US:MSFT) , NVIDIA Corporation (US:NVDA) , Amazon.com, Inc. (US:AMZN) , and Alphabet Inc. (US:GOOG) . ADME - Aptus Drawdown Managed Equity ETFs nye stillinger omfatter The Coca-Cola Company (US:KO) , International Business Machines Corporation (US:IBM) , General Electric Company (US:GE) , Uber Technologies, Inc. (US:UBER) , and QUALCOMM Incorporated (US:QCOM) .
Top øger dette kvartal
Vi bruger ændringen i porteføljeallokeringen, fordi dette er den mest meningsfulde metrik. Ændringer kan skyldes handler eller ændringer i aktiekurser.
| Sikkerhed | Aktier (MM) |
Værdi (MM$) |
Portefølje % | ΔPortefølje % |
|---|---|---|---|---|
| 0,01 | 3,75 | 1,6864 | 1,2529 | |
| 0,03 | 2,38 | 1,0720 | 1,0720 | |
| 1,47 | 0,6608 | 0,6608 | ||
| 0,01 | 1,07 | 0,4817 | 0,4817 | |
| 0,00 | 1,06 | 0,4747 | 0,4747 | |
| 0,01 | 1,04 | 0,4667 | 0,4667 | |
| 0,03 | 3,09 | 1,3902 | 0,4434 | |
| 0,01 | 4,68 | 2,1031 | 0,4064 | |
| 0,02 | 4,32 | 1,9403 | 0,3823 | |
| 0,00 | 4,00 | 1,7983 | 0,3728 |
Top falder i dette kvartal
Vi bruger ændringen i porteføljeallokeringen, fordi dette er den mest meningsfulde metrik. Ændringer kan skyldes handler eller ændringer i aktiekurser.
| Sikkerhed | Aktier (MM) |
Værdi (MM$) |
Portefølje % | ΔPortefølje % |
|---|---|---|---|---|
| 0,00 | 2,32 | 1,0414 | -0,8297 | |
| 0,04 | 8,14 | 3,6570 | -0,6956 | |
| 0,00 | 1,13 | 0,5074 | -0,6852 | |
| 0,05 | 7,93 | 3,5660 | -0,6615 | |
| 0,01 | 0,68 | 0,3074 | -0,5882 | |
| 0,03 | 4,93 | 2,2149 | -0,5738 | |
| 0,01 | 1,20 | 0,5384 | -0,5529 | |
| 0,01 | 3,78 | 1,6979 | -0,5366 | |
| 0,01 | 2,10 | 0,9438 | -0,4163 | |
| 0,02 | 3,91 | 1,7584 | -0,4108 |
13F og Fondsarkivering
Denne formular blev indsendt den 2025-06-27 for rapporteringsperioden 2025-04-30. Klik på linkikonet for at se den fulde transaktionshistorik.
Opgrader for at låse op for premium-data og eksportere til Excel ![]() .
.
| Sikkerhed | Type | Gennemsnitlig aktiekurs | Aktier (MM) |
Δ Aktier (%) |
Δ Aktier (%) |
Værdi ($MM) |
Portefølje (%) |
ΔPortefølje (%) |
|
|---|---|---|---|---|---|---|---|---|---|
| AAPL / Apple Inc. | 0,07 | 2,79 | 15,14 | -7,45 | 6,8059 | -0,1487 | |||
| MSFT / Microsoft Corporation | 0,03 | 2,41 | 13,79 | -2,48 | 6,1989 | 0,1872 | |||
| NVDA / NVIDIA Corporation | 0,12 | -0,66 | 12,55 | -9,89 | 5,6398 | -0,2794 | |||
| AMZN / Amazon.com, Inc. | 0,04 | 2,41 | 8,14 | -20,54 | 3,6570 | -0,6956 | |||
| GOOG / Alphabet Inc. | 0,05 | 1,95 | 7,93 | -20,22 | 3,5660 | -0,6615 | |||
| META / Meta Platforms, Inc. | 0,01 | 3,08 | 5,64 | -17,89 | 2,5362 | -0,3850 | |||
| AVGO / Broadcom Inc. | 0,03 | -13,64 | 4,93 | -24,88 | 2,2149 | -0,5738 | |||
| V / Visa Inc. | 0,01 | 3,02 | 4,80 | 4,14 | 2,1589 | 0,1982 | |||
| BRK.B / Berkshire Hathaway Inc. | 0,01 | 3,03 | 4,68 | 17,21 | 2,1031 | 0,4064 | |||
| PGR / The Progressive Corporation | 0,02 | 3,03 | 4,32 | 17,79 | 1,9403 | 0,3823 | |||
| SYK / Stryker Corporation | 0,01 | 3,04 | 4,19 | -1,53 | 1,8818 | 0,0743 | |||
| NFLX / Netflix, Inc. | 0,00 | 2,97 | 4,00 | 19,30 | 1,7983 | 0,3728 | |||
| JPM / JPMorgan Chase & Co. | 0,02 | -16,22 | 3,91 | -23,34 | 1,7584 | -0,4108 | |||
| XOM / Exxon Mobil Corporation | 0,04 | 4,34 | 3,88 | 3,19 | 1,7442 | 0,1453 | |||
| NOW / ServiceNow, Inc. | 0,00 | 3,05 | 3,88 | -3,37 | 1,7420 | 0,0371 | |||
| TSLA / Tesla, Inc. | 0,01 | 3,05 | 3,78 | -28,14 | 1,6979 | -0,5366 | |||
| ELV / Elevance Health, Inc. | 0,01 | 246,14 | 3,75 | 268,11 | 1,6864 | 1,2529 | |||
| LLY / Eli Lilly and Company | 0,00 | 2,94 | 3,40 | 14,07 | 1,5279 | 0,2613 | |||
| WMT / Walmart Inc. | 0,03 | 3,04 | 3,18 | 2,09 | 1,4304 | 0,1052 | |||
| OTIS / Otis Worldwide Corporation | 0,03 | -29,64 | 3,09 | -4,12 | 1,3902 | 0,4434 | |||
| SO / The Southern Company | 0,03 | 13,24 | 2,76 | 23,95 | 1,2427 | 0,2945 | |||
| BLK / BlackRock, Inc. | 0,00 | 3,02 | 2,62 | -12,42 | 1,1791 | -0,0943 | |||
| COST / Costco Wholesale Corporation | 0,00 | 3,05 | 2,62 | 4,59 | 1,1788 | 0,1128 | |||
| MCD / McDonald's Corporation | 0,01 | 3,01 | 2,56 | 14,05 | 1,1498 | 0,1964 | |||
| PG / The Procter & Gamble Company | 0,02 | 39,88 | 2,47 | 37,05 | 1,1108 | 0,3440 | |||
| HD / The Home Depot, Inc. | 0,01 | -13,71 | 2,43 | -6,82 | 1,0933 | -0,2407 | |||
| KO / The Coca-Cola Company | 0,03 | 2,38 | 1,0720 | 1,0720 | |||||
| MS / Morgan Stanley | 0,02 | 3,04 | 2,37 | -14,10 | 1,0651 | -0,1074 | |||
| ISRG / Intuitive Surgical, Inc. | 0,00 | 2,97 | 2,36 | -7,11 | 1,0624 | -0,0195 | |||
| INTU / Intuit Inc. | 0,00 | 2,99 | 2,33 | 7,47 | 1,0484 | 0,1255 | |||
| NOC / Northrop Grumman Corporation | 0,00 | -20,21 | 2,32 | -17,67 | 1,0414 | -0,8297 | |||
| TJX / The TJX Companies, Inc. | 0,02 | 3,05 | 2,25 | 6,29 | 1,0097 | 0,1110 | |||
| MAR / Marriott International, Inc. | 0,01 | 3,02 | 2,25 | -15,41 | 1,0094 | -0,1193 | |||
| LIN / Linde plc | 0,00 | -26,39 | 2,24 | -25,23 | 1,0075 | -0,2667 | |||
| CTAS / Cintas Corporation | 0,01 | 3,05 | 2,23 | 8,76 | 1,0044 | 0,1309 | |||
| FI / Fiserv, Inc. | 0,01 | 3,03 | 2,22 | -12,00 | 0,9987 | -0,0744 | |||
| MMC / Marsh & McLennan Companies, Inc. | 0,01 | 3,05 | 2,15 | 7,13 | 0,9656 | 0,1132 | |||
| AMAT / Applied Materials, Inc. | 0,01 | -21,46 | 2,10 | -34,39 | 0,9438 | -0,4163 | |||
| BAC / Bank of America Corporation | 0,05 | 3,05 | 2,09 | -11,23 | 0,9414 | -0,0617 | |||
| TMUS / T-Mobile US, Inc. | 0,01 | -14,81 | 2,07 | -9,68 | 0,9315 | -0,0441 | |||
| TMO / Thermo Fisher Scientific Inc. | 0,00 | 3,19 | 2,06 | -25,94 | 0,9281 | -0,2571 | |||
| HON / Honeywell International Inc. | 0,01 | 3,01 | 2,03 | -3,05 | 0,9140 | 0,0221 | |||
| CRWD / CrowdStrike Holdings, Inc. | 0,00 | 2,99 | 1,95 | 10,97 | 0,8775 | 0,1295 | |||
| MSI / Motorola Solutions, Inc. | 0,00 | 2,98 | 1,92 | -3,32 | 0,8631 | 0,0185 | |||
| DUK / Duke Energy Corporation | 0,02 | 20,06 | 1,91 | 30,82 | 0,8571 | 0,2374 | |||
| ADI / Analog Devices, Inc. | 0,01 | 3,02 | 1,88 | -5,21 | 0,8430 | 0,0017 | |||
| CSX / CSX Corporation | 0,07 | -0,50 | 1,87 | -15,05 | 0,8400 | -0,0950 | |||
| ICE / Intercontinental Exchange, Inc. | 0,01 | 3,01 | 1,79 | 8,27 | 0,8065 | 0,1019 | |||
| ABBV / AbbVie Inc. | 0,01 | 3,05 | 1,78 | 9,33 | 0,8012 | 0,1081 | |||
| AMT / American Tower Corporation | 0,01 | 35,33 | 1,73 | 56,00 | 0,7779 | 0,0666 | |||
| ABT / Abbott Laboratories | 0,01 | -20,31 | 1,66 | -18,54 | 0,7468 | -0,1204 | |||
| MKC / McCormick & Company, Incorporated | 0,02 | 3,05 | 1,62 | 2,28 | 0,7273 | 0,0548 | |||
| DE / Deere & Company | 0,00 | 3,01 | 1,62 | 0,19 | 0,7268 | 0,0408 | |||
| MO / Altria Group, Inc. | 0,03 | 3,05 | 1,53 | 16,65 | 0,6899 | 0,1308 | |||
| PHM / PulteGroup, Inc. | 0,01 | 3,02 | 1,53 | -7,10 | 0,6880 | -0,0125 | |||
| SPX US 07/18/25 P3500 / DE (N/A) | 1,47 | 0,6608 | 0,6608 | ||||||
| C / Citigroup Inc. - Corporate Bond/Note | 0,02 | 3,05 | 1,47 | -13,44 | 0,6605 | -0,0614 | |||
| DLR / Digital Realty Trust, Inc. | 0,01 | 3,05 | 1,46 | 0,97 | 0,6584 | 0,0416 | |||
| BMY / Bristol-Myers Squibb Company | 0,03 | 3,03 | 1,46 | -12,24 | 0,6578 | -0,0513 | |||
| FANG / Diamondback Energy, Inc. | 0,01 | 15,12 | 1,44 | -7,50 | 0,6491 | -0,0148 | |||
| TYL / Tyler Technologies, Inc. | 0,00 | 2,90 | 1,27 | -7,09 | 0,5717 | -0,0102 | |||
| VRTX / Vertex Pharmaceuticals Incorporated | 0,00 | 2,87 | 1,21 | 13,56 | 0,5423 | 0,0905 | |||
| ETN / Eaton Corporation plc | 0,00 | 3,03 | 1,20 | -7,13 | 0,5392 | -0,0097 | |||
| JNJ / Johnson & Johnson | 0,01 | -49,77 | 1,20 | -50,90 | 0,5384 | -0,5529 | |||
| ACN / Accenture plc | 0,00 | -48,22 | 1,13 | -59,79 | 0,5074 | -0,6852 | |||
| ORCL / Oracle Corporation | 0,01 | 1,07 | 0,4817 | 0,4817 | |||||
| BR / Broadridge Financial Solutions, Inc. | 0,00 | 2,95 | 1,07 | 4,72 | 0,4790 | 0,0466 | |||
| IBM / International Business Machines Corporation | 0,00 | 1,06 | 0,4747 | 0,4747 | |||||
| GE / General Electric Company | 0,01 | 1,04 | 0,4667 | 0,4667 | |||||
| PSA / Public Storage | 0,00 | 3,05 | 1,04 | 3,70 | 0,4659 | 0,0411 | |||
| SHW / The Sherwin-Williams Company | 0,00 | 2,94 | 0,96 | 1,37 | 0,4337 | 0,0293 | |||
| EOG / EOG Resources, Inc. | 0,01 | 3,03 | 0,95 | -9,65 | 0,4255 | -0,0198 | |||
| NEM / Newmont Corporation | 0,02 | 3,05 | 0,88 | 27,00 | 0,3937 | 0,1007 | |||
| AMGN / Amgen Inc. | 0,00 | 2,92 | 0,86 | 4,88 | 0,3867 | 0,0381 | |||
| NEE / NextEra Energy, Inc. | 0,01 | -38,83 | 0,86 | -42,81 | 0,3844 | -0,2515 | |||
| UBER / Uber Technologies, Inc. | 0,01 | 0,81 | 0,3658 | 0,3658 | |||||
| QCOM / QUALCOMM Incorporated | 0,01 | 0,77 | 0,3456 | 0,3456 | |||||
| ADP / Automatic Data Processing, Inc. | 0,00 | 2,91 | 0,76 | 2,14 | 0,3436 | 0,0253 | |||
| CMCSA / Comcast Corporation | 0,02 | 3,04 | 0,72 | 4,64 | 0,3250 | 0,0314 | |||
| TXN / Texas Instruments Incorporated | 0,00 | 0,70 | 0,3143 | 0,3143 | |||||
| WELL / Welltower Inc. | 0,00 | 0,70 | 0,3135 | 0,3135 | |||||
| CARR / Carrier Global Corporation | 0,01 | -83,10 | 0,68 | -77,86 | 0,3074 | -0,5882 | |||
| FXFXX / First American Funds Inc - First American Treasury Obligations Fund Class X | 0,66 | -52,13 | 0,66 | -52,15 | 0,2959 | -0,2888 | |||
| SLB / Schlumberger Limited | 0,01 | 0,29 | 0,45 | -17,19 | 0,2015 | -0,0287 | |||
| SPXW US 05/30/25 C5800 / DE (N/A) | 0,43 | 0,1927 | 0,1927 | ||||||
| SPXW US 04/30/25 P4900 / DE (N/A) | 0,00 | 0,0001 | 0,0001 | ||||||
| PWR / Quanta Services, Inc. | 0,00 | -100,00 | 0,00 | -100,00 | -0,2801 | ||||
| SPXW US 04/30/25 P4500 / DE (N/A) | -0,00 | -0,0001 | -0,0001 | ||||||
| SPX US 07/18/25 P2500 / DE (N/A) | -0,35 | -0,1562 | -0,1562 |