Grundlæggende statistik
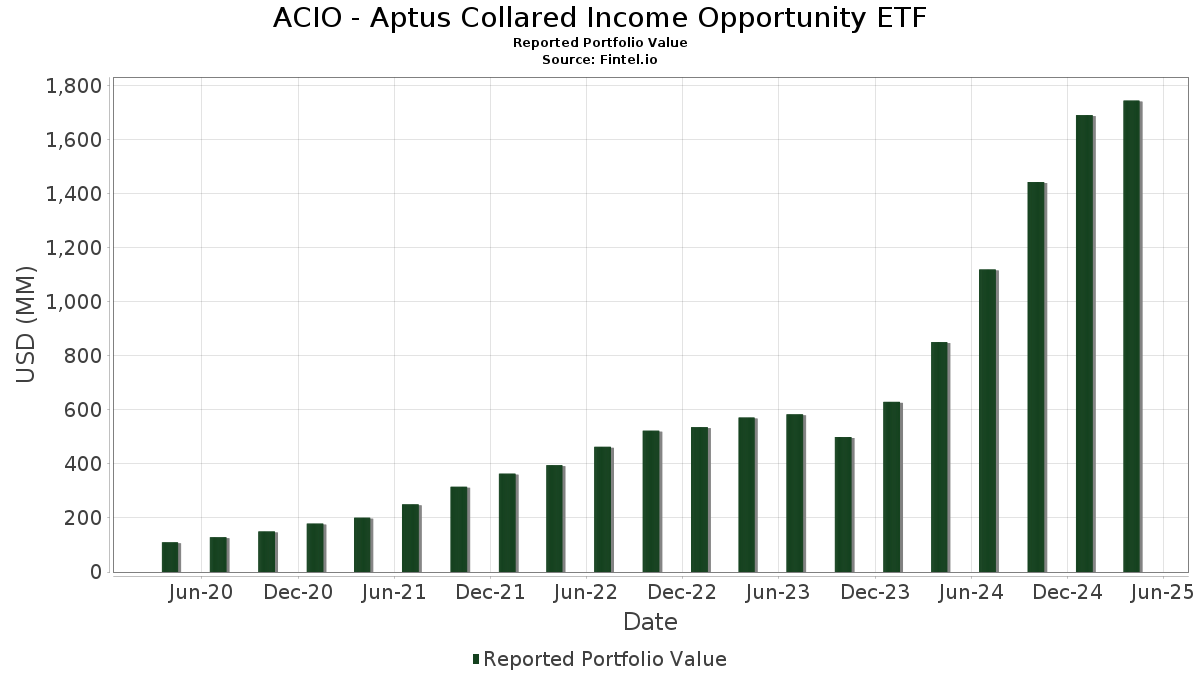
| Porteføljeværdi | $ 1.743.886.386 |
| Nuværende stillinger | 109 |
Seneste beholdninger, ydeevne, AUM (fra 13F, 13D)
ACIO - Aptus Collared Income Opportunity ETF har afsløret 109 samlede besiddelser i deres seneste SEC-arkivering. Den seneste porteføljeværdi er beregnet til at være $ 1.743.886.386 USD. Faktiske aktiver under forvaltning (AUM) er denne værdi plus kontanter (som ikke er oplyst). ACIO - Aptus Collared Income Opportunity ETFs største beholdninger er Apple Inc. (US:AAPL) , Microsoft Corporation (US:MSFT) , NVIDIA Corporation (US:NVDA) , Amazon.com, Inc. (US:AMZN) , and Alphabet Inc. (US:GOOG) . ACIO - Aptus Collared Income Opportunity ETFs nye stillinger omfatter Otis Worldwide Corporation (US:OTIS) , General Electric Company (US:GE) , Uber Technologies, Inc. (US:UBER) , Welltower Inc. (MX:WELL) , and Carrier Global Corporation (US:CARR) .
Top øger dette kvartal
Vi bruger ændringen i porteføljeallokeringen, fordi dette er den mest meningsfulde metrik. Ændringer kan skyldes handler eller ændringer i aktiekurser.
| Sikkerhed | Aktier (MM) |
Værdi (MM$) |
Portefølje % | ΔPortefølje % |
|---|---|---|---|---|
| 28,91 | 1,6536 | 1,6536 | ||
| 0,25 | 24,19 | 1,3834 | 1,3834 | |
| 0,07 | 29,66 | 1,6961 | 1,2607 | |
| 0,26 | 18,92 | 1,0821 | 0,5399 | |
| 0,06 | 8,38 | 0,4795 | 0,4795 | |
| 0,03 | 8,17 | 0,4675 | 0,4675 | |
| 0,04 | 7,92 | 0,4528 | 0,4528 | |
| 0,07 | 37,12 | 2,1230 | 0,4161 | |
| 0,08 | 6,35 | 0,3634 | 0,3634 | |
| 0,12 | 19,54 | 1,1176 | 0,3459 |
Top falder i dette kvartal
Vi bruger ændringen i porteføljeallokeringen, fordi dette er den mest meningsfulde metrik. Ændringer kan skyldes handler eller ændringer i aktiekurser.
| Sikkerhed | Aktier (MM) |
Værdi (MM$) |
Portefølje % | ΔPortefølje % |
|---|---|---|---|---|
| 0,04 | 17,72 | 1,0134 | -0,8435 | |
| 0,03 | 8,84 | 0,5057 | -0,7013 | |
| 0,35 | 64,28 | 3,6765 | -0,6710 | |
| 0,39 | 62,37 | 3,5672 | -0,6507 | |
| 0,20 | 38,07 | 2,1775 | -0,6273 | |
| 0,06 | 9,14 | 0,5228 | -0,5667 | |
| 0,11 | 29,99 | 1,7154 | -0,5154 | |
| 0,11 | 16,08 | 0,9194 | -0,4588 | |
| 0,13 | 30,75 | 1,7586 | -0,4134 | |
| 0,08 | 44,35 | 2,5365 | -0,3779 |
13F og Fondsarkivering
Denne formular blev indsendt den 2025-06-27 for rapporteringsperioden 2025-04-30. Klik på linkikonet for at se den fulde transaktionshistorik.
Opgrader for at låse op for premium-data og eksportere til Excel ![]() .
.
| Sikkerhed | Type | Gennemsnitlig aktiekurs | Aktier (MM) |
Δ Aktier (%) |
Δ Aktier (%) |
Værdi ($MM) |
Portefølje (%) |
ΔPortefølje (%) |
|
|---|---|---|---|---|---|---|---|---|---|
| AAPL / Apple Inc. | 0,56 | 11,32 | 117,95 | 0,23 | 6,7458 | -0,1952 | |||
| MSFT / Microsoft Corporation | 0,27 | 12,00 | 108,58 | 6,66 | 6,2098 | 0,2052 | |||
| NVDA / NVIDIA Corporation | 0,91 | 7,71 | 98,61 | -2,29 | 5,6396 | -0,3130 | |||
| AMZN / Amazon.com, Inc. | 0,35 | 12,40 | 64,28 | -12,79 | 3,6765 | -0,6710 | |||
| GOOG / Alphabet Inc. | 0,39 | 11,46 | 62,37 | -12,78 | 3,5672 | -0,6507 | |||
| META / Meta Platforms, Inc. | 0,08 | 12,68 | 44,35 | -10,24 | 2,5365 | -0,3779 | |||
| AVGO / Broadcom Inc. | 0,20 | -7,95 | 38,07 | -19,93 | 2,1775 | -0,6273 | |||
| V / Visa Inc. | 0,11 | 9,56 | 37,14 | 10,75 | 2,1241 | 0,1461 | |||
| BRK.B / Berkshire Hathaway Inc. | 0,07 | 12,74 | 37,12 | 28,28 | 2,1230 | 0,4161 | |||
| PGR / The Progressive Corporation | 0,12 | 9,56 | 33,38 | 25,25 | 1,9093 | 0,3372 | |||
| SYK / Stryker Corporation | 0,09 | 9,52 | 32,16 | 4,65 | 1,8393 | 0,0268 | |||
| NFLX / Netflix, Inc. | 0,03 | 9,56 | 30,93 | 26,94 | 1,7687 | 0,3318 | |||
| JPM / JPMorgan Chase & Co. | 0,13 | -8,76 | 30,75 | -16,50 | 1,7586 | -0,4134 | |||
| XOM / Exxon Mobil Corporation | 0,29 | 11,66 | 30,35 | 10,40 | 1,7358 | 0,1143 | |||
| TSLA / Tesla, Inc. | 0,11 | 13,72 | 29,99 | -20,70 | 1,7154 | -0,5154 | |||
| NOW / ServiceNow, Inc. | 0,03 | 9,51 | 29,71 | 2,70 | 1,6994 | -0,0071 | |||
| ELV / Elevance Health, Inc. | 0,07 | 277,95 | 29,66 | 301,72 | 1,6961 | 1,2607 | |||
| SPX US 06/20/25 P5300 / DE (N/A) | 28,91 | 1,6536 | 1,6536 | ||||||
| LLY / Eli Lilly and Company | 0,03 | 9,54 | 26,25 | 21,41 | 1,5013 | 0,2260 | |||
| WMT / Walmart Inc. | 0,25 | 9,57 | 24,60 | 8,56 | 1,4069 | 0,0703 | |||
| OTIS / Otis Worldwide Corporation | 0,25 | 24,19 | 1,3834 | 1,3834 | |||||
| SO / The Southern Company | 0,24 | 22,69 | 21,87 | 34,29 | 1,2508 | 0,2902 | |||
| COST / Costco Wholesale Corporation | 0,02 | 9,49 | 20,06 | 11,13 | 1,1475 | 0,0826 | |||
| BLK / BlackRock, Inc. | 0,02 | 9,52 | 20,06 | -6,90 | 1,1473 | -0,1236 | |||
| MCD / McDonald's Corporation | 0,06 | 9,56 | 19,80 | 21,30 | 1,1327 | 0,1697 | |||
| PG / The Procter & Gamble Company | 0,12 | 52,50 | 19,54 | 49,36 | 1,1176 | 0,3459 | |||
| HD / The Home Depot, Inc. | 0,05 | 122,33 | 19,01 | 140,08 | 1,0875 | -0,2654 | |||
| KO / The Coca-Cola Company | 0,26 | 1.184,37 | 18,92 | 1.836,44 | 1,0821 | 0,5399 | |||
| MS / Morgan Stanley | 0,16 | 9,56 | 18,30 | -8,65 | 1,0467 | -0,1350 | |||
| ISRG / Intuitive Surgical, Inc. | 0,04 | 9,37 | 18,19 | -1,36 | 1,0404 | -0,0473 | |||
| INTU / Intuit Inc. | 0,03 | 9,22 | 17,73 | 13,93 | 1,0138 | 0,0961 | |||
| NOC / Northrop Grumman Corporation | 0,04 | 82,24 | 17,72 | 88,07 | 1,0134 | -0,8435 | |||
| LIN / Linde plc | 0,04 | -19,69 | 17,59 | -18,41 | 1,0062 | -0,2657 | |||
| MAR / Marriott International, Inc. | 0,07 | 9,55 | 17,40 | -10,05 | 0,9952 | -0,1459 | |||
| FI / Fiserv, Inc. | 0,09 | 9,57 | 17,14 | -6,39 | 0,9803 | -0,0997 | |||
| TJX / The TJX Companies, Inc. | 0,13 | 9,56 | 17,11 | 12,98 | 0,9788 | 0,0853 | |||
| CTAS / Cintas Corporation | 0,08 | 9,55 | 16,99 | 15,61 | 0,9715 | 0,1049 | |||
| MMC / Marsh & McLennan Companies, Inc. | 0,07 | 9,51 | 16,52 | 13,84 | 0,9446 | 0,0889 | |||
| BAC / Bank of America Corporation | 0,41 | 9,59 | 16,30 | -5,61 | 0,9322 | -0,0862 | |||
| TMUS / T-Mobile US, Inc. | 0,07 | -7,21 | 16,28 | -1,64 | 0,9310 | -0,0451 | |||
| TMO / Thermo Fisher Scientific Inc. | 0,04 | 11,79 | 16,13 | -19,77 | 0,9224 | -0,2633 | |||
| AMAT / Applied Materials, Inc. | 0,11 | -17,67 | 16,08 | -31,20 | 0,9194 | -0,4588 | |||
| HON / Honeywell International Inc. | 0,07 | 9,56 | 15,73 | 3,09 | 0,8995 | -0,0004 | |||
| DUK / Duke Energy Corporation | 0,12 | 30,22 | 15,08 | 41,89 | 0,8625 | 0,2356 | |||
| CRWD / CrowdStrike Holdings, Inc. | 0,04 | 9,43 | 15,04 | 17,89 | 0,8600 | 0,1077 | |||
| MSI / Motorola Solutions, Inc. | 0,03 | 9,35 | 14,74 | 2,63 | 0,8429 | -0,0041 | |||
| CSX / CSX Corporation | 0,52 | 7,04 | 14,61 | -8,59 | 0,8353 | -0,1072 | |||
| ADI / Analog Devices, Inc. | 0,07 | 9,50 | 14,29 | 0,73 | 0,8172 | -0,0195 | |||
| ICE / Intercontinental Exchange, Inc. | 0,08 | 9,52 | 13,83 | 15,10 | 0,7910 | 0,0822 | |||
| ABBV / AbbVie Inc. | 0,07 | 9,50 | 13,58 | 16,17 | 0,7768 | 0,0872 | |||
| AMT / American Tower Corporation | 0,06 | 161,68 | 13,53 | 201,47 | 0,7739 | 0,0615 | |||
| ABT / Abbott Laboratories | 0,10 | -13,05 | 13,02 | -11,14 | 0,7447 | -0,1196 | |||
| MKC / McCormick & Company, Incorporated | 0,16 | 9,58 | 12,41 | 8,78 | 0,7095 | 0,0368 | |||
| DE / Deere & Company | 0,03 | 9,36 | 12,05 | 6,38 | 0,6892 | 0,0211 | |||
| MO / Altria Group, Inc. | 0,20 | 9,57 | 11,85 | 24,08 | 0,6775 | 0,1144 | |||
| PHM / PulteGroup, Inc. | 0,11 | 9,57 | 11,76 | -1,21 | 0,6727 | -0,0296 | |||
| BMY / Bristol-Myers Squibb Company | 0,23 | 9,59 | 11,31 | -6,68 | 0,6469 | -0,0680 | |||
| FANG / Diamondback Energy, Inc. | 0,09 | 24,89 | 11,29 | 0,31 | 0,6459 | -0,0181 | |||
| C / Citigroup Inc. | 0,16 | 9,58 | 11,19 | -7,98 | 0,6403 | -0,0773 | |||
| DLR / Digital Realty Trust, Inc. | 0,07 | 9,51 | 11,16 | 7,29 | 0,6385 | 0,0248 | |||
| TYL / Tyler Technologies, Inc. | 0,02 | 9,57 | 9,89 | -1,05 | 0,5656 | -0,0239 | |||
| VRTX / Vertex Pharmaceuticals Incorporated | 0,02 | 9,51 | 9,33 | 20,85 | 0,5334 | 0,0782 | |||
| ETN / Eaton Corporation plc | 0,03 | 9,51 | 9,17 | -1,25 | 0,5243 | -0,0233 | |||
| JNJ / Johnson & Johnson | 0,06 | -40,65 | 9,14 | -41,97 | 0,5228 | -0,5667 | |||
| ACN / Accenture plc | 0,03 | -44,40 | 8,84 | -56,79 | 0,5057 | -0,7013 | |||
| ORCL / Oracle Corporation | 0,06 | 8,38 | 0,4795 | 0,4795 | |||||
| IBM / International Business Machines Corporation | 0,03 | 8,17 | 0,4675 | 0,4675 | |||||
| BR / Broadridge Financial Solutions, Inc. | 0,03 | 9,30 | 8,15 | 11,22 | 0,4662 | 0,0339 | |||
| GE / General Electric Company | 0,04 | 7,92 | 0,4528 | 0,4528 | |||||
| PSA / Public Storage | 0,03 | 9,35 | 7,82 | 10,06 | 0,4473 | 0,0282 | |||
| EOG / EOG Resources, Inc. | 0,07 | 9,48 | 7,29 | -3,98 | 0,4169 | -0,0308 | |||
| SHW / The Sherwin-Williams Company | 0,02 | 9,32 | 7,24 | 7,72 | 0,4142 | 0,0176 | |||
| FXFXX / First American Funds Inc - First American Treasury Obligations Fund Class X | 7,17 | 2,09 | 7,17 | 2,09 | 0,4100 | -0,0042 | |||
| NEE / NextEra Energy, Inc. | 0,10 | -33,44 | 6,74 | -37,79 | 0,3856 | -0,2537 | |||
| NEM / Newmont Corporation | 0,13 | 9,58 | 6,61 | 35,14 | 0,3781 | 0,0895 | |||
| AMGN / Amgen Inc. | 0,02 | 9,34 | 6,50 | 11,46 | 0,3715 | 0,0277 | |||
| UBER / Uber Technologies, Inc. | 0,08 | 6,35 | 0,3634 | 0,3634 | |||||
| QCOM / QUALCOMM Incorporated | 0,04 | 5,96 | 0,3407 | 0,3407 | |||||
| CMCSA / Comcast Corporation | 0,17 | 9,58 | 5,66 | 11,33 | 0,3238 | 0,0239 | |||
| ADP / Automatic Data Processing, Inc. | 0,02 | 9,29 | 5,62 | 8,41 | 0,3215 | 0,0157 | |||
| TXN / Texas Instruments Incorporated | 0,03 | 5,53 | 0,3161 | 0,3161 | |||||
| WELL / Welltower Inc. | 0,04 | 5,45 | 0,3119 | 0,3119 | |||||
| CARR / Carrier Global Corporation | 0,08 | 5,21 | 0,2980 | 0,2980 | |||||
| SLB / Schlumberger Limited | 0,11 | 8,63 | 3,51 | -10,32 | 0,2007 | -0,0301 | |||
| SPXW US 05/30/25 C5800 / DE (N/A) | 3,43 | 0,1962 | 0,1962 | ||||||
| SPX US 05/16/25 C5800 / DE (N/A) | 2,77 | 0,1587 | 0,1587 | ||||||
| PWR / Quanta Services, Inc. | 0,00 | -100,00 | 0,00 | -100,00 | -0,2854 | ||||
| Deere & Co / DE (N/A) | -0,02 | -0,0010 | -0,0010 | ||||||
| Accenture PLC / DE (N/A) | -0,02 | -0,0013 | -0,0013 | ||||||
| Alphabet Inc / DE (N/A) | -0,03 | -0,0014 | -0,0014 | ||||||
| Crowdstrike Holdings Inc / DE (N/A) | -0,03 | -0,0014 | -0,0014 | ||||||
| Costco Wholesale Corp / DE (N/A) | -0,03 | -0,0020 | -0,0020 | ||||||
| Berkshire Hathaway Inc / DE (N/A) | -0,03 | -0,0020 | -0,0020 | ||||||
| ServiceNow Inc / DE (N/A) | -0,04 | -0,0021 | -0,0021 | ||||||
| Elevance Health Inc / DE (N/A) | -0,04 | -0,0022 | -0,0022 | ||||||
| Altria Group Inc / DE (N/A) | -0,04 | -0,0022 | -0,0022 | ||||||
| McDonald's Corp / DE (N/A) | -0,04 | -0,0023 | -0,0023 | ||||||
| Tesla Inc / DE (N/A) | -0,04 | -0,0023 | -0,0023 | ||||||
| JPMorgan Chase & Co / DE (N/A) | -0,04 | -0,0023 | -0,0023 | ||||||
| Netflix Inc / DE (N/A) | -0,04 | -0,0025 | -0,0025 | ||||||
| Johnson & Johnson / DE (N/A) | -0,04 | -0,0026 | -0,0026 | ||||||
| Analog Devices Inc / DE (N/A) | -0,05 | -0,0026 | -0,0026 | ||||||
| Southern Co/The / DE (N/A) | -0,07 | -0,0038 | -0,0038 | ||||||
| Newmont Corp / DE (N/A) | -0,10 | -0,0055 | -0,0055 | ||||||
| Digital Realty Trust Inc / DE (N/A) | -0,16 | -0,0089 | -0,0089 | ||||||
| SPX US 05/16/25 C6000 / DE (N/A) | -0,26 | -0,0149 | -0,0149 | ||||||
| TJX Cos Inc/The / DE (N/A) | -0,33 | -0,0190 | -0,0190 | ||||||
| Progressive Corp/The / DE (N/A) | -0,36 | -0,0209 | -0,0209 | ||||||
| Walmart Inc / DE (N/A) | -1,43 | -0,0818 | -0,0818 | ||||||
| SPX US 06/20/25 P4600 / DE (N/A) | -5,28 | -0,3020 | -0,3020 |