Grundlæggende statistik
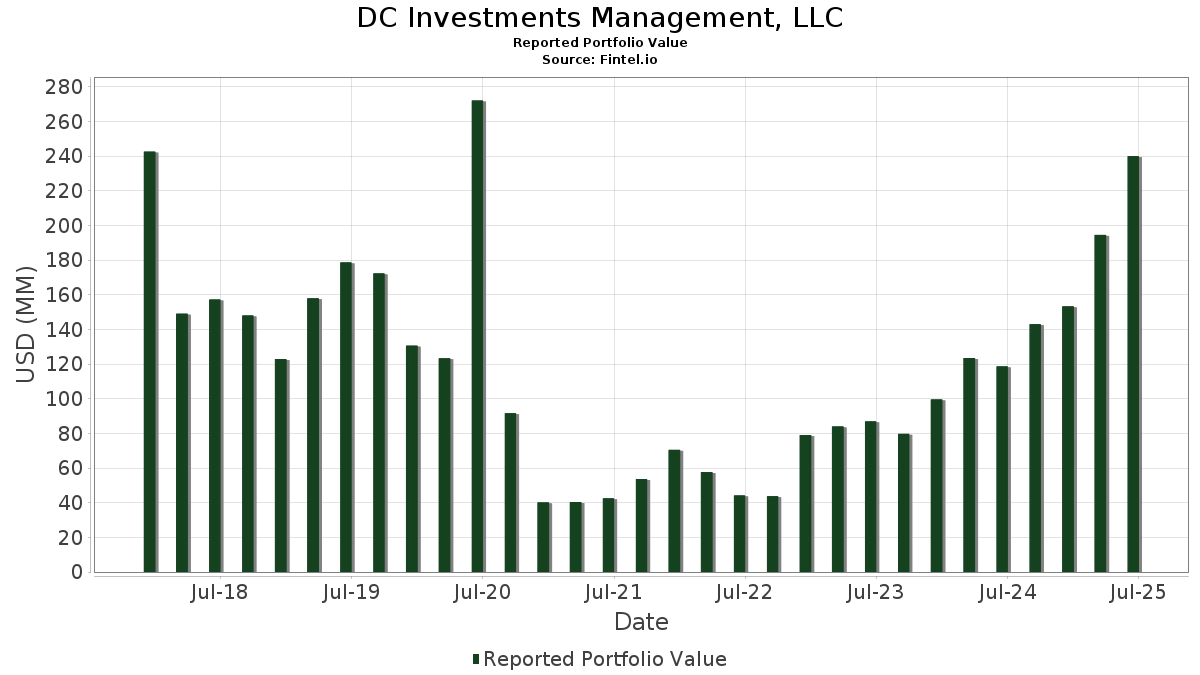
| Porteføljeværdi | $ 226.098.625 |
| Nuværende stillinger | 48 |
Seneste beholdninger, ydeevne, AUM (fra 13F, 13D)
DC Investments Management, LLC har afsløret 48 samlede besiddelser i deres seneste SEC-arkivering. Den seneste porteføljeværdi er beregnet til at være $ 226.098.625 USD. Faktiske aktiver under forvaltning (AUM) er denne værdi plus kontanter (som ikke er oplyst). DC Investments Management, LLCs største beholdninger er Vanguard International Equity Index Funds - Vanguard Total World Stock ETF (US:VT) , ASML Holding N.V. - Depositary Receipt (Common Stock) (US:ASML) , Piedmont Realty Trust, Inc. (US:PDM) , UnitedHealth Group Incorporated (US:UNH) , and EQT Corporation (US:EQT) .
Top øger dette kvartal
Vi bruger ændringen i porteføljeallokeringen, fordi dette er den mest meningsfulde metrik. Ændringer kan skyldes handler eller ændringer i aktiekurser.
| Sikkerhed | Aktier (MM) |
Værdi (MM$) |
Portefølje % | ΔPortefølje % |
|---|---|---|---|---|
| VT / Vanguard International Equity Index Funds - Vanguard Total World Stock ETF | 0,83 | 117,47 | 51,9539 | 7,8120 |
| ASML / ASML Holding N.V. - Depositary Receipt (Common Stock) | 0,01 | 9,40 | 4,1583 | 0,6292 |
| J0J / Amrize AG | 0,08 | 4,34 | 1,9182 | 0,3038 |
| CNX / CNX Resources Corporation | 0,07 | 2,64 | 1,1660 | 0,2836 |
| AR / Antero Resources Corporation | 0,13 | 4,44 | 1,9637 | 0,2539 |
| 0QF / Moderna, Inc. | 0,07 | 2,02 | 0,8951 | 0,1598 |
| BKH / Black Hills Corporation | 0,03 | 2,08 | 0,9180 | 0,1541 |
| NWE / NorthWestern Energy Group, Inc. | 0,03 | 2,13 | 0,9413 | 0,1396 |
| POR / Portland General Electric Company | 0,04 | 1,96 | 0,8649 | 0,1212 |
| TWLO / Twilio Inc. | 0,00 | 0,63 | 0,2784 | 0,0947 |
Top falder i dette kvartal
Vi bruger ændringen i porteføljeallokeringen, fordi dette er den mest meningsfulde metrik. Ændringer kan skyldes handler eller ændringer i aktiekurser.
| Sikkerhed | Aktier (MM) |
Værdi (MM$) |
Portefølje % | ΔPortefølje % |
|---|---|---|---|---|
| PDM / Piedmont Realty Trust, Inc. | 0,74 | 6,21 | -2,7801 | |
| UNH / UnitedHealth Group Incorporated | 0,02 | 5,51 | -2,3909 | |
| EQT / EQT Corporation | 0,10 | 5,26 | -2,1292 | |
| EXE / Expand Energy Corporation | 0,05 | 5,04 | -1,9286 | |
| GPOR / Gulfport Energy Corporation | 0,02 | 5,09 | -1,7591 | |
| GOGO / Gogo Inc. | 0,39 | 1,79 | -1,3724 | |
| MELI / MercadoLibre, Inc. | 0,00 | 4,72 | -1,3494 | |
| DVN / Devon Energy Corporation | 0,08 | 2,95 | -1,0892 | |
| CTRA / Coterra Energy Inc. | 0,10 | 2,71 | -0,9297 | |
| PR / Permian Resources Corporation | 0,19 | 2,61 | -0,9078 |
13F og Fondsarkivering
Denne formular blev indsendt den 2026-02-13 for rapporteringsperioden 2025-12-31. Klik på linkikonet for at se den fulde transaktionshistorik.
Opgrader for at låse op for premium-data og eksportere til Excel ![]() .
.
| Sikkerhed | Type | Gennemsnitlig aktiekurs | Aktier (MM) |
Δ Aktier (%) |
Værdi ($MM) |
ΔVærdi (%) |
Portefølje (%) |
ΔPortefølje (%) |
|
|---|---|---|---|---|---|---|---|---|---|
| VT / Vanguard International Equity Index Funds - Vanguard Total World Stock ETF | 0,83 | 7,84 | 117,47 | 10,39 | 51,9539 | 7,8120 | |||
| ASML / ASML Holding N.V. - Depositary Receipt (Common Stock) | 0,01 | 0,00 | 9,40 | 10,51 | 4,1583 | 0,6292 | |||
| PDM / Piedmont Realty Trust, Inc. | 0,74 | 0,00 | 6,21 | -7,33 | -2,7801 | ||||
| UNH / UnitedHealth Group Incorporated | 0,02 | 0,00 | 5,51 | -4,39 | -2,3909 | ||||
| EQT / EQT Corporation | 0,10 | 4,03 | 5,26 | 2,46 | -2,1292 | ||||
| GPOR / Gulfport Energy Corporation | 0,02 | 4,38 | 5,09 | 19,98 | -1,7591 | ||||
| EXE / Expand Energy Corporation | 0,05 | 4,35 | 5,04 | 8,39 | -1,9286 | ||||
| MELI / MercadoLibre, Inc. | 0,00 | 68,25 | 4,72 | 45,00 | -1,3494 | ||||
| AR / Antero Resources Corporation | 0,13 | 4,91 | 4,44 | 7,72 | 1,9637 | 0,2539 | |||
| J0J / Amrize AG | 0,08 | 0,00 | 4,34 | 11,46 | 1,9182 | 0,3038 | |||
| UBER / Uber Technologies, Inc. | 0,05 | 0,00 | 4,15 | -16,59 | 1,8365 | -0,2287 | |||
| DVN / Devon Energy Corporation | 0,08 | 7,67 | 2,95 | 12,50 | -1,0892 | ||||
| CTRA / Coterra Energy Inc. | 0,10 | 8,56 | 2,71 | 20,79 | -0,9297 | ||||
| CNX / CNX Resources Corporation | 0,07 | 8,26 | 2,64 | 23,93 | 1,1660 | 0,2836 | |||
| RRC / Range Resources Corporation | 0,07 | 8,65 | 2,62 | 1,79 | 1,1597 | 0,0910 | |||
| PR / Permian Resources Corporation | 0,19 | 8,64 | 2,61 | 19,10 | -0,9078 | ||||
| NWE / NorthWestern Energy Group, Inc. | 0,03 | 0,00 | 2,13 | 10,14 | 0,9413 | 0,1396 | |||
| AEP / American Electric Power Company, Inc. | 0,02 | 0,00 | 2,10 | 2,49 | 0,9298 | 0,0790 | |||
| ATO / Atmos Energy Corporation | 0,01 | 0,00 | 2,08 | -1,84 | 0,9222 | 0,0412 | |||
| BKH / Black Hills Corporation | 0,03 | 0,00 | 2,08 | 12,71 | 0,9180 | 0,1541 | |||
| ES / Eversource Energy | 0,03 | 0,00 | 2,05 | -5,35 | 0,9074 | 0,0082 | |||
| 0QF / Moderna, Inc. | 0,07 | 0,00 | 2,02 | 14,16 | 0,8951 | 0,1598 | |||
| EVRG / Evergy, Inc. | 0,03 | 0,00 | 2,02 | -4,67 | -0,8786 | ||||
| NI / NiSource Inc. | 0,05 | 0,00 | 1,96 | -3,54 | 0,8674 | 0,0239 | |||
| POR / Portland General Electric Company | 0,04 | 0,00 | 1,96 | 9,04 | 0,8649 | 0,1212 | |||
| EXC / Exelon Corporation | 0,04 | 0,00 | 1,93 | -3,12 | 0,8519 | 0,0269 | |||
| AEE / Ameren Corporation | 0,02 | 0,00 | 1,90 | -4,29 | -0,8217 | ||||
| PPL / PPL Corporation | 0,05 | 0,00 | 1,87 | -5,74 | -0,8241 | ||||
| ED / Consolidated Edison, Inc. | 0,02 | 0,00 | 1,84 | -1,18 | -0,7732 | ||||
| GOGO / Gogo Inc. | 0,39 | 0,00 | 1,79 | -45,77 | -1,3724 | ||||
| OGE / OGE Energy Corp. | 0,04 | 0,00 | 1,77 | -7,71 | -0,7964 | ||||
| UTL / Unitil Corporation | 0,03 | 0,00 | 1,59 | 1,21 | -0,6523 | ||||
| NET / Cloudflare, Inc. | 0,01 | 0,00 | 1,09 | -8,17 | 0,4824 | -0,0101 | |||
| U / Unity Software Inc. | 0,02 | 0,00 | 0,89 | 10,37 | -0,3363 | ||||
| CRWD / CrowdStrike Holdings, Inc. | 0,00 | 0,00 | 0,81 | -4,39 | -0,3501 | ||||
| ZS / Zscaler, Inc. | 0,00 | 0,00 | 0,75 | -25,00 | -0,4149 | ||||
| RBRK / Rubrik, Inc. | 0,01 | 0,00 | 0,71 | -6,96 | -0,3160 | ||||
| DOCN / DigitalOcean Holdings, Inc. | 0,01 | 0,00 | 0,67 | 40,84 | -0,1971 | ||||
| PANW / Palo Alto Networks, Inc. | 0,00 | 0,00 | 0,65 | -9,51 | -0,2967 | ||||
| OKTA / Okta, Inc. | 0,01 | 0,00 | 0,64 | -5,75 | -0,2813 | ||||
| TWLO / Twilio Inc. | 0,00 | 0,00 | 0,63 | 42,31 | 0,2784 | 0,0947 | |||
| GEN / Gen Digital Inc. | 0,02 | 0,00 | 0,62 | -4,35 | 0,2724 | 0,0056 | |||
| QLYS / Qualys, Inc. | 0,00 | 0,00 | 0,60 | 0,50 | -0,2492 | ||||
| MSFT / Microsoft Corporation | 0,00 | 0,00 | 0,55 | -6,60 | -0,2454 | ||||
| ADSK / Autodesk, Inc. | 0,00 | 0,00 | 0,49 | -6,79 | 0,2188 | -0,0014 | |||
| ZM / Zoom Communications, Inc. | 0,01 | 0,00 | 0,49 | 4,51 | -0,1935 | ||||
| SNPS / Synopsys, Inc. | 0,00 | 0,00 | 0,23 | -4,98 | -0,1001 | ||||
| TCRX / TScan Therapeutics, Inc. | 0,04 | 0,00 | 0,04 | -45,31 | -0,0268 | ||||
| TENB / Tenable Holdings, Inc. | 0,00 | -100,00 | 0,00 | 0,0000 | |||||
| CRM / Salesforce, Inc. | 0,00 | -100,00 | 0,00 | 0,0000 | |||||
| S / SentinelOne, Inc. | 0,00 | -100,00 | 0,00 | 0,0000 | |||||
| GTLB / GitLab Inc. | 0,00 | -100,00 | 0,00 | 0,0000 | |||||
| DBX / Dropbox, Inc. | 0,00 | -100,00 | 0,00 | 0,0000 | |||||
| TOST / Toast, Inc. | 0,00 | -100,00 | 0,00 | 0,0000 | |||||
| ADBE / Adobe Inc. | 0,00 | -100,00 | 0,00 | 0,0000 | |||||
| LSPD / Lightspeed Commerce Inc. | 0,00 | -100,00 | 0,00 | 0,0000 | |||||
| FTNT / Fortinet, Inc. | 0,00 | -100,00 | 0,00 | 0,0000 | |||||
| PTC / PTC Inc. | 0,00 | -100,00 | 0,00 | 0,0000 | |||||
| CVLT / Commvault Systems, Inc. | 0,00 | -100,00 | 0,00 | 0,0000 | |||||
| AVPT / AvePoint, Inc. | 0,00 | -100,00 | 0,00 | 0,0000 | |||||
| SLP / Simulations Plus, Inc. | 0,00 | -100,00 | 0,00 | 0,0000 | |||||
| CWAN / Clearwater Analytics Holdings, Inc. | 0,00 | -100,00 | 0,00 | 0,0000 | |||||
| KOP / Koppers Holdings Inc. | 0,00 | -100,00 | 0,00 | 0,0000 | |||||
| TBI / TrueBlue, Inc. | 0,00 | -100,00 | 0,00 | 0,0000 | |||||
| BOX / Box, Inc. | 0,00 | -100,00 | 0,00 | 0,0000 | |||||
| RPD / Rapid7, Inc. | 0,00 | -100,00 | 0,00 | 0,0000 | |||||
| HZO / MarineMax, Inc. | 0,00 | -100,00 | 0,00 | 0,0000 | |||||
| WEAV / Weave Communications, Inc. | 0,00 | -100,00 | 0,00 | 0,0000 | |||||
| WIX / Wix.com Ltd. | 0,00 | -100,00 | 0,00 | 0,0000 | |||||
| NCNO / nCino, Inc. | 0,00 | -100,00 | 0,00 | 0,0000 | |||||
| NTNX / Nutanix, Inc. | 0,00 | -100,00 | 0,00 | 0,0000 | |||||
| TBLA / Taboola.com Ltd. | 0,00 | -100,00 | 0,00 | -100,00 | -0,7560 | ||||
| BL / BlackLine, Inc. | 0,00 | -100,00 | 0,00 | 0,0000 | |||||
| CMCO / Columbus McKinnon Corporation | 0,00 | -100,00 | 0,00 | 0,0000 | |||||
| INTA / Intapp, Inc. | 0,00 | -100,00 | 0,00 | 0,0000 | |||||
| MTDR / Matador Resources Company | 0,00 | -100,00 | 0,00 | 0,0000 | |||||
| CXM / Sprinklr, Inc. | 0,00 | -100,00 | 0,00 | 0,0000 | |||||
| MITK / Mitek Systems, Inc. | 0,00 | -100,00 | 0,00 | 0,0000 | |||||
| AKAM / Akamai Technologies, Inc. | 0,00 | -100,00 | 0,00 | 0,0000 | |||||
| PCTY / Paylocity Holding Corporation | 0,00 | -100,00 | 0,00 | 0,0000 | |||||
| NABL / N-able, Inc. | 0,00 | -100,00 | 0,00 | 0,0000 | |||||
| BRZE / Braze, Inc. | 0,00 | -100,00 | 0,00 | 0,0000 | |||||
| SPSC / SPS Commerce, Inc. | 0,00 | -100,00 | 0,00 | 0,0000 | |||||
| JELD / JELD-WEN Holding, Inc. | 0,00 | -100,00 | 0,00 | 0,0000 | |||||
| XYZ / Block, Inc. | 0,00 | -100,00 | 0,00 | 0,0000 | |||||
| TEAD / Teads Holding Co. | 0,00 | -100,00 | 0,00 | 0,0000 | |||||
| RNG / RingCentral, Inc. | 0,00 | -100,00 | 0,00 | 0,0000 | |||||
| EVH / Evolent Health, Inc. | 0,00 | -100,00 | 0,00 | -100,00 | -0,1425 | ||||
| VRNS / Varonis Systems, Inc. | 0,00 | -100,00 | 0,00 | 0,0000 | |||||
| BIGC / Commerce.com, Inc. | 0,00 | -100,00 | 0,00 | -100,00 | -0,1634 | ||||
| SPT / Sprout Social, Inc. | 0,00 | -100,00 | 0,00 | 0,0000 | |||||
| AVDX / AvidXchange Holdings, Inc. | 0,00 | -100,00 | 0,00 | 0,0000 | |||||
| WK / Workiva Inc. | 0,00 | -100,00 | 0,00 | 0,0000 | |||||
| DV / DoubleVerify Holdings, Inc. | 0,00 | -100,00 | 0,00 | 0,0000 | |||||
| TEAM / Atlassian Corporation | 0,00 | -100,00 | 0,00 | 0,0000 |