Grundlæggende statistik
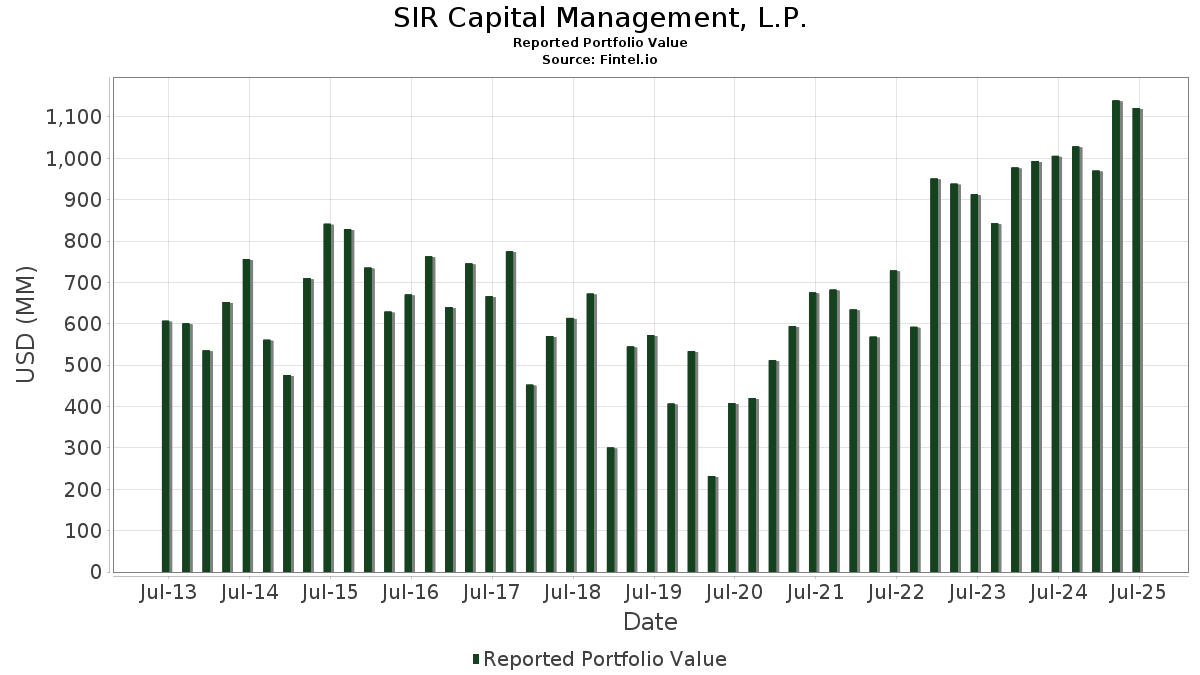
| Porteføljeværdi | $ 1.121.051.657 |
| Nuværende stillinger | 87 |
Seneste beholdninger, ydeevne, AUM (fra 13F, 13D)
SIR Capital Management, L.P. har afsløret 87 samlede besiddelser i deres seneste SEC-arkivering. Den seneste porteføljeværdi er beregnet til at være $ 1.121.051.657 USD. Faktiske aktiver under forvaltning (AUM) er denne værdi plus kontanter (som ikke er oplyst). SIR Capital Management, L.P.s største beholdninger er Kinder Morgan, Inc. (US:KMI) , Coterra Energy Inc. (US:CTRA) , Viper Energy, Inc. (US:VNOM) , Permian Resources Corporation (US:PR) , and TC Energy Corporation (US:TRP) . SIR Capital Management, L.P.s nye stillinger omfatter Vertiv Holdings Co (US:VRT) , Fluor Corporation (US:FLR) , Atlas Energy Solutions Inc. (US:AESI) , Emerson Electric Co. (US:EMR) , and ITT Inc. (US:ITT) .
Top øger dette kvartal
Vi bruger ændringen i porteføljeallokeringen, fordi dette er den mest meningsfulde metrik. Ændringer kan skyldes handler eller ændringer i aktiekurser.
| Sikkerhed | Aktier (MM) |
Værdi (MM$) |
Portefølje % | ΔPortefølje % |
|---|---|---|---|---|
| 0,74 | 42,98 | 3,8343 | 2,6022 | |
| 1,27 | 40,26 | 3,5913 | 2,3538 | |
| 1,39 | 31,26 | 2,7887 | 2,2194 | |
| 0,69 | 25,77 | 2,2984 | 1,6774 | |
| 1,53 | 58,32 | 5,2020 | 1,3912 | |
| 0,35 | 15,13 | 1,3498 | 1,3498 | |
| 1,66 | 14,76 | 1,3166 | 1,3083 | |
| 0,12 | 14,41 | 1,2856 | 1,2856 | |
| 0,41 | 12,08 | 1,0778 | 0,9699 | |
| 0,08 | 10,67 | 0,9521 | 0,9521 |
Top falder i dette kvartal
Vi bruger ændringen i porteføljeallokeringen, fordi dette er den mest meningsfulde metrik. Ændringer kan skyldes handler eller ændringer i aktiekurser.
| Sikkerhed | Aktier (MM) |
Værdi (MM$) |
Portefølje % | ΔPortefølje % |
|---|---|---|---|---|
| 0,35 | 7,12 | 0,6351 | -3,4288 | |
| 0,21 | 10,35 | 0,9235 | -2,2656 | |
| 0,22 | 6,84 | 0,6103 | -2,0383 | |
| 0,03 | 1,21 | 0,1075 | -1,8756 | |
| 0,12 | 2,21 | 0,1970 | -1,8686 | |
| 0,04 | 8,75 | 0,7802 | -1,4433 | |
| 0,02 | 2,68 | 0,2391 | -1,2776 | |
| 0,99 | 5,84 | 0,5211 | -1,1509 | |
| 0,06 | 1,98 | 0,1767 | -1,0428 | |
| 0,35 | 16,86 | 1,5043 | -0,9716 |
13F og Fondsarkivering
Denne formular blev indsendt den 2025-08-12 for rapporteringsperioden 2025-06-30. Klik på linkikonet for at se den fulde transaktionshistorik.
Opgrader for at låse op for premium-data og eksportere til Excel ![]() .
.
| Sikkerhed | Type | Gennemsnitlig aktiekurs | Aktier (MM) |
Δ Aktier (%) |
Δ Aktier (%) |
Værdi ($MM) |
Portefølje (%) |
ΔPortefølje (%) |
|
|---|---|---|---|---|---|---|---|---|---|
| KMI / Kinder Morgan, Inc. | 2,05 | -0,94 | 60,27 | 2,08 | 5,3760 | 0,1946 | |||
| CTRA / Coterra Energy Inc. | 2,33 | 34,68 | 59,19 | 18,27 | 5,2798 | 0,8877 | |||
| VNOM / Viper Energy, Inc. | 1,53 | 59,03 | 58,32 | 34,30 | 5,2020 | 1,3912 | |||
| PR / Permian Resources Corporation | 3,92 | -4,92 | 53,42 | -6,50 | 4,7653 | -0,2488 | |||
| TRP / TC Energy Corporation | 1,03 | -1,28 | 50,18 | 2,03 | 4,4757 | 0,1597 | |||
| EQT / EQT Corporation | 0,74 | 180,51 | 42,98 | 206,18 | 3,8343 | 2,6022 | |||
| DVN / Devon Energy Corporation | 1,27 | 235,71 | 40,26 | 185,55 | 3,5913 | 2,3538 | |||
| AR / Antero Resources Corporation | 0,92 | 5,32 | 37,26 | 4,90 | 3,3232 | 0,2063 | |||
| CHRD / Chord Energy Corporation | 0,38 | 47,45 | 36,57 | 26,69 | 3,2620 | 0,7287 | |||
| KNTK / Kinetik Holdings Inc. | 0,81 | 33,58 | 35,72 | 13,29 | 3,1861 | 0,4190 | |||
| OKE / ONEOK, Inc. | 0,43 | -3,47 | 34,73 | -20,59 | 3,0976 | -0,7401 | |||
| GPOR / Gulfport Energy Corporation | 0,16 | -30,60 | 31,27 | -24,18 | 2,7896 | -0,8302 | |||
| MGY / Magnolia Oil & Gas Corporation | 1,39 | 441,55 | 31,26 | 381,99 | 2,7887 | 2,2194 | |||
| SEI / Solaris Energy Infrastructure, Inc. | 1,03 | 2,75 | 29,19 | 33,59 | 2,6039 | 0,6861 | |||
| TS / Tenaris S.A. - Depositary Receipt (Common Stock) | 0,69 | 280,82 | 25,77 | 264,18 | 2,2984 | 1,6774 | |||
| UGI / UGI Corporation | 0,59 | -27,30 | 21,59 | -19,94 | 1,9254 | -0,4407 | |||
| SRE / Sempra | 0,26 | 44,33 | 19,54 | 53,24 | 1,7432 | 0,6240 | |||
| MTDR / Matador Resources Company | 0,35 | -36,00 | 16,86 | -40,22 | 1,5043 | -0,9716 | |||
| DUK / Duke Energy Corporation | 0,14 | 15,83 | 16,43 | 12,06 | 1,4654 | 0,1788 | |||
| EVGO / EVgo, Inc. | 4,33 | 0,86 | 15,82 | 38,40 | 1,4112 | 0,4080 | |||
| EXC / Exelon Corporation | 0,35 | 15,13 | 1,3498 | 1,3498 | |||||
| NEXT / NextDecade Corporation | 1,66 | 13.646,74 | 14,76 | 15.769,89 | 1,3166 | 1,3083 | |||
| ETN / Eaton Corporation plc | 0,04 | -13,81 | 14,64 | 13,20 | 1,3060 | 0,1709 | |||
| PSX / Phillips 66 | 0,12 | 14,41 | 1,2856 | 1,2856 | |||||
| GLW / Corning Incorporated | 0,23 | 91,22 | 12,33 | 119,66 | 1,0995 | 0,6070 | |||
| EE / Excelerate Energy, Inc. | 0,41 | 861,39 | 12,08 | 883,08 | 1,0778 | 0,9699 | |||
| MTZ / MasTec, Inc. | 0,07 | 62,60 | 12,00 | 137,45 | 1,0701 | 0,6267 | |||
| XEL / Xcel Energy Inc. | 0,16 | -32,21 | 10,99 | -34,79 | 0,9804 | -0,4986 | |||
| CC / The Chemours Company | 0,96 | -34,41 | 10,96 | -44,49 | 0,9775 | -0,7551 | |||
| VRT / Vertiv Holdings Co | 0,08 | 10,67 | 0,9521 | 0,9521 | |||||
| XPRO / Expro Group Holdings N.V. | 1,24 | -0,00 | 10,65 | -13,59 | 0,9499 | -0,1316 | |||
| WFRD / Weatherford International plc | 0,21 | -69,67 | 10,35 | -71,51 | 0,9235 | -2,2656 | |||
| GEV / GE Vernova Inc. | 0,02 | -23,97 | 9,74 | 31,80 | 0,8685 | 0,2201 | |||
| DY / Dycom Industries, Inc. | 0,04 | -33,70 | 9,23 | 6,37 | 0,8235 | 0,0618 | |||
| BG / Bunge Global SA | 0,11 | 9,04 | 0,8059 | 0,8059 | |||||
| LNG / Cheniere Energy, Inc. | 0,04 | -67,20 | 8,75 | -65,48 | 0,7802 | -1,4433 | |||
| DINO / HF Sinclair Corporation | 0,21 | -58,38 | 8,67 | -48,00 | 0,7731 | -0,6897 | |||
| CRGY / Crescent Energy Company | 0,99 | 54,74 | 8,54 | 18,39 | 0,7615 | 0,1287 | |||
| HESM / Hess Midstream LP | 0,20 | 7,87 | 0,7024 | 0,7024 | |||||
| FLS / Flowserve Corporation | 0,15 | 7,80 | 0,6958 | 0,6958 | |||||
| FLR / Fluor Corporation | 0,15 | 7,74 | 0,6906 | 0,6906 | |||||
| CVE / Cenovus Energy Inc. | 0,56 | 7,65 | 0,6827 | 0,6827 | |||||
| HLX / Helix Energy Solutions Group, Inc. | 1,23 | 3,94 | 7,65 | -21,95 | 0,6819 | -0,1777 | |||
| SGML / Sigma Lithium Corporation | 1,68 | 149,31 | 7,58 | 7,88 | 0,6762 | 0,0595 | |||
| LBRT / Liberty Energy Inc. | 0,66 | -22,09 | 7,55 | -43,50 | 0,6736 | -0,4994 | |||
| DK / Delek US Holdings, Inc. | 0,36 | 7,53 | 0,6717 | 0,6717 | |||||
| BKV / BKV Corporation | 0,30 | 147,69 | 7,22 | 184,58 | 0,6438 | 0,4211 | |||
| HAL / Halliburton Company | 0,35 | -80,86 | 7,12 | -84,63 | 0,6351 | -3,4288 | |||
| VST / Vistra Corp. | 0,04 | 7,06 | 0,6301 | 0,6301 | |||||
| AESI / Atlas Energy Solutions Inc. | 0,51 | 6,88 | 0,6136 | 0,6136 | |||||
| CNQ / Canadian Natural Resources Limited | 0,22 | -77,76 | 6,84 | -77,33 | 0,6103 | -2,0383 | |||
| BKR / Baker Hughes Company | 0,18 | 6,73 | 0,6006 | 0,6006 | |||||
| EMR / Emerson Electric Co. | 0,05 | 6,31 | 0,5627 | 0,5627 | |||||
| ITT / ITT Inc. | 0,04 | 5,92 | 0,5282 | 0,5282 | |||||
| PTEN / Patterson-UTI Energy, Inc. | 0,99 | -57,49 | 5,84 | -69,33 | 0,5211 | -1,1509 | |||
| ARIS / Aris Water Solutions, Inc. | 0,24 | 5,68 | 0,5065 | 0,5065 | |||||
| SHEL / Shell plc - Depositary Receipt (Common Stock) | 0,08 | -41,53 | 5,66 | -43,82 | 0,5050 | -0,3793 | |||
| PUMP / ProPetro Holding Corp. | 0,81 | 26,61 | 4,85 | 2,82 | 0,4324 | 0,0187 | |||
| NVT / nVent Electric plc | 0,06 | 186,81 | 4,44 | 300,90 | 0,3963 | 0,2990 | |||
| MOD / Modine Manufacturing Company | 0,04 | 4,07 | 0,3629 | 0,3629 | |||||
| UEC / Uranium Energy Corp. | 0,56 | 3,80 | 0,3393 | 0,3393 | |||||
| CLNE / Clean Energy Fuels Corp. | 1,79 | 0,00 | 3,50 | 25,82 | 0,3122 | 0,0680 | |||
| ITRI / Itron, Inc. | 0,02 | -15,59 | 3,21 | 6,04 | 0,2865 | 0,0207 | |||
| TTE / TotalEnergies SE - Depositary Receipt (Common Stock) | 0,05 | -51,24 | 3,14 | -53,72 | 0,2804 | -0,3157 | |||
| URI / United Rentals, Inc. | 0,00 | 3,09 | 0,2755 | 0,2755 | |||||
| CCJ / Cameco Corporation | 0,04 | 2,93 | 0,2615 | 0,2615 | |||||
| STRL / Sterling Infrastructure, Inc. | 0,01 | -59,93 | 2,84 | -18,36 | 0,2532 | -0,0519 | |||
| NRG / NRG Energy, Inc. | 0,02 | -90,78 | 2,68 | -84,49 | 0,2391 | -1,2776 | |||
| NXT / Nextracker Inc. | 0,05 | 2,60 | 0,2318 | 0,2318 | |||||
| UUUU / Energy Fuels Inc. | 0,43 | 2,49 | 0,2218 | 0,2218 | |||||
| JCI / Johnson Controls International plc | 0,02 | 46,45 | 2,40 | 93,17 | 0,2144 | 0,1052 | |||
| TT / Trane Technologies plc | 0,01 | -34,80 | 2,37 | -15,34 | 0,2112 | -0,0343 | |||
| AM / Antero Midstream Corporation | 0,12 | -91,09 | 2,21 | -90,62 | 0,1970 | -1,8686 | |||
| ARRY / Array Technologies, Inc. | 0,35 | 2,08 | 0,1858 | 0,1858 | |||||
| FTI / TechnipFMC plc | 0,06 | -86,88 | 1,98 | -85,75 | 0,1767 | -1,0428 | |||
| CARR / Carrier Global Corporation | 0,03 | 45,83 | 1,94 | 68,41 | 0,1726 | 0,0717 | |||
| NESR / National Energy Services Reunited Corp. | 0,29 | 0,00 | 1,75 | -18,20 | 0,1564 | -0,0317 | |||
| MYRG / MYR Group Inc. | 0,01 | -26,56 | 1,71 | 17,83 | 0,1521 | 0,0251 | |||
| GLNG / Golar LNG Limited | 0,04 | 1,70 | 0,1517 | 0,1517 | |||||
| VLO / Valero Energy Corporation | 0,01 | -89,46 | 1,32 | -89,27 | 0,1180 | -0,9635 | |||
| OVV / Ovintiv Inc. | 0,03 | -94,00 | 1,21 | -94,67 | 0,1075 | -1,8756 | |||
| SDRL / Seadrill Limited | 0,04 | -34,37 | 1,10 | -31,11 | 0,0978 | -0,0418 | |||
| OPAL / OPAL Fuels Inc. | 0,37 | 0,00 | 0,90 | 31,59 | 0,0807 | 0,0203 | |||
| TTI / TETRA Technologies, Inc. | 0,23 | -11,15 | 0,76 | -11,11 | 0,0678 | -0,0073 | |||
| NPWR / NET Power Inc. | 0,30 | 0,00 | 0,74 | -6,08 | 0,0661 | -0,0031 | |||
| PDS / Precision Drilling Corporation | 0,01 | -93,78 | 0,57 | -93,67 | 0,0506 | -0,7357 | |||
| VIST / Vista Energy, S.A.B. de C.V. - Depositary Receipt (Common Stock) | 0,01 | -11,77 | 0,49 | -9,44 | 0,0436 | -0,0038 | |||
| AES / The AES Corporation | 0,00 | -100,00 | 0,00 | 0,0000 | |||||
| GTLS / Chart Industries, Inc. | 0,00 | -100,00 | 0,00 | 0,0000 | |||||
| ACDC / ProFrac Holding Corp. | 0,00 | -100,00 | 0,00 | 0,0000 | |||||
| APH / Amphenol Corporation | 0,00 | -100,00 | 0,00 | 0,0000 | |||||
| ALB / Albemarle Corporation | 0,00 | -100,00 | 0,00 | 0,0000 | |||||
| LEU / Centrus Energy Corp. | 0,00 | -100,00 | 0,00 | 0,0000 | |||||
| TXNM / TXNM Energy, Inc. | 0,00 | -100,00 | 0,00 | 0,0000 | |||||
| FLNC / Fluence Energy, Inc. | 0,00 | -100,00 | 0,00 | 0,0000 | |||||
| EXE / Expand Energy Corporation | 0,00 | -100,00 | 0,00 | 0,0000 | |||||
| EOG / EOG Resources, Inc. | 0,00 | -100,00 | 0,00 | 0,0000 | |||||
| NE / Noble Corporation plc | 0,00 | -100,00 | 0,00 | -100,00 | -0,7874 | ||||
| INR / Infinity Natural Resources, Inc. | 0,00 | -100,00 | 0,00 | 0,0000 |