Grundlæggende statistik
| Institutionelle aktier (lange) | 270.179.001 - 62,03% (ex 13D/G) - change of -38,56MM shares -12,49% MRQ |
| Institutionel værdi (lang) | $ 23.604.905 USD ($1000) |
Institutionelt ejerskab og aktionærer
Cameco Corporation (US:CCJ) har 1007 institutionelle ejere og aktionærer, der har indsendt 13D/G- eller 13F-formularer til Securities Exchange Commission (SEC). Disse institutioner har i alt 270,179,001 aktier. Største aktionærer omfatter Vanguard Group Inc, Fmr Llc, MIRAE ASSET GLOBAL ETFS HOLDINGS Ltd., Capital World Investors, Royal Bank Of Canada, FIL Ltd, Bank Of America Corp /de/, Van Eck Associates Corp, Caledonia (Private) Investments Pty Ltd, and Bank Of Montreal /can/ .
Cameco Corporation (NYSE:CCJ) institutionel ejerskabsstruktur viser aktuelle positioner i virksomheden efter institutioner og fonde, samt seneste ændringer i positionsstørrelse. Større aktionærer kan omfatte individuelle investorer, investeringsforeninger, hedgefonde eller institutioner. Skema 13D angiver, at investoren besidder (eller besidder) mere end 5 % af virksomheden og har til hensigt (eller har til hensigt at) aktivt at forfølge en ændring i forretningsstrategi. Skema 13G indikerer en passiv investering på over 5%.
The share price as of April 24, 2026 is 122,15 / share. Previously, on April 28, 2025, the share price was 45,32 / share. This represents an increase of 169,53% over that period.

Fondens stemningsscore
Fund Sentiment Score (fka Ownership Accumulation Score) finder de aktier, der bliver mest købt af fonde. Det er resultatet af en sofistikeret, multi-faktor kvantitativ model, der identificerer virksomheder med de højeste niveauer af institutionel akkumulering. Scoringsmodellen bruger en kombination af den samlede stigning i oplyste ejere, ændringerne i porteføljeallokeringer i disse ejere og andre målinger. Tallet går fra 0 til 100, hvor højere tal indikerer et højere niveau af akkumulering for sine jævnaldrende, og 50 er gennemsnittet.
Opdateringsfrekvens: Dagligt
Se Ownership Explorer, som giver en liste over højest rangerende virksomheder.
AI+ Ask Fintel’s AI assistant about Cameco Corporation.
Select a question to share a public post with an AI-crafted answer.
Thinking of good questions…
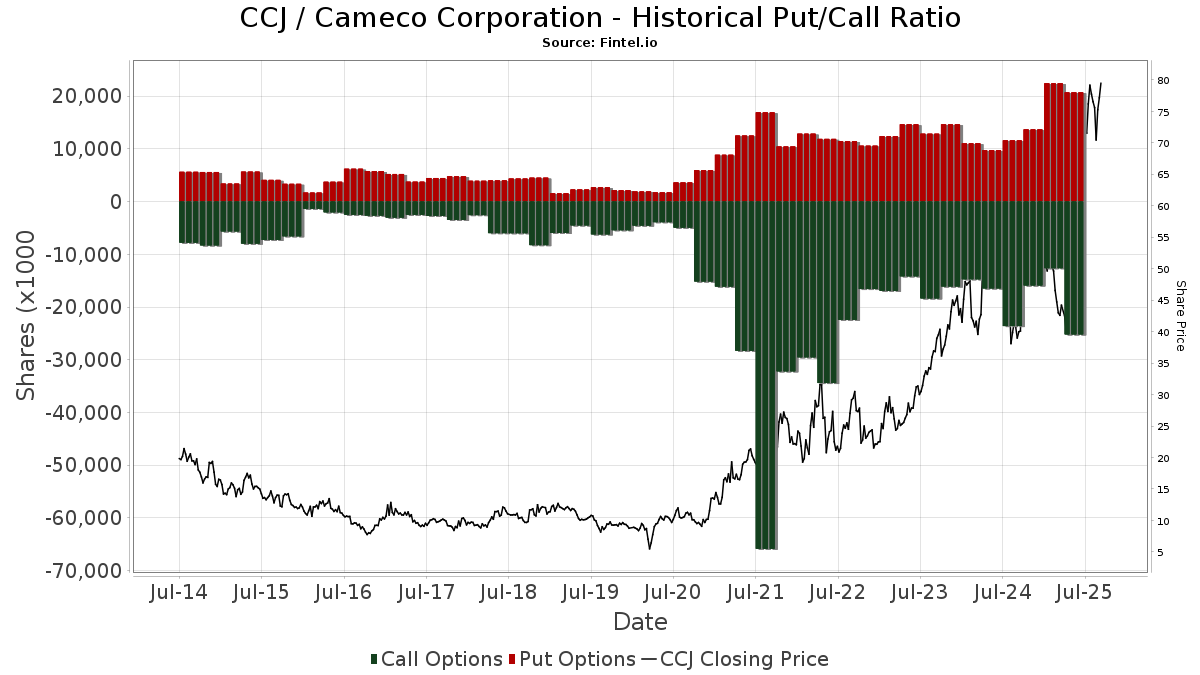
Institutionel Put/Call-forhold
Ud over at indberette standardaktie- og gældsudstedelser skal institutter med mere end 100 mill. aktiver under forvaltning også oplyse deres put- og call-optionsbeholdninger. Da salgsoptioner generelt indikerer negativ stemning, og købsoptioner indikerer positiv stemning, kan vi få en fornemmelse af den overordnede institutionelle stemning ved at plotte forholdet mellem put og kald. Diagrammet til højre viser det historiske put/call-forhold for dette instrument.
Brug af Put/Call Ratio som en indikator for investorernes stemning overvinder en af de vigtigste mangler ved at bruge totalt institutionelt ejerskab, som er, at en betydelig mængde af aktiver under forvaltning investeres passivt for at spore indekser. Passivt forvaltede fonde køber typisk ikke optioner, så indikatoren for put/call-forholdet følger mere nøje følelsen af aktivt forvaltede fonde.
13D/G-arkivering
Vi præsenterer 13D/G ansøgninger separat fra 13F ansøgninger på grund af den forskellige behandling af SEC. 13D/G-ansøgninger kan indgives af grupper af investorer (med én ledende), hvorimod 13F-ansøgninger ikke kan. Dette resulterer i situationer, hvor en investor kan indsende en 13D/G, der rapporterer én værdi for de samlede aktier (der repræsenterer alle de aktier, der ejes af investorgruppen), men derefter indsender en 13F, der rapporterer en anden værdi for de samlede aktier (der udelukkende repræsenterer deres egne) ejendomsret). Det betyder, at aktieejerskab af 13D/G-arkiver og 13F-arkiveringer ofte ikke er direkte sammenlignelige, så vi præsenterer dem separat.
Bemærk: Fra den 16. maj 2021 viser vi ikke længere ejere, der ikke har indsendt en 13D/G inden for det seneste år. Tidligere viste vi den fulde historie af 13D/G-arkiver. Generelt skal enheder, der er forpligtet til at indgive 13D/G-ansøgninger, indgive mindst årligt, før de indsender en afsluttende ansøgning. Dog forlader fonde nogle gange positioner uden at indsende en afsluttende ansøgning (dvs. de afvikler), så visning af den fulde historie resulterede nogle gange i forvirring om det nuværende ejerskab. For at undgå forvirring viser vi nu kun 'aktuelle' ejere - det vil sige - ejere, der har anmeldt inden for det seneste år.
Upgrade to unlock premium data.
| Fil dato | Form | Investor | Forrige Aktier |
Seneste Aktier |
Δ Aktier (Procent) |
Ejendomsret (Procent) |
Δ Ejerskab (Procent) |
|
|---|---|---|---|---|---|---|---|---|
| 2025-05-12 | FMR LLC | 22,639,643 | 14,834,467 | -34.48 | 3.40 | -34.62 | ||
| 2025-04-29 | BlackRock, Inc. | 25,689,755 | 18,507,681 | -27.96 | 4.30 | -27.12 |
13F og NPORT arkivering
Detaljer om 13F-arkivering er gratis. Detaljer om NP-ansøgninger kræver et premium-medlemskab. Grønne rækker angiver nye positioner. Røde rækker angiver lukkede positioner. Klik på linket ikon for at se den fulde transaktionshistorik.
Opgrader
for at låse premium-data op og eksportere til Excel ![]() .
.
| Fil dato | Kilde | Investor | Type | Gennemsnitlig pris (Øst) |
Aktier | Δ Aktier (%) |
Rapporteret Værdi ($1000) |
Δ Værdi (%) |
Port Alloc (%) |
|
|---|---|---|---|---|---|---|---|---|---|---|
| 2026-02-13 | 13F | Platinum Investment Management Ltd | 42.356 | -93,72 | 3.875 | -93,15 | ||||
| 2026-02-17 | 13F | Turim 21 Investimentos Ltda. | 5.457 | -18,96 | 499 | -11,52 | ||||
| 2026-02-17 | 13F | Fred Alger Management, Llc | 166.025 | 259,27 | 15.222 | 292,42 | ||||
| 2026-02-13 | 13F | Public Sector Pension Investment Board | 0 | -100,00 | 0 | |||||
| 2026-02-06 | 13F | Mach-1 Financial Group, Inc. | 0 | -100,00 | 0 | |||||
| 2026-02-12 | 13F | Dimensional Fund Advisors Lp | 376.249 | -12,26 | 34.423 | -4,29 | ||||
| 2026-02-17 | 13F | Freestone Grove Partners LP | 148.916 | 13.624 | ||||||
| 2026-02-13 | 13F | Lord, Abbett & Co. Llc | 0 | -100,00 | 0 | |||||
| 2026-03-04 | 13F | SHP Wealth Management | 3.855 | 353 | ||||||
| 2026-02-10 | 13F | Argent Trust Co | 3.345 | 0,00 | 306 | 9,29 | ||||
| 2025-11-07 | 13F | HighTower Advisors, LLC | Call | 0 | -100,00 | 0 | -100,00 | |||
| 2025-11-20 | 13F | First Affirmative Financial Network | 0 | -100,00 | 0 | -100,00 | ||||
| 2026-04-15 | 13F | Myriad Asset Management US LP | 2.322 | -57,61 | 252 | -49,70 | ||||
| 2026-01-23 | 13F | Legacy Bridge, LLC | 11.508 | 0,88 | 1.053 | 10,04 | ||||
| 2026-02-17 | 13F | XTX Topco Ltd | 19.715 | 144,15 | 1.804 | 166,32 | ||||
| 2026-02-17 | 13F | Guardian Partners Inc. | 0 | -100,00 | 0 | |||||
| 2026-02-17 | 13F | Altshuler Shaham Ltd | 24.009 | 7,49 | 2.197 | 17,25 | ||||
| 2026-02-12 | 13F | DJE Kapital AG | 0 | -100,00 | 0 | |||||
| 2026-02-13 | 13F | De Lisle Partners LLP | 467.361 | -6,03 | 42.761 | 2,52 | ||||
| 2026-02-11 | 13F | Fox Run Management, L.l.c. | 3.922 | 359 | ||||||
| 2026-02-11 | 13F | CLARET ASSET MANAGEMENT Corp | 28.988 | -0,23 | 3 | 0,00 | ||||
| 2026-02-13 | 13F | Headlands Technologies LLC | 33.443 | 3.060 | ||||||
| 2026-04-14 | 13F | Banque Pictet & Cie Sa | 14.531 | 1.575 | ||||||
| 2025-11-14 | 13F | LMR Partners LLP | Call | 0 | -100,00 | 0 | -100,00 | |||
| 2026-04-24 | 13F | Triasima Portfolio Management inc. | 108.916 | 2,02 | 11.807 | 20,62 | ||||
| 2025-11-14 | 13F | LMR Partners LLP | 0 | -100,00 | 0 | -100,00 | ||||
| 2026-02-13 | 13F | Integrated Wealth Concepts LLC | 10.549 | 41,10 | 965 | 54,15 | ||||
| 2026-02-17 | 13F | Ninepoint Partners LP | 239.783 | 109,66 | 21.938 | 128,75 | ||||
| 2026-02-12 | 13F | Cibc World Markets Corp | Put | 13.600 | -81,11 | 1.244 | -76,72 | |||
| 2026-02-11 | 13F | Allianz Asset Management GmbH | 193.573 | 33,10 | 17.748 | 45,38 | ||||
| 2026-02-17 | 13F | State Of Wisconsin Investment Board | 193.533 | 17.744 | ||||||
| 2026-02-17 | 13F | Polygon Management Ltd. | 0 | -100,00 | 0 | |||||
| 2025-11-14 | 13F | Eqis Capital Management, Inc. | 0 | -100,00 | 0 | -100,00 | ||||
| 2026-02-05 | 13F | Bessemer Group Inc | 1.613 | 25,23 | 0 | |||||
| 2026-02-13 | 13F | Greenline Wealth Management LLC | 450 | 41 | ||||||
| 2026-02-04 | 13F | Nwam Llc | 79.018 | -3,87 | 9.544 | 35,22 | ||||
| 2026-02-13 | 13F | Delos Wealth Advisors, LLC | 100 | -75,00 | 9 | -72,73 | ||||
| 2026-01-21 | 13F | Sound Income Strategies, LLC | 435 | -58,05 | 51 | -43,82 | ||||
| 2026-02-10 | 13F | Turn8 Private Wealth Inc. | 48.739 | -0,06 | 4.465 | 9,04 | ||||
| 2026-02-12 | 13F | CIBC Private Wealth Group, LLC | 5.356 | 184,14 | 490 | 209,49 | ||||
| 2026-02-09 | 13F | William Blair Investment Management, Llc | 1.980.827 | -24,91 | 181.226 | -18,08 | ||||
| 2025-11-13 | 13F | Eisler Capital Management Ltd. | 29.325 | 521,82 | 2.523 | 620,57 | ||||
| 2026-02-12 | 13F | Nuveen, LLC | 569.103 | -16,62 | 52.158 | -8,94 | ||||
| 2026-04-20 | 13F | Assenagon Asset Management S.A. | 16.301 | -2,08 | 1.764 | 15,53 | ||||
| 2026-02-17 | 13F | Quantinno Capital Management LP | 95.974 | 15,00 | 8.781 | 25,46 | ||||
| 2026-02-10 | 13F | Bank of New York Mellon Corp | 1.385.515 | 21,07 | 126.761 | 32,09 | ||||
| 2026-04-13 | 13F | JCIC Asset Management Inc. | 41.517 | 2,99 | 4.506 | 22,05 | ||||
| 2026-03-13 | 13F | ARP Global Capital Ltd | 157.811 | 14.438 | ||||||
| 2026-02-17 | 13F | Progeny 3, Inc. | 2.347.131 | -3,91 | 214.739 | 4,83 | ||||
| 2026-02-10 | 13F | Rothschild Investment Llc | 6 | 1 | ||||||
| 2026-02-17 | 13F | Qube Research & Technologies Ltd | Put | 238.700 | 65,53 | 21.839 | 80,60 | |||
| 2026-02-17 | 13F | Qube Research & Technologies Ltd | Call | 314.100 | 22,22 | 28.737 | 33,34 | |||
| 2026-02-12 | 13F | Hollencrest Capital Management | 42.121 | 0,07 | 3.854 | 9,18 | ||||
| 2026-02-17 | 13F | Qube Research & Technologies Ltd | 626.520 | 92,42 | 57.323 | 109,93 | ||||
| 2026-02-17 | 13F | MIRAE ASSET GLOBAL ETFS HOLDINGS Ltd. | 14.529.956 | 11,99 | 1.332.202 | 22,32 | ||||
| 2026-04-21 | 13F | Venturi Wealth Management, LLC | 4.051 | 80,20 | 440 | 114,15 | ||||
| 2026-02-06 | 13F | Mitsubishi UFJ Asset Management (UK) Ltd. | 24.000 | 2 | ||||||
| 2026-02-13 | 13F | Nicholas Investment Partners, LP | 173.449 | 0,00 | 15.869 | 9,10 | ||||
| 2026-01-27 | 13F | Belpointe Asset Management LLC | 16.146 | -20,49 | 1.477 | -13,22 | ||||
| 2026-02-13 | 13F | Mariner, LLC | 56.666 | 7,72 | 5.184 | 17,52 | ||||
| 2026-02-12 | 13F | Swiss National Bank | 1.154.000 | -7,86 | 105.884 | 0,69 | ||||
| 2026-02-10 | 13F | Lido Advisors, LLC | 5.514 | -1,76 | 463 | -1,70 | ||||
| 2026-02-14 | 13F | Rockefeller Capital Management L.P. | 154.926 | 6,77 | 14.173 | 16,48 | ||||
| 2026-02-10 | 13F | Bruce G. Allen Investments, LLC | 21 | -50,00 | 2 | -66,67 | ||||
| 2025-11-07 | 13F | Atticus Wealth Management, Llc | 0 | -100,00 | 0 | |||||
| 2026-03-20 | 13F | Purpose Unlimited Inc. | 70.282 | 6.436 | ||||||
| 2026-01-23 | 13F | Altfest L J & Co Inc | 8.554 | -22,07 | 783 | -15,00 | ||||
| 2026-02-17 | 13F | Balyasny Asset Management Llc | 17.813 | -94,51 | 1.630 | -94,01 | ||||
| 2026-02-17 | 13F | Balyasny Asset Management Llc | Put | 73.000 | 102,78 | 6.679 | 121,27 | |||
| 2026-04-22 | 13F | Continuum Advisory, LLC | 22.275 | -44,40 | 2.419 | -34,00 | ||||
| 2026-02-17 | 13F | Balyasny Asset Management Llc | Call | 206.000 | -14,27 | 18.847 | -6,48 | |||
| 2026-02-17 | 13F | Boothbay Fund Management, Llc | 11.740 | -28,10 | 1.074 | -21,55 | ||||
| 2026-04-16 | 13F | Toth Financial Advisory Corp | 30 | 0,00 | 3 | 50,00 | ||||
| 2026-04-21 | 13F | Wesbanco Bank Inc | 3.000 | 0,00 | 326 | 18,61 | ||||
| 2026-02-17 | 13F | Boothbay Fund Management, Llc | Put | 21.500 | 11,40 | 1.967 | 21,57 | |||
| 2026-02-17 | 13F | Boothbay Fund Management, Llc | Call | 52.500 | 45,43 | 4.803 | 58,67 | |||
| 2026-02-13 | 13F | NLB Skladi, upravljanje premozenja, d.o.o. | 26.297 | 2.406 | ||||||
| 2025-11-10 | 13F | Asahi Life Asset Management Co., Ltd. | 0 | -100,00 | 0 | -100,00 | ||||
| 2026-02-06 | 13F | Pinnbrook Capital Management Lp | 21.343 | 124,10 | 1.953 | 144,61 | ||||
| 2026-02-13 | 13F | Bay Colony Advisory Group, Inc d/b/a Bay Colony Advisors | 11.065 | 36,17 | 1.012 | 48,60 | ||||
| 2026-04-13 | 13F | St Germain D J Co Inc | 15 | 114,29 | 2 | |||||
| 2026-02-17 | 13F | Lombard Odier Asset Management (Europe) Ltd | 119.920 | 10.971 | ||||||
| 2026-02-12 | 13F | Cibc World Markets Corp | Call | 17.600 | 1.610 | |||||
| 2026-02-17 | 13F | SummitTX Capital, L.P. | 39.253 | 3.591 | ||||||
| 2026-04-14 | 13F | Congress Asset Management Co /ma | 132.280 | 57,88 | 14.367 | 87,42 | ||||
| 2026-04-22 | 13F | Nicholson Meyer Capital Management, Inc. | 3.926 | -42,69 | 426 | -31,95 | ||||
| 2026-02-13 | 13F | Dockside LLC | 76.888 | 7.034 | ||||||
| 2026-04-07 | 13F | Signaturefd, Llc | 10.708 | 13,35 | 1.163 | 34,49 | ||||
| 2026-02-17 | 13F | Asset One Wealth Management LLC | 24.968 | 3.001 | ||||||
| 2026-02-06 | 13F | EverSource Wealth Advisors, LLC | 908 | 30,09 | 83 | 43,10 | ||||
| 2026-02-13 | 13F | Manufacturers Life Insurance Company, The | 0 | -100,00 | 0 | |||||
| 2026-01-12 | 13F | Castleview Partners, Llc | 4.155 | -2,26 | 380 | 6,74 | ||||
| 2026-01-15 | 13F | Nikulski Financial, Inc. | 10.160 | 930 | ||||||
| 2026-04-10 | 13F | Ipswich Investment Management Co., Inc. | 41.748 | -7,34 | 4.534 | 10,02 | ||||
| 2025-11-06 | 13F | Compagnie Lombard Odier SCmA | 0 | -100,00 | 0 | |||||
| 2026-01-26 | 13F | Mirae Asset Global Investments Co., Ltd. | 255.352 | 2,14 | 23.362 | 11,44 | ||||
| 2026-02-18 | 13F | GWM Advisors LLC | 1 | -100,00 | 1 | -100,00 | ||||
| 2026-02-13 | 13F | Brooklands Fund Management Ltd | 600 | 135 | ||||||
| 2026-02-13 | 13F | Wexford Capital Lp | 2.731 | 11,88 | 250 | 22,06 | ||||
| 2025-12-05 | 13F | Saranac Partners Ltd | 0 | -100,00 | 0 | -100,00 | ||||
| 2026-02-13 | 13F | Brooklands Fund Management Ltd | Put | 700 | 48 | |||||
| 2026-04-10 | 13F | Armstrong Advisory Group, Inc | 449 | 21,02 | 49 | 45,45 | ||||
| 2025-11-14 | 13F | Cubist Systematic Strategies, LLC | Call | 302.400 | 68,37 | 25.359 | 90,23 | |||
| 2026-04-13 | 13F | Massmutual Trust Co Fsb/adv | 1.591 | -5,91 | 173 | 11,69 | ||||
| 2025-11-14 | 13F | Cubist Systematic Strategies, LLC | Put | 208.300 | 911,17 | 17.468 | 1.042,45 | |||
| 2026-02-12 | 13F | Intesa Sanpaolo Wealth Management | 1.170 | 107 | ||||||
| 2026-02-09 | 13F | Geode Capital Management, Llc | 4.164.700 | 7,46 | 385.945 | 17,57 | ||||
| 2026-02-13 | 13F | AlTi Global, Inc. | 134.630 | -0,02 | 12.331 | 9,14 | ||||
| 2026-01-29 | 13F | Montrusco Bolton Investments Inc. | 96.167 | 8.817 | ||||||
| 2026-02-13 | 13F | Transamerica Financial Advisors, Inc. | 259 | 24 | ||||||
| 2026-04-13 | 13F | Mather Group, Llc. | 69 | 7 | ||||||
| 2026-02-13 | 13F | Brooklands Fund Management Ltd | Call | 499 | 24,75 | 13 | -82,61 | |||
| 2026-02-13 | 13F | OMERS ADMINISTRATION Corp | 0 | -100,00 | 0 | |||||
| 2026-01-14 | 13F | Hennion & Walsh Asset Management, Inc. | 20.115 | 45,05 | 1.840 | 58,35 | ||||
| 2026-04-24 | 13F | Yousif Capital Management, Llc | 5.335 | 0,00 | 579 | -6,16 | ||||
| 2025-11-14 | 13F | Point72 Asia (Singapore) Pte. Ltd. | 0 | -100,00 | 0 | |||||
| 2026-04-22 | 13F | Patriot Financial Group Insurance Agency, LLC | 5.104 | 100,00 | 554 | 137,77 | ||||
| 2026-02-13 | 13F | Beck Capital Management, Llc | 132.992 | -4,03 | 12.167 | 4,71 | ||||
| 2026-02-17 | 13F | Signature Equity Partners, LLC | 405 | 37 | ||||||
| 2026-01-23 | 13F | Guidance Capital, Inc | 2.111 | 257 | ||||||
| 2026-04-09 | 13F | Moody National Bank Trust Division | 1.948 | 212 | ||||||
| 2026-04-15 | 13F | Activest Wealth Management | 994 | -7,19 | 108 | 11,34 | ||||
| 2026-02-10 | 13F | Moors & Cabot, Inc. | 9.334 | 23,89 | 854 | 35,18 | ||||
| 2026-02-17 | 13F | Numerai GP LLC | 5.615 | 85,50 | 514 | 102,77 | ||||
| 2026-01-30 | 13F | W.G. Shaheen & Associates DBA Whitney & Co | 131.126 | 0,33 | 11.997 | 9,46 | ||||
| 2026-02-17 | 13F | Tcw Group Inc | 233.280 | 21.343 | ||||||
| 2026-02-04 | 13F | HighPoint Advisor Group LLC | 3.153 | -45,53 | 288 | -40,62 | ||||
| 2025-11-05 | 13F | Anthracite Investment Company, Inc. | 0 | -100,00 | 0 | -100,00 | ||||
| 2026-02-04 | 13F | Money Concepts Capital Corp | 2.726 | 7,24 | 249 | 16,90 | ||||
| 2026-02-04 | 13F | BCJ Capital Management, LLC | 47.822 | 36,17 | 4.375 | 48,56 | ||||
| 2025-10-31 | 13F | Nicola Wealth Management Ltd. | 0 | -100,00 | 0 | |||||
| 2026-04-09 | 13F | Nelson, Van Denburg & Campbell Wealth Management Group, LLC | 2.718 | 0,00 | 295 | 18,95 | ||||
| 2026-04-09 | 13F | Pacifica Partners Inc. | 60.343 | -3,28 | 6.546 | 7,10 | ||||
| 2026-02-10 | 13F | Holderness Investments Co | 5.567 | 2,83 | 509 | 12,11 | ||||
| 2026-04-10 | 13F | Henry James International Management Inc. | 36.333 | 235,27 | 3.946 | 298,18 | ||||
| 2026-04-20 | 13F | Dagco, Inc. | 391 | 0,00 | 42 | 20,00 | ||||
| 2026-02-11 | 13F | Parallel Advisors, LLC | 9.932 | -17,15 | 909 | -9,65 | ||||
| 2026-04-23 | 13F | SevenBridge Financial Group, LLC | 3.018 | 1,14 | 382 | 5,54 | ||||
| 2026-02-03 | 13F | Anfield Capital Management, LLC | 132 | 0,00 | 12 | 9,09 | ||||
| 2026-02-13 | 13F | Barclays Plc | Put | 890.400 | -70,29 | 81.463 | -67,59 | |||
| 2026-01-20 | 13F | Stratos Wealth Partners, LTD. | 41.483 | -0,23 | 3.795 | 8,86 | ||||
| 2026-02-13 | 13F | Barclays Plc | Call | 135.000 | -71,01 | 12.351 | -68,37 | |||
| 2026-02-17 | 13F | Magnetar Financial LLC | 49.266 | -38,56 | 4.507 | -32,97 | ||||
| 2026-04-14 | 13F | Joule Financial, LLC | 10.315 | -0,53 | 1.120 | 18,14 | ||||
| 2026-04-16 | 13F | Lee Johnson Capital Management, Llc | 4.262 | -50,55 | 463 | -41,37 | ||||
| 2026-02-13 | 13F | Barclays Plc | 92.909 | 62,13 | 8.500 | 76,90 | ||||
| 2026-02-10 | 13F | Savant Capital, LLC | 8.332 | -5,92 | 762 | 2,70 | ||||
| 2026-02-11 | 13F | Metis Global Partners, LLC | 44.185 | -6,39 | 4.046 | 2,12 | ||||
| 2026-02-17 | 13F | Snowden Capital Advisors LLC | 4.312 | 68,83 | 395 | 84,11 | ||||
| 2026-01-20 | 13F | Cromwell Holdings LLC | 1.977 | 0,00 | 181 | 9,09 | ||||
| 2026-02-06 | 13F | Stronghold Wealth Management L.L.C. | 2.752 | 252 | ||||||
| 2026-02-11 | 13F | Picton Mahoney Asset Management | 481.834 | 5,36 | 44.182 | 116.168,42 | ||||
| 2026-02-12 | 13F | Jane Street Group, Llc | 705.696 | 94,69 | 64.564 | 112,40 | ||||
| 2026-02-12 | 13F | Jane Street Group, Llc | Call | 457.800 | 10,13 | 41.884 | 20,15 | |||
| 2026-02-12 | 13F | Advisors Asset Management, Inc. | 4.765 | 58,41 | 436 | 72,62 | ||||
| 2026-02-12 | 13F | Jane Street Group, Llc | Put | 4.326.500 | 471,16 | 395.831 | 523,13 | |||
| 2026-02-12 | 13F | M&G Plc | 638.539 | -30,63 | 58.619 | -24,23 | ||||
| 2026-02-02 | 13F | Truist Financial Corp | 31.902 | 2,71 | 2.919 | 12,06 | ||||
| 2026-02-04 | 13F | LRI Investments, LLC | 834 | 0,00 | 76 | 10,14 | ||||
| 2026-02-09 | 13F | GeoSphere Capital Management | 73.460 | 7,30 | 6.721 | 17,05 | ||||
| 2026-02-10 | 13F | Quantbot Technologies LP | 31.411 | 2.874 | ||||||
| 2026-01-23 | 13F | Transcend Wealth Collective, Llc | 2.880 | -11,76 | 263 | -3,66 | ||||
| 2026-02-19 | 13F | Mcguire Capital Advisors Inc | 301 | 28 | ||||||
| 2026-02-10 | 13F | Hillsdale Investment Management Inc. | 66.653 | -72,39 | 6.114 | -69,81 | ||||
| 2026-02-12 | 13F | Polen Capital Management Llc | 0 | -100,00 | 0 | |||||
| 2026-04-14 | 13F | Nbc Securities, Inc. | 41.665 | -28,06 | 4.525 | -14,59 | ||||
| 2026-02-09 | 13F | Avalon Trust Co | 500 | 46 | ||||||
| 2026-04-13 | 13F | Wolff Wiese Magana Llc | 5.181 | 76,10 | 563 | 108,92 | ||||
| 2026-02-13 | 13F | Towarzystwo Funduszy Inwestycyjnych Pzu Sa | 0 | -100,00 | 0 | |||||
| 2026-02-17 | 13F | Limestone Investment Advisors LP | Call | 600 | 55 | |||||
| 2026-02-17 | 13F | Limestone Investment Advisors LP | Put | 3.600 | 329 | |||||
| 2026-02-11 | 13F | Doheny Asset Management /ca | 6.375 | 0,00 | 1 | |||||
| 2026-02-17 | 13F | Jones Financial Companies Lllp | 39.582 | 67,83 | 3.621 | 79,44 | ||||
| 2026-02-13 | 13F | Fortis Capital Management LLC | 3.429 | 26,34 | 314 | 37,89 | ||||
| 2026-02-13 | 13F | Umb Bank N A/mo | 2.810 | 0,00 | 257 | 9,36 | ||||
| 2025-11-14 | 13F | AXA Investment Managers S.A. | 22.281 | 1.868 | ||||||
| 2026-02-17 | 13F | Utah Retirement Systems | 48.500 | 0,00 | 4.447 | 9,21 | ||||
| 2026-02-18 | 13F | EP Wealth Advisors, Inc. | 10.518 | 9,83 | 962 | 35,49 | ||||
| 2026-02-13 | 13F | Aigen Investment Management, Lp | 0 | -100,00 | 0 | |||||
| 2026-02-17 | 13F | Blair William & Co/il | 40.463 | 65,85 | 3.702 | 80,89 | ||||
| 2025-10-28 | 13F | CarsonAllaria Wealth Management, Ltd. | 0 | -100,00 | 0 | -100,00 | ||||
| 2026-02-06 | 13F | Larson Financial Group LLC | 1.886 | 116,78 | 173 | 138,89 | ||||
| 2026-02-17 | 13F | Point72 Asset Management, L.P. | Call | 291.000 | 246,02 | 26.624 | 277,52 | |||
| 2026-04-17 | 13F | Total Clarity Wealth Management, Inc. | 2.829 | -24,56 | 307 | -10,50 | ||||
| 2026-04-20 | 13F | Financial Enhancement Group LLC | 0 | -100,00 | 0 | |||||
| 2026-01-29 | 13F | UBS Group AG | Call | 0 | -100,00 | 0 | -100,00 | |||
| 2026-02-17 | 13F | Point72 Asset Management, L.P. | 305.098 | 269,10 | 27.914 | 302,84 | ||||
| 2026-02-12 | 13F | Campbell & CO Investment Adviser LLC | 0 | -100,00 | 0 | |||||
| 2026-02-12 | 13F | APG Asset Management N.V. | 148.879 | -7,66 | 11.623 | 0,90 | ||||
| 2026-02-17 | 13F | Point72 Asset Management, L.P. | Put | 137.300 | -39,67 | 12.562 | -34,19 | |||
| 2026-02-17 | 13F | First Manhattan Co | 2.187 | 200 | ||||||
| 2026-02-17 | 13F | FIL Ltd | 8.683.510 | -19,43 | 795.121 | -12,09 | ||||
| 2026-02-13 | 13F | Oceanic Investment Management LTD | 4.019 | 368 | ||||||
| 2026-02-04 | 13F | Versor Investments LP | 0 | -100,00 | 0 | |||||
| 2025-11-13 | 13F | Wells Fargo & Company/mn | Put | 0 | -100,00 | 0 | -100,00 | |||
| 2026-02-13 | 13F | Biondo Investment Advisors, LLC | 5.000 | 0,00 | 457 | 9,07 | ||||
| 2025-11-13 | 13F | Wells Fargo & Company/mn | Call | 0 | -100,00 | 0 | -100,00 | |||
| 2026-04-16 | 13F | Connective Portfolio Management, LLC | 9.300 | 1.008 | ||||||
| 2026-02-02 | 13F | Varma Mutual Pension Insurance Co | 117.800 | 10.801 | ||||||
| 2026-02-09 | 13F | Hartland & Co., LLC | 10.158 | 0,84 | 929 | 10,07 | ||||
| 2026-04-22 | 13F | Skylands Capital, LLC | 700 | 0,00 | 76 | 18,75 | ||||
| 2026-01-15 | 13F | Nilsine Partners, LLC | 5.469 | 0,00 | 500 | 9,17 | ||||
| 2026-02-13 | 13F | Kayne Anderson Capital Advisors Lp | 29.545 | 115,96 | 2.703 | 135,66 | ||||
| 2026-02-17 | 13F | Algert Global Llc | 24.592 | 310,21 | 2 | |||||
| 2026-02-11 | 13F | Gwn Securities Inc. | 5.851 | 44,50 | 535 | 57,82 | ||||
| 2026-02-13 | 13F | Gts Securities Llc | 0 | -100,00 | 0 | |||||
| 2026-02-10 | 13F | Foundations Investment Advisors, LLC | 5.466 | 500 | ||||||
| 2026-01-22 | 13F | Hager Investment Management Services, Llc | 24.192 | -11,83 | 2.213 | -3,78 | ||||
| 2026-02-03 | 13F | Ethic Inc. | 6.287 | 57,61 | 575 | 72,16 | ||||
| 2026-02-17 | 13F | Sandler Capital Management | 36.185 | 11,75 | 3.311 | 21,92 | ||||
| 2026-02-17 | 13F | Garnet Equity Capital Holdings, Inc. | 75.694 | 0,00 | 6.925 | 9,11 | ||||
| 2026-04-20 | 13F | Ronald Blue Trust, Inc. | 64 | -39,05 | 7 | -33,33 | ||||
| 2026-02-02 | 13F | Mutual Advisors, LLC | 25.941 | -2,04 | 2.373 | 3,85 | ||||
| 2026-02-13 | 13F | Dynamic Technology Lab Private Ltd | 2.220 | 203 | ||||||
| 2026-02-13 | 13F | NewGen Asset Management Ltd | 124.900 | -3,48 | 11.427 | -13,60 | ||||
| 2026-02-19 | 13F | CI Private Wealth, LLC | 964.552 | 1.339,76 | 5.420 | -3,52 | ||||
| 2026-02-13 | 13F | Icon Advisers Inc/co | 41.000 | 3.751 | ||||||
| 2026-04-22 | 13F | ABN AMRO Bank N.V. | 0 | -100,00 | 0 | |||||
| 2026-02-13 | 13F | National Bank Of Canada /fi/ | Call | 1.370 | 104,17 | 12.543 | 122,75 | |||
| 2026-02-13 | 13F | American Century Companies Inc | 540.238 | 3,31 | 49.437 | 12,71 | ||||
| 2026-02-10 | 13F | Envestnet Asset Management Inc | 232.222 | -27,93 | 21.246 | -21,38 | ||||
| 2026-02-13 | 13F | National Bank Of Canada /fi/ | Put | 1.253 | 72,83 | 11.472 | 88,53 | |||
| 2026-01-14 | 13F | LVW Advisors, LLC | 0 | -100,00 | 0 | |||||
| 2026-02-17 | 13F | Ancora Advisors, LLC | 28.310 | 12,84 | 2.590 | 23,16 | ||||
| 2026-02-17 | 13F | Ravenswood Partners LP | 141.276 | -0,23 | 12.925 | 8,85 | ||||
| 2025-12-01 | 13F/A | Polar Asset Management Partners Inc. | 0 | -100,00 | 0 | -100,00 | ||||
| 2026-02-11 | 13F | Loup Funds, LLC | 53.390 | 4.885 | ||||||
| 2026-02-17 | 13F | Two Sigma Advisers, Lp | 78.900 | 10,50 | 7.219 | 20,56 | ||||
| 2026-01-28 | 13F | Migdal Insurance & Financial Holdings Ltd. | 745.000 | 101,35 | 68 | 119,35 | ||||
| 2026-02-14 | 13F | Militia Capital Partners, LP | 7.380 | 0,00 | 675 | 9,22 | ||||
| 2026-04-17 | 13F | HHM Wealth Advisors, LLC | 200 | 0,00 | 22 | 16,67 | ||||
| 2026-02-12 | 13F | Insigneo Advisory Services, Llc | 2.529 | -46,83 | 231 | -41,96 | ||||
| 2026-01-27 | 13F | Hedges Asset Management LLC | 4.700 | -2,08 | 430 | 6,97 | ||||
| 2026-02-03 | 13F | K.J. Harrison & Partners Inc | 7.307 | 0,00 | 670 | 8,94 | ||||
| 2026-02-13 | 13F | Ripple Effect Asset Management LP | Put | 150.000 | 13.724 | |||||
| 2026-01-27 | 13F | Private Wealth Partners, LLC | 20.200 | 0,00 | 1.848 | 9,16 | ||||
| 2026-02-17 | 13F | D. E. Shaw & Co., Inc. | Put | 162.100 | -38,81 | 14.831 | -33,24 | |||
| 2026-02-13 | 13F | Ripple Effect Asset Management LP | 130.000 | 11.894 | ||||||
| 2026-04-17 | 13F | Brown, Lisle/cummings, Inc. | 297 | 3.200,00 | 32 | |||||
| 2026-02-12 | 13F | Colonial Trust Co / SC | 14.483 | 6,99 | 1.325 | 16,74 | ||||
| 2026-02-13 | 13F | Ripple Effect Asset Management LP | Call | 40.000 | 3.660 | |||||
| 2026-02-17 | 13F | D. E. Shaw & Co., Inc. | Call | 254.700 | -36,31 | 23.311 | -30,50 | |||
| 2026-02-17 | 13F | American Trust Investment Advisors, LLC | 41.285 | -30,56 | 3.777 | -24,23 | ||||
| 2026-02-12 | 13F | Cibc World Markets Corp | 9.144 | -93,59 | 837 | -92,10 | ||||
| 2026-04-08 | 13F | Sapient Capital Llc | 5.863 | -4,74 | 637 | 13,37 | ||||
| 2026-02-09 | 13F | Williamson Legacy Group, LLC | 8.020 | 734 | ||||||
| 2026-02-17 | 13F | Quadrature Capital Ltd | 91.670 | 8.387 | ||||||
| 2026-02-09 | 13F | First National Trust Co | 5.941 | 544 | ||||||
| 2026-04-08 | 13F | Miracle Mile Advisors, LLC | 10.637 | -0,11 | 1.155 | 18,58 | ||||
| 2026-02-12 | 13F | SWAN Capital LLC | 100 | 0,00 | 9 | 12,50 | ||||
| 2025-11-13 | 13F | NewGen Equity Long/Short Fund | 129.400 | -32,60 | 13.226 | -7,21 | ||||
| 2026-04-21 | 13F | Founders Capital Management | 400 | 33,33 | 43 | 59,26 | ||||
| 2026-01-29 | 13F | Sanctuary Advisors, LLC | 24.189 | -5,96 | 2.213 | 2,64 | ||||
| 2026-02-05 | 13F | Elyxium Wealth, LLC | 56 | 5 | ||||||
| 2026-04-17 | 13F | Ambassador Advisors, LLC | 52.502 | -1,54 | 5.702 | 16,89 | ||||
| 2025-11-13 | 13F | Sienna Gestion | 0 | -100,00 | 0 | -100,00 | ||||
| 2026-02-13 | 13F | Pinpoint Asset Management (Singapore) Pte. Ltd. | 1.000 | 0,00 | 91 | 9,64 | ||||
| 2026-01-30 | 13F | Wealth High Governance Capital Ltda | 122.052 | 11.167 | ||||||
| 2026-02-18 | 13F | Guardian Capital Lp | 38.672 | -82,78 | 3.543 | -81,21 | ||||
| 2026-02-13 | 13F | Baird Financial Group, Inc. | 42.364 | 3,66 | 3.876 | 13,07 | ||||
| 2026-01-22 | 13F | Personal Cfo Solutions, Llc | 2.843 | -1,56 | 260 | 7,44 | ||||
| 2026-02-17 | 13F | Old West Investment Management, LLC | 202.247 | -2,97 | 18.504 | 5,86 | ||||
| 2026-02-13 | 13F | Pathstone Holdings, LLC | 56.742 | -15,86 | 5.191 | -8,21 | ||||
| 2026-01-30 | 13F | Jennison Associates Llc | 449.577 | -13,15 | 41.132 | -5,25 | ||||
| 2026-02-17 | 13F | D. E. Shaw & Co., Inc. | 52.300 | -11,09 | 4.785 | -3,00 | ||||
| 2025-11-04 | 13F/A | Lingohr & Partner Asset Management GmbH | 12.846 | -4,31 | 1 | |||||
| 2026-02-17 | 13F | Susquehanna Fundamental Investments, Llc | 411.400 | 0,00 | 37.639 | 9,10 | ||||
| 2026-03-13 | 13F/A | Pensionmark Financial Group, Llc | 4.970 | 455 | ||||||
| 2026-02-17 | 13F | Schonfeld Strategic Advisors LLC | 97.497 | 1.117,65 | 8.920 | 1.229,21 | ||||
| 2026-01-21 | 13F | Flagship Harbor Advisors, Llc | 1.362 | 125 | ||||||
| 2026-04-09 | 13F | Acropolis Investment Management, LLC | 4.390 | -9,41 | 477 | 7,45 | ||||
| 2026-02-17 | 13F | Janus Henderson Group Plc | 76.818 | -11,86 | 7.037 | -3,85 | ||||
| 2026-02-04 | 13F | Seelaus Asset Management LLC | 32.790 | 2,85 | 3.000 | 12,20 | ||||
| 2026-02-17 | 13F | Polymer Capital Management (US) LLC | Call | 12.500 | 1.144 | |||||
| 2026-04-23 | 13F | First Pacific Financial | 1.382 | 42,03 | 150 | 68,54 | ||||
| 2026-02-10 | 13F | Daiwa Securities Group Inc. | 24.400 | 0,00 | 2 | 0,00 | ||||
| 2026-02-13 | 13F | Stifel Financial Corp | 406.110 | 10,12 | 37.156 | 20,14 | ||||
| 2026-02-23 | 13F | Mv Capital Management, Inc. | 5 | 0 | ||||||
| 2026-02-17 | 13F | Credit Agricole S A | 73.409 | -5,36 | 6.716 | 3,26 | ||||
| 2026-02-06 | 13F | HighTower Advisors, LLC | Put | 0 | -100,00 | 0 | -100,00 | |||
| 2026-02-12 | 13F | Hohimer Wealth Management, Llc | 0 | -100,00 | 0 | |||||
| 2026-01-20 | 13F | Ntv Asset Management Llc | 49.869 | -36,45 | 4.563 | -30,68 | ||||
| 2026-02-03 | 13F | Maxi Investments CY Ltd | 12.800 | 1 | ||||||
| 2026-02-12 | 13F | Hohimer Wealth Management, Llc | Put | 0 | -100,00 | 0 | ||||
| 2026-02-17 | 13F | Capital Fund Management S.a. | Put | 414.500 | 4,33 | 37.923 | 13,82 | |||
| 2026-02-17 | 13F | Capital Fund Management S.a. | Call | 412.700 | -0,53 | 37.758 | 8,52 | |||
| 2026-02-13 | 13F | FORA Capital, LLC | 0 | -100,00 | 0 | |||||
| 2026-02-13 | 13F | Healthcare Of Ontario Pension Plan Trust Fund | 181.000 | 16.575 | ||||||
| 2026-02-06 | 13F | Tanglewood Legacy Advisors, LLC | 955 | -4,50 | 87 | 4,82 | ||||
| 2026-02-13 | 13F | Healthcare Of Ontario Pension Plan Trust Fund | Call | 50.000 | 0,00 | 4.579 | 9,13 | |||
| 2026-01-16 | 13F | Crewe Advisors LLC | 1.000 | 0,00 | 91 | 9,64 | ||||
| 2026-02-17 | 13F | Equitable Holdings, Inc. | 5.328 | 19,06 | 487 | 29,87 | ||||
| 2026-02-06 | 13F | Berbice Capital Management LLC | 100 | 0,00 | 9 | 12,50 | ||||
| 2025-11-14 | 13F | Point72 (DIFC) Ltd | Put | 1.900 | 159 | |||||
| 2025-11-14 | 13F | Point72 (DIFC) Ltd | 405 | -98,80 | 34 | -98,68 | ||||
| 2026-01-08 | 13F | Ulland Investment Advisors, LLC | 800 | 0 | ||||||
| 2026-02-06 | 13F | Vestmark Advisory Solutions, Inc. | 24.846 | 345,19 | 2.273 | 385,68 | ||||
| 2026-02-11 | 13F | Saturna Capital CORP | 10.092 | 923 | ||||||
| 2026-02-11 | 13F | Zions Bancorporation, National Association /ut/ | 7.119 | -2,00 | 651 | 6,90 | ||||
| 2026-02-24 | 13F | Amanah Holdings Trust | 0 | -100,00 | 0 | |||||
| 2026-02-06 | 13F | Fortis Group Advisors, LLC | 2.923 | -0,07 | 361 | 20,81 | ||||
| 2026-02-13 | 13F | Ausdal Financial Partners, Inc. | 3.292 | -27,39 | 301 | -20,79 | ||||
| 2026-04-07 | 13F | CoreCap Advisors, LLC | 1.575 | 7,80 | 171 | 28,57 | ||||
| 2026-02-11 | 13F | Hughes Financial Services, LLC | 275 | 0,00 | 25 | 0,00 | ||||
| 2026-02-12 | 13F | JT Stratford LLC | 2.819 | -10,37 | 258 | -2,28 | ||||
| 2026-04-20 | 13F | Sowell Financial Services LLC | 14.679 | -3,78 | 1.594 | 14,27 | ||||
| 2026-04-23 | 13F | Oppenheimer Asset Management Inc. | 3.818 | 2,36 | 415 | 21,41 | ||||
| 2026-01-26 | 13F | AE Wealth Management LLC | 8.536 | -3,04 | 781 | 5,69 | ||||
| 2026-02-11 | 13F | ARK Investment Management LLC | 354.391 | 10,39 | 32.423 | 20,43 | ||||
| 2026-02-13 | 13F | Johnson Investment Counsel Inc | 0 | -100,00 | 0 | |||||
| 2026-01-27 | 13F | Financial Management Professionals, Inc. | 0 | -100,00 | 0 | |||||
| 2026-02-11 | 13F | Fiera Capital Corp | 3.261 | -3,75 | 299 | 4,93 | ||||
| 2026-02-17 | 13F | Cresset Asset Management, LLC | 13.937 | 26,18 | 1.275 | 37,69 | ||||
| 2026-02-17 | 13F | Alliancebernstein L.p. | 1.880.666 | -46,56 | 172.062 | -41,70 | ||||
| 2026-02-05 | 13F | Atria Investments Llc | 13.988 | -1,39 | 1.280 | 7,57 | ||||
| 2025-11-07 | 13F | Beacon Capital Management, LLC | 0 | -100,00 | 0 | |||||
| 2026-02-17 | 13F | PenderFund Capital Management Ltd. | 7.300 | 668 | ||||||
| 2026-02-13 | 13F | Fifth Lane Capital, Lp | 3.000 | 274 | ||||||
| 2026-02-17 | 13F | Tower Research Capital LLC (TRC) | 5.622 | -70,59 | 514 | -67,94 | ||||
| 2026-02-12 | 13F | Tripletail Wealth Management, LLC | 1.000 | -23,08 | 91 | -20,87 | ||||
| 2026-02-12 | 13F | Keel Point, LLC | 5.806 | 2,36 | 531 | 11,79 | ||||
| 2026-02-11 | 13F | Galilei Investment Office LLP | 0 | -100,00 | 0 | |||||
| 2026-01-29 | 13F | Simon Quick Advisors, Llc | 3.351 | 5,28 | 307 | 15,04 | ||||
| 2026-04-22 | 13F | Oak Harvest Investment Services | 36.290 | -21,87 | 3.941 | -7,25 | ||||
| 2026-04-23 | 13F | Oppenheimer & Co Inc | 37.789 | 28,59 | 4.104 | 52,68 | ||||
| 2026-02-13 | 13F | Cornerstone Financial Management LLC | 18 | 2 | ||||||
| 2026-01-16 | 13F | Formidable Asset Management, LLC | 0 | -100,00 | 0 | |||||
| 2026-02-17 | 13F | Old Mission Capital Llc | 51.448 | 4.707 | ||||||
| 2026-02-13 | 13F | Archetype Wealth Partners | 0 | -100,00 | 0 | |||||
| 2026-02-12 | 13F | Barings Llc | 44.548 | 47,14 | 4.079 | 60,59 | ||||
| 2026-02-04 | 13F | Aubrey Capital Management Ltd | 43.200 | -4,85 | 3.952 | 3,81 | ||||
| 2025-11-13 | 13F | Bnp Paribas Arbitrage, Sa | Call | 0 | -100,00 | 0 | -100,00 | |||
| 2026-02-17 | 13F | Hilltop Holdings Inc. | 3.977 | -3,87 | 364 | 4,91 | ||||
| 2026-01-29 | 13F | Calamos Advisors LLC | 49.138 | 11,34 | 4.496 | 21,49 | ||||
| 2026-02-05 | 13F | HighMark Wealth Management LLC | 22 | 2 | ||||||
| 2026-02-17 | 13F | MGB Wealth Management, LLC | 9.926 | 0,02 | 908 | 9,13 | ||||
| 2026-02-09 | 13F | Kingsview Wealth Management, LLC | 3.435 | 3,43 | 314 | 12,95 | ||||
| 2026-02-13 | 13F | Brown Advisory Inc | 11.773 | -7,36 | 1.077 | 1,13 | ||||
| 2025-11-13 | 13F | Bnp Paribas Arbitrage, Sa | Put | 0 | -100,00 | 0 | -100,00 | |||
| 2026-02-13 | 13F | Goehring & Rozencwajg Associates, LLC | 682.952 | 5,35 | 62.483 | 14,93 | ||||
| 2026-02-09 | 13F | Fidelis Capital Partners, LLC | 3.437 | 0,00 | 314 | 9,03 | ||||
| 2026-02-11 | 13F | LPL Financial LLC | 359.275 | -24,42 | 32.870 | -17,54 | ||||
| 2026-04-22 | 13F | Caldwell Trust Co | 1.344 | 0,00 | 146 | 18,85 | ||||
| 2026-04-20 | 13F | Heritage Wealth Management, Inc. | 30.325 | -0,33 | 3.294 | 18,33 | ||||
| 2026-01-16 | 13F | Trust Co Of Vermont | 384 | 0,00 | 35 | 9,38 | ||||
| 2026-02-12 | 13F | Renaissance Technologies Llc | 219.700 | -7,10 | 20.100 | 1,36 | ||||
| 2026-02-12 | 13F | Brinker Capital Investments, LLC | 25.589 | -30,68 | 2.341 | -24,36 | ||||
| 2026-02-13 | 13F | Quarry LP | 172 | 16 | ||||||
| 2026-04-16 | 13F | Freedom Financial Partners LLC | 2.532 | 0,00 | 275 | 19,05 | ||||
| 2026-02-12 | 13F | Skopos Labs, Inc. | 3.408 | 42,24 | 316 | 58,00 | ||||
| 2026-01-20 | 13F | Cigna Investments Inc /new | 7.805 | 0,00 | 1 | |||||
| 2026-02-11 | 13F | Tacita Capital Inc | 5.867 | 738,14 | 538 | 825,86 | ||||
| 2026-02-20 | 13F | Kovitz Investment Group Partners, LLC | 0 | -100,00 | 0 | |||||
| 2026-04-15 | 13F | Regatta Capital Group, Llc | 1.872 | 203 | ||||||
| 2026-01-29 | 13F | UBS Group AG | Put | 90.000 | 63,64 | 8.234 | 78,53 | |||
| 2026-01-29 | 13F | UBS Group AG | 1.258.235 | 1,84 | 115.116 | 11,11 | ||||
| 2026-02-17 | 13F | Russell Investments Group, Ltd. | 360.460 | 18,42 | 33.007 | 29,17 | ||||
| 2026-02-23 | 13F | Walser Wealth Management Company, A Ltd Liability Co | 3.607 | 330 | ||||||
| 2026-02-06 | 13F | Envestnet Portfolio Solutions, Inc. | 0 | -100,00 | 0 | |||||
| 2026-02-17 | 13F | Df Dent & Co Inc | 0 | -100,00 | 0 | |||||
| 2026-04-22 | 13F | Pasadena Private Wealth, LLC | Put | 500 | 0,00 | 0 | ||||
| 2026-02-13 | 13F | Resources Investment Advisors, LLC. | 19.919 | -1,30 | 1.822 | 7,68 | ||||
| 2026-04-22 | 13F | Adams Natural Resources Fund, Inc. | 18.000 | 0,00 | 1.955 | 18,71 | ||||
| 2026-02-17 | 13F | Driehaus Capital Management Llc | 1.522.638 | -12,86 | 139.306 | -4,93 | ||||
| 2026-03-06 | 13F | Hsbc Holdings Plc | 34.163 | -85,87 | 3.139 | -84,53 | ||||
| 2026-02-11 | 13F | Sharpepoint Llc | 4.461 | 408 | ||||||
| 2026-04-13 | 13F | Loring Wolcott & Coolidge Fiduciary Advisors Llp/ma | 5.000 | 0,00 | 580 | -7,79 | ||||
| 2026-02-11 | 13F | Strategic Advocates LLC | 330 | 0,00 | 30 | 11,11 | ||||
| 2026-02-10 | 13F | Bnp Paribas | 30.867 | 3,18 | 2.819 | 12,40 | ||||
| 2026-02-17 | 13F | Prosperity Consulting Group, LLC | 10.842 | 10,16 | 992 | 20,12 | ||||
| 2026-04-09 | 13F | Wealth Alliance Advisory Group, LLC | 2.833 | 0,00 | 308 | 18,53 | ||||
| 2026-01-23 | 13F | Bridgewater Advisors Inc. | 3.375 | -1,14 | 413 | 33,77 | ||||
| 2026-02-17 | 13F | Fullerton Fund Management Co Ltd | 893.999 | 33,22 | 81.792 | 45,34 | ||||
| 2026-01-22 | 13F | Massachusetts Financial Services Co /ma/ | 2.905.617 | 5,44 | 265.835 | 15,03 | ||||
| 2026-04-17 | 13F | Cidel Asset Management Inc | 75.000 | 0,00 | 8.130 | 18,24 | ||||
| 2026-04-22 | 13F | Pasadena Private Wealth, LLC | Call | 500 | 0,00 | 12 | 0,00 | |||
| 2026-01-29 | 13F | Quadcap Wealth Management, LLC | 2.351 | 39,53 | 215 | 52,48 | ||||
| 2025-11-13 | 13F | Hartree Partners, LP | 0 | -100,00 | 0 | -100,00 | ||||
| 2026-02-10 | 13F | KERR FINANCIAL PLANNING Corp | 0 | -100,00 | 0 | |||||
| 2026-04-22 | 13F | Union Bancaire Privee, UBP SA | 52.746 | 106,11 | 4.863 | 133,86 | ||||
| 2026-02-12 | 13F | Umpqua Bank | 7.435 | -4,15 | 680 | -6,08 | ||||
| 2026-02-17 | 13F | Boreal Capital Management LLC | 226 | 0,00 | 21 | 11,11 | ||||
| 2026-03-12 | 13F/A | Peak6 Llc | Call | 243.700 | -67,68 | 22.296 | -64,74 | |||
| 2026-02-11 | 13F | TCTC Holdings, LLC | 25 | 0,00 | 2 | 0,00 | ||||
| 2026-03-12 | 13F/A | Peak6 Llc | Put | 245.300 | -27,04 | 22.442 | -20,40 | |||
| 2026-04-24 | 13F | Essex Financial Services, Inc. | 3.081 | -6,10 | 335 | 11,33 | ||||
| 2026-02-13 | 13F | Arete Wealth Advisors, LLC | 4.533 | -11,05 | 0 | |||||
| 2026-01-23 | 13F | Tectonic Advisors Llc | 0 | -100,00 | 0 | |||||
| 2026-02-03 | 13F | Pilgrim Partners Asia Pte Ltd | 1.160 | 106 | ||||||
| 2026-02-12 | 13F | Laffer Investments | 5.230 | 70,25 | 478 | 85,99 | ||||
| 2026-02-13 | 13F | Royal London Asset Management Ltd | 18.455 | -4,56 | 1.688 | 4,13 | ||||
| 2026-02-10 | 13F | Reaves W H & Co Inc | 1.453.978 | -0,12 | 133.024 | 8,96 | ||||
| 2026-02-17 | 13F | Engineers Gate Manager LP | 21.473 | 77,90 | 1.965 | 94,07 | ||||
| 2026-01-29 | 13F | Quadcap Wealth Management, LLC | Call | 1.200 | 0,00 | 110 | 9,00 | |||
| 2026-02-13 | 13F | Morgan Stanley | 4.978.333 | 6,95 | 455.468 | 16,69 | ||||
| 2026-02-17 | 13F | Freshford Capital Management, LLC | 0 | -100,00 | 0 | |||||
| 2026-04-16 | 13F | EdgeRock Capital LLC | 10.195 | -21,32 | 1.107 | -6,58 | ||||
| 2026-02-12 | 13F | Bank Of Nova Scotia Trust Co | 10.407 | -2,02 | 952 | 6,97 | ||||
| 2026-04-24 | 13F | Canton Hathaway, LLC | 5.000 | 0,00 | 543 | 18,82 | ||||
| 2026-02-10 | 13F | Greenwich Wealth Management LLC | 237.048 | 5,36 | 22 | 16,67 | ||||
| 2026-04-15 | 13F | Avanza Fonder AB | 39.389 | 0,00 | 5.959 | 20,36 | ||||
| 2026-04-20 | 13F | Oak Family Advisors, Llc | 3.065 | 0,00 | 333 | 18,57 | ||||
| 2026-02-17 | 13F | Moore Capital Management, Lp | 275.000 | 165,51 | 25.160 | 189,68 | ||||
| 2026-02-17 | 13F | Public Employees Retirement System Of Ohio | 41.802 | 41,47 | 3.833 | 54,52 | ||||
| 2026-04-13 | 13F | Jackson Square Capital, Llc | 2.000 | 217 | ||||||
| 2026-02-13 | 13F | Fairfield, Bush & Co. | 30.921 | 10,39 | 2.829 | 20,44 | ||||
| 2026-02-17 | 13F | NorthRock Partners, LLC | 2.714 | 4,38 | 248 | 13,76 | ||||
| 2026-04-06 | 13F | Miller Global Investments, LLC | 152 | 17 | ||||||
| 2026-02-12 | 13F/A | Pinebridge Investments Llc | 29.654 | 3.727 | ||||||
| 2026-02-13 | 13F | K2 Principal Fund, L.p. | 0 | -100,00 | 0 | -100,00 | ||||
| 2026-02-17 | 13F | SageView Advisory Group, LLC | 101 | 9 | ||||||
| 2026-02-17 | 13F | Citadel Advisors Llc | Put | 2.143.700 | -4,32 | 196.127 | 4,39 | |||
| 2026-02-17 | 13F | Citadel Advisors Llc | 557.208 | 14,36 | 50.979 | 24,76 | ||||
| 2026-01-26 | 13F | Keystone Wealth Services, LLC | 11.554 | -0,11 | 1.057 | 8,97 | ||||
| 2026-04-16 | 13F | Azarias Capital Management, L.P. | 50.371 | -42,58 | 5.471 | -31,85 | ||||
| 2026-01-12 | 13F | VisionPoint Advisory Group, LLC | 28.343 | -6,81 | 2.593 | 1,69 | ||||
| 2026-04-27 | 13F | Y-Intercept (Hong Kong) Ltd | 123.024 | 13.362 | ||||||
| 2026-02-13 | 13F | Verition Fund Management LLC | Call | 64.000 | 0,00 | 5.855 | 9,09 | |||
| 2026-02-13 | 13F | Verition Fund Management LLC | 95.204 | 160,84 | 8.710 | 184,64 | ||||
| 2026-01-26 | 13F | Private Trust Co Na | 2.448 | -6,60 | 224 | 1,83 | ||||
| 2026-02-12 | 13F | Mount Yale Investment Advisors, LLC | 5.296 | 484 | ||||||
| 2026-02-18 | 13F | VGI Partners Ltd | 375.990 | -16,00 | 34.399 | -8,35 | ||||
| 2026-02-03 | 13F | Generali Asset Management SPA SGR | 3.678 | -5,13 | 462 | 2,21 | ||||
| 2025-11-21 | 13F/A | CIBC Bancorp USA Inc. | Call | 168.000 | 14.088 | |||||
| 2026-04-16 | 13F | Terra Nova Asset Management LLC | 37.598 | 2,95 | 4.084 | 22,21 | ||||
| 2026-02-13 | 13F | Verition Fund Management LLC | Put | 167.400 | 132,50 | 15.315 | 153,69 | |||
| 2026-04-08 | 13F | West Financial Advisors, LLC | 0 | -100,00 | 0 | |||||
| 2026-02-13 | 13F | Financial Sense Advisors, Inc. | 14.710 | 208,97 | 1.346 | 237,09 | ||||
| 2026-02-17 | 13F | Kerrisdale Advisers, LLC | 9.655 | -61,97 | 883 | -58,53 | ||||
| 2026-01-30 | 13F | Sage Rhino Capital Llc | Call | 0 | -100,00 | 0 | -100,00 | |||
| 2026-04-06 | 13F | Highline Wealth Partners Llc | 47 | 0,00 | 5 | 25,00 | ||||
| 2026-02-04 | 13F | Sentry Investment Management Llc | 0 | -100,00 | 0 | |||||
| 2026-02-10 | 13F | Td Asset Management Inc | 4.370.884 | -5,45 | 400.753 | 3,27 | ||||
| 2026-02-17 | 13F | Cantor Fitzgerald, L. P. | 0 | -100,00 | 0 | -100,00 | ||||
| 2026-02-12 | 13F | Alps Advisors Inc | 3.948.599 | 1,15 | 361.257 | 10,35 | ||||
| 2025-11-14 | 13F | Jupiter Wealth Management LLC | 0 | -100,00 | 0 | |||||
| 2026-04-10 | 13F | Magnus Financial Group LLC | 4.331 | 35,17 | 470 | 60,41 | ||||
| 2026-02-13 | 13F | Dixon Mitchell Investment Counsel Inc. | 1.647 | 151 | ||||||
| 2025-11-14 | 13F | Jain Global LLC | 0 | -100,00 | 0 | |||||
| 2026-01-28 | 13F | Barrett & Company, Inc. | 50 | 0,00 | 5 | 0,00 | ||||
| 2026-02-17 | 13F | Citadel Advisors Llc | Call | 3.208.100 | 1,70 | 293.509 | 10,95 | |||
| 2026-04-21 | 13F | Pflug Koory, LLC | 4 | 0,00 | 0 | |||||
| 2026-02-10 | 13F | Connor, Clark & Lunn Investment Management Ltd. | 4.312.230 | 0,49 | 394.838 | 9,66 | ||||
| 2026-02-11 | 13F | Erste Asset Management GmbH | 0 | 0 | ||||||
| 2026-04-17 | 13F | Webster Bank, N. A. | 140 | 0,00 | 15 | 25,00 | ||||
| 2025-11-13 | 13F | LGT Group Foundation | 0 | -100,00 | 0 | |||||
| 2025-11-14 | 13F | PineBridge Investments, L.P. | 36.329 | 4.243 | ||||||
| 2026-02-09 | 13F | Hantz Financial Services, Inc. | 21.850 | -6,95 | 2 | 0,00 | ||||
| 2026-02-09 | 13F | Wellington Shields Capital Management, LLC | 14.600 | 0,00 | 1.336 | 9,07 | ||||
| 2026-02-17 | 13F | SIH Partners, LLLP | 11.580 | 1.059 | ||||||
| 2026-01-28 | 13F | DekaBank Deutsche Girozentrale | 126.964 | 0,00 | 7 | -40,00 | ||||
| 2026-01-26 | 13F | Abbington Investment Group | 0 | -100,00 | 0 | |||||
| 2026-04-22 | 13F | Samalin Investment Counsel, LLC | 5.550 | 3,41 | 603 | 22,61 | ||||
| 2026-02-13 | 13F | Polymer Capital Management (HK) LTD | 0 | -100,00 | 0 | |||||
| 2025-11-14 | 13F | Axa S.a. | 0 | -100,00 | 0 | |||||
| 2026-04-22 | 13F | Pasadena Private Wealth, LLC | 2.635 | -7,87 | 286 | 9,58 | ||||
| 2026-04-07 | 13F | Estate Planners Group, LLC | 190 | 17 | ||||||
| 2026-01-15 | 13F | Capital Advisors Inc/ok | 576.040 | -11,16 | 52.702 | -3,07 | ||||
| 2026-02-13 | 13F | Corient IA LLC | 5.960 | -40,40 | 545 | -34,96 | ||||
| 2026-01-23 | 13F | Rsm Us Wealth Management Llc | 6.721 | -21,31 | 614 | -14,25 | ||||
| 2026-04-21 | 13F | Vanguard Capital Wealth Advisors This fund is a listed as child fund of Vanguard Group Inc and if that institution has disclosed ownership in this security, then these positions will not be double counted when calculating total shares and total value | 14.248 | -36,39 | 1.547 | -24,50 | ||||
| 2026-01-20 | 13F | Steel Peak Wealth Management LLC | 25.572 | -4,05 | 2.340 | 4,70 | ||||
| 2026-02-13 | 13F | Kestra Advisory Services, LLC | 0 | -100,00 | 0 | |||||
| 2026-01-28 | 13F | Legacy Capital Group California, Inc. | 4.266 | -61,93 | 390 | -58,47 | ||||
| 2026-02-05 | 13F | Cambridge Investment Research Advisors, Inc. | 70.341 | -1,17 | 6 | 20,00 | ||||
| 2026-02-13 | 13F | First Trust Advisors Lp | 28.144 | 162,49 | 2.576 | 186,54 | ||||
| 2026-04-21 | 13F | Blue Jean Financial Llc | 16.268 | 1.767 | ||||||
| 2026-04-16 | 13F | Fiduciary Advisors, Inc. | 5 | 0,00 | 1 | |||||
| 2026-02-17 | 13F | Laird Norton Trust Company, Llc | 27.413 | 2.508 | ||||||
| 2026-02-13 | 13F | Alberta Investment Management Corp | 30.200 | 2.765 | ||||||
| 2026-02-17 | 13F | Hood River Capital Management LLC | 52.640 | 17,40 | 4.816 | 28,09 | ||||
| 2026-02-05 | 13F | Center for Financial Planning, Inc. | 175 | 0,00 | 16 | 14,29 | ||||
| 2026-02-02 | 13F | Principal Financial Group Inc | 210.853 | -53,97 | 19.300 | -49,77 | ||||
| 2026-02-17 | 13F | Zurich Insurance Group Ltd/FI | 140.875 | 0,47 | 12.912 | 9,81 | ||||
| 2026-02-12 | 13F | Quadrant Capital Group Llc | 35.305 | -0,01 | 3.230 | 9,12 | ||||
| 2026-02-02 | 13F | Cornerstone Planning Group LLC | 155 | 8,39 | 21 | 42,86 | ||||
| 2026-02-06 | 13F | Gables Capital Management Inc. | 1.950 | 178 | ||||||
| 2026-04-22 | 13F | Joel Isaacson & Co., LLC | 2.420 | -0,86 | 263 | 17,49 | ||||
| 2026-04-21 | 13F | Montgomery Investment Management Inc | 22.252 | 1,83 | 2.417 | 20,86 | ||||
| 2026-02-10 | 13F | Natixis Advisors, L.p. | 56.817 | -26,89 | 5 | -16,67 | ||||
| 2026-04-07 | 13F | U.S. Capital Wealth Advisors, LLC | 23.328 | -20,84 | 2.534 | -6,05 | ||||
| 2025-11-07 | 13F | Shell Asset Management Co | 8.500 | -7,61 | 1 | |||||
| 2026-02-12 | 13F | Rossby Financial, LCC | 11.825 | -12,41 | 1.082 | -4,08 | ||||
| 2026-02-10 | 13F | Marietta Investment Partners Llc | 14.485 | 430,59 | 1.325 | 481,14 | ||||
| 2026-02-12 | 13F | Aristides Capital LLC | 24.018 | 42,81 | 2.197 | 55,82 | ||||
| 2026-04-22 | 13F | Viewpoint Investment Partners Corp | 5.727 | 632 | ||||||
| 2026-02-17 | 13F | Merewether Investment Management, LP | 88.854 | 0,00 | 8.129 | 9,10 | ||||
| 2026-02-17 | 13F | Agf Management Ltd | 2.299.732 | -2,38 | 210.519 | 6,51 | ||||
| 2026-02-17 | 13F | Temasek Holdings (Private) Ltd | 0 | -100,00 | 0 | |||||
| 2026-04-21 | 13F | Paradigm Financial Partners, Llc | 12.783 | -87,65 | 1.388 | -85,34 | ||||
| 2026-02-13 | 13F | Sei Investments Co | 50.358 | -67,19 | 4.607 | -64,21 | ||||
| 2026-02-10 | 13F | SCP Investment, LP | 8.800 | 83,33 | 805 | 100,25 | ||||
| 2026-02-13 | 13F | Arrowstreet Capital, Limited Partnership | 5.340 | 489 | ||||||
| 2026-04-15 | 13F | FNY Investment Advisers, LLC | Call | 0 | -100,00 | 0 | ||||
| 2026-02-06 | 13F | Resolute Wealth Strategies, LLC | 2.268 | 208 | ||||||
| 2026-04-23 | 13F | iA Global Asset Management Inc. | 483.733 | 0,49 | 53 | 18,18 | ||||
| 2026-01-20 | 13F | SHEPHERD WEALTH MANAGEMENT Ltd LIABILITY Co | 21.578 | 2.513 | ||||||
| 2026-02-09 | 13F | Huntington National Bank | 10.564 | -4,91 | 967 | 3,76 | ||||
| 2026-02-09 | 13F | Annis Gardner Whiting Capital Advisors, LLC | 1.939 | 177 | ||||||
| 2026-02-17 | 13F | Pinnacle Financial Partners, Inc. | 49.696 | 4.547 | ||||||
| 2026-03-27 | 13F | Prosperity Wealth Management, Inc. | 4.860 | 445 | ||||||
| 2026-01-28 | 13F | Geneos Wealth Management Inc. | 7.193 | -13,26 | 658 | -5,32 | ||||
| 2026-04-27 | 13F | Fideuram - Intesa Sanpaolo Private Banking S.p.a. | 75.091 | -15,64 | 8.156 | 0,15 | ||||
| 2026-02-05 | 13F | S&co Inc | 356.326 | -31,14 | 33 | -25,58 | ||||
| 2026-02-17 | 13F | Aventail Capital Group, LP | 0 | -100,00 | 0 | |||||
| 2026-02-09 | 13F | Councilmark Asset Management, LLC | 24.585 | -2,69 | 2.249 | 6,19 | ||||
| 2026-02-11 | 13F | Franklin Resources Inc | 215.069 | 13,36 | 19.689 | 23,70 | ||||
| 2026-02-17 | 13F | DZ BANK AG Deutsche Zentral Genossenschafts Bank, Frankfurt am Main | 4.989.551 | -14,82 | 456.494 | -7,12 | ||||
| 2026-04-16 | 13F | Balboa Wealth Partners | 12.336 | -5,59 | 1.340 | 12,05 | ||||
| 2026-04-16 | 13F | Rainier Family Wealth Inc | 42.369 | 18,98 | 4.602 | 41,26 | ||||
| 2026-02-17 | 13F | Raymond James Financial Inc | 688.214 | 5,92 | 62.965 | 15,56 | ||||
| 2026-02-17 | 13F | Optiver Holding B.V. | 26 | 2 | ||||||
| 2026-02-03 | 13F | Legacy Wealth Managment, LLC/ID | 6 | 0,00 | 1 | |||||
| 2026-02-11 | 13F | SOUTH STATE Corp | 41 | 4 | ||||||
| 2026-04-17 | 13F | RFG Advisory, LLC | 6.174 | 671 | ||||||
| 2026-02-12 | 13F | Bradley Foster & Sargent Inc/ct | 49.108 | -9,29 | 4.493 | -1,04 | ||||
| 2026-02-13 | 13F | MAI Capital Management | 3.213 | 10,30 | 294 | 20,08 | ||||
| 2025-11-03 | 13F/A | C2P Capital Advisory Group, LLC d.b.a. Prosperity Capital Advisors | 5.252 | 390 | ||||||
| 2026-01-29 | 13F | Ashton Thomas Private Wealth, LLC | 5.436 | -63,36 | 497 | -60,05 | ||||
| 2026-01-30 | 13F | Simplicity Wealth,LLC | 4.486 | 4,98 | 410 | 14,53 | ||||
| 2026-01-21 | 13F | Newbridge Financial Services Group, Inc. | 19.549 | -8,07 | 1.789 | 0,28 | ||||
| 2026-04-08 | 13F | Canandaigua National Corp | 3.112 | 338 | ||||||
| 2026-02-17 | 13F | Fairscale Capital, LLC | 127 | 0,00 | 12 | 10,00 | ||||
| 2026-04-17 | 13F | Vermillion Wealth Management, Inc. | 200 | 0,00 | 22 | 16,67 | ||||
| 2026-01-22 | 13F | Kennebec Savings Bank | 0 | -100,00 | 0 | |||||
| 2026-04-20 | 13F | Courier Capital Llc | 0 | -100,00 | 0 | |||||
| 2026-02-04 | 13F | Midwest Trust Co | 2.522 | 4,82 | 231 | 14,43 | ||||
| 2026-02-17 | 13F | Westwood Holdings Group Inc | 0 | -100,00 | 0 | |||||
| 2026-04-23 | 13F | Elevate Capital Advisors, LLC | 2.023 | 220 | ||||||
| 2026-02-12 | 13F | Callan Family Office, LLC | 5.831 | 0,17 | 533 | 9,22 | ||||
| 2026-02-11 | 13F | Orion Investment Co | 52.238 | 3,28 | 4.779 | 12,69 | ||||
| 2026-04-02 | 13F | Ares Financial Consulting, LLC | 51 | 0,00 | 6 | 25,00 | ||||
| 2026-01-30 | 13F | Bogart Wealth, LLC | 1.020 | -39,39 | 93 | -34,04 | ||||
| 2026-02-12 | 13F | Aviva Plc | 368.333 | 5,39 | 33.753 | 15,18 | ||||
| 2026-04-22 | 13F | Spirepoint Private Client, Llc | 4.145 | 450 | ||||||
| 2026-02-03 | 13F | Morse Asset Management, Inc | 17.234 | 1.577 | ||||||
| 2026-02-13 | 13F | Wealth Alliance | 8.241 | -3,84 | 754 | 4,87 | ||||
| 2026-02-13 | 13F | Cohen & Steers, Inc. | 109.932 | -16,40 | 10 | -9,09 | ||||
| 2026-02-11 | 13F | Capital Research Global Investors | 529.699 | 20,73 | 48.503 | 31,72 | ||||
| 2026-02-13 | 13F | First National Bank Of Omaha | 7.363 | 673 | ||||||
| 2026-01-29 | 13F | S.A. Mason LLC | 2.436 | 4,77 | 223 | 14,43 | ||||
| 2026-02-13 | 13F | Venture Visionary Partners LLC | 3.030 | -18,77 | 277 | -11,22 | ||||
| 2026-01-28 | 13F | Eagle Global Advisors Llc | 6.023 | 2,08 | 551 | 11,54 | ||||
| 2026-02-17 | 13F | Game Creek Capital, LP | 21.100 | -9,73 | 1.930 | -1,53 | ||||
| 2026-01-30 | 13F | Pvg Asset Management Corp | 2.341 | 214 | ||||||
| 2026-03-02 | 13F | Tobam | 5.521 | 1.126,89 | 1 | |||||
| 2026-02-10 | 13F | Private Wealth Asset Management, LLC | 19 | 0,00 | 2 | 0,00 | ||||
| 2026-01-13 | 13F | Stonehage Fleming Financial Services Holdings Ltd | 571 | 0,00 | 52 | 10,64 | ||||
| 2026-02-10 | 13F | CIBC World Markets Inc. | 3.857.394 | 17,70 | 353.260 | 28,53 | ||||
| 2026-02-09 | 13F | Fft Wealth Management Llc | 88.970 | 0,00 | 8.140 | 9,09 | ||||
| 2026-02-12 | 13F | Penserra Capital Management LLC | 53.417 | 14,80 | 5 | 33,33 | ||||
| 2026-02-13 | 13F | Walleye Capital LLC | Call | 111.800 | 136,86 | 10.229 | 158,41 | |||
| 2026-02-12 | 13F | Swiss Re Ltd | 218 | 20 | ||||||
| 2026-02-13 | 13F | Walleye Capital LLC | Put | 143.600 | 148,87 | 13.138 | 171,54 | |||
| 2026-02-13 | 13F | Walleye Capital LLC | 42.390 | 222,55 | 3.878 | 251,91 | ||||
| 2026-02-10 | 13F | CIBC World Markets Inc. | Call | 0 | -100,00 | 0 | -100,00 | |||
| 2026-02-17 | 13F | Engle Capital Management, L.P. | 46.230 | 4.233 | ||||||
| 2026-02-17 | 13F | Prelude Capital Management, Llc | 11.843 | -60,06 | 1.084 | -56,44 | ||||
| 2026-04-09 | 13F | Chemistry Wealth Management LLC | 3.000 | 0,00 | 326 | 18,61 | ||||
| 2026-04-23 | 13F | North Star Investment Management Corp. | 545 | 0,00 | 59 | 20,41 | ||||
| 2026-04-22 | 13F | Barnes Dennig Private Wealth Management LLC | 856 | 93 | ||||||
| 2026-01-12 | 13F | Thompson Davis & Co., Inc. | 0 | -100,00 | 0 | |||||
| 2025-11-12 | 13F | Laurel Wealth Advisors LLC | 0 | -100,00 | 0 | |||||
| 2026-02-17 | 13F | Hall Capital Management Co Inc | 3.960 | 0,00 | 362 | 9,04 | ||||
| 2026-04-22 | 13F | Gemmer Asset Management LLC | 11.579 | 0,00 | 1.258 | 18,70 | ||||
| 2026-02-13 | 13F | Rhumbline Advisers | 121 | 0,00 | 11 | 10,00 | ||||
| 2026-01-26 | 13F | Cwm, Llc | 10.364 | 11,27 | 1 | |||||
| 2026-01-30 | 13F/A | M&t Bank Corp | 4.454 | -2,00 | 407 | 6,82 | ||||
| 2026-02-13 | 13F | Mufg Securities (canada), Ltd. | 662.961 | -7,98 | 60.719 | 0,43 | ||||
| 2026-04-13 | 13F | CGC Financial Services, LLC | 0 | -100,00 | 0 | |||||
| 2026-02-12 | 13F | Riverwater Partners LLC | 6.420 | -1,97 | 587 | 6,92 | ||||
| 2026-02-17 | 13F | Ardsley Advisory Partners Lp | 35.000 | 250,00 | 3.202 | 282,10 | ||||
| 2026-02-17 | 13F | Fmr Llc | 15.100.690 | -12,78 | 1.382.352 | -4,83 | ||||
| 2026-02-13 | 13F | Wright Wealth Llc | 46.011 | 4.210 | ||||||
| 2026-02-17 | 13F | Amundi | 2.349.070 | 5,88 | 214.916 | 13,55 | ||||
| 2026-02-11 | 13F | Gordian Capital Singapore Pte Ltd | 0 | -100,00 | 0 | |||||
| 2026-02-13 | 13F | Bank Of Nova Scotia | 1.229.437 | -17,60 | 112.571 | -10,12 | ||||
| 2025-11-04 | 13F | Syntax Research, Inc. | 0 | -100,00 | 0 | |||||
| 2026-02-09 | 13F | Morningstar Investment Management LLC | 3.238 | 0 | ||||||
| 2026-02-17 | 13F | Caption Management, LLC | 100.700 | 3,92 | 9.213 | 13,38 | ||||
| 2026-02-17 | 13F | Caption Management, LLC | Put | 616.500 | 88,30 | 56.404 | 105,44 | |||
| 2026-02-17 | 13F | Blackstone Group Inc | 0 | -100,00 | 0 | |||||
| 2026-02-17 | 13F | Fwl Investment Management, Llc | 153.047 | 2,38 | 14.002 | 11,69 | ||||
| 2026-02-09 | 13F | Harbour Investments, Inc. | 4.572 | 151,90 | 418 | 175,00 | ||||
| 2026-04-21 | 13F | Sunpointe, LLC | 8.842 | -0,10 | 960 | 18,67 | ||||
| 2025-11-14 | 13F | Segra Capital Management, LLC | Call | 0 | -100,00 | 0 | -100,00 | |||
| 2026-02-13 | 13F | Evelyn Partners Investment Management LLP | 4.823 | -57,59 | 442 | -53,73 | ||||
| 2025-11-14 | 13F | Segra Capital Management, LLC | 0 | -100,00 | 0 | -100,00 | ||||
| 2026-01-16 | 13F | Worth Financial Advisory Group, LLC | 2.504 | 229 | ||||||
| 2026-02-13 | 13F | Macquarie Group Ltd | 0 | -100,00 | 0 | |||||
| 2026-02-04 | 13F | Plato Investment Management Ltd | 14.316 | -30,51 | 1.319 | -23,19 | ||||
| 2026-02-06 | 13F | Cumberland Partners Ltd | 157.246 | -14,29 | 14.411 | -6,37 | ||||
| 2026-02-17 | 13F | Ameriflex Group, Inc. | 1.140 | -6,10 | 104 | 2,97 | ||||
| 2026-02-17 | 13F | Caption Management, LLC | Call | 22.300 | -77,08 | 2.040 | -75,00 | |||
| 2026-04-15 | 13F | Covea Finance | 592.764 | -20,30 | 64.365 | -5,58 | ||||
| 2026-02-10 | 13F | Shepherd Financial Partners LLC | 0 | -100,00 | 0 | |||||
| 2026-02-02 | 13F | Vista Capital Partners, Inc. | 6.515 | 0,00 | 596 | 9,16 | ||||
| 2026-01-23 | 13F | Hardman Johnston Global Advisors LLC | 84.790 | 326,72 | 7.757 | 365,61 | ||||
| 2026-02-11 | 13F | Jpmorgan Chase & Co | 4.108.546 | 0,48 | 375.891 | 9,62 | ||||
| 2026-02-11 | 13F | Jpmorgan Chase & Co | Call | 700 | -95,81 | 64 | -95,43 | |||
| 2026-02-09 | 13F | Koesten, Hirschmann & Crabtree, INC. | 0 | -100,00 | 0 | |||||
| 2026-02-06 | 13F | Pnc Financial Services Group, Inc. | 161.694 | 0,28 | 14.793 | 9,41 | ||||
| 2026-02-13 | 13F | Change Path, LLC | 3.204 | -47,79 | 293 | -43,00 | ||||
| 2026-02-13 | 13F | Ceredex Value Advisors LLC | 265.350 | 24.277 | ||||||
| 2026-04-07 | 13F | Farther Finance Advisors, LLC | 10.252 | -20,29 | 1.139 | -3,15 | ||||
| 2026-02-13 | 13F | Wilkerson Advisory Group LLC | 3.222 | 295 | ||||||
| 2026-02-17 | 13F | Canada Pension Plan Investment Board | 2.200.324 | 11,27 | 201.481 | 21,43 | ||||
| 2026-04-15 | 13F | Bayforest Capital Ltd | 267 | 29 | ||||||
| 2026-01-22 | 13F | Glass Jacobson Investment Advisors llc | 0 | -100,00 | 0 | |||||
| 2026-02-11 | 13F | 111 Capital | 3.293 | 302 | ||||||
| 2026-01-21 | 13F | Modera Wealth Management, LLC | 4.530 | -17,26 | 414 | -9,80 | ||||
| 2026-01-22 | 13F | Bfsg, Llc | 25.255 | 0,00 | 2.311 | 9,12 | ||||
| 2026-04-24 | 13F | Keybank National Association/oh | 4.446.645 | -9,48 | 482.950 | 7,46 | ||||
| 2026-04-24 | 13F | Means Investment Co., Inc. | 16.958 | 1,90 | 1.842 | 20,96 | ||||
| 2026-02-03 | 13F | Ballentine Partners, LLC | 4.726 | -6,73 | 432 | 1,89 | ||||
| 2026-02-10 | 13F/A | Northwestern Mutual Wealth Management Co | 9.173 | 19,10 | 839 | 30,08 | ||||
| 2026-02-13 | 13F | 1832 Asset Management L.P. | 785.160 | 16,60 | 71.834 | 27,21 | ||||
| 2026-02-10 | 13F | Thames Capital Management Llc | 0 | -100,00 | 0 | |||||
| 2025-11-14 | 13F | Lloyd Harbor Capital Management, LLC | Put | 0 | -100,00 | 0 | -100,00 | |||
| 2026-04-21 | 13F | PDS Planning, Inc | 5.487 | -9,89 | 596 | 6,82 | ||||
| 2026-01-27 | 13F | Evergreen Capital Management Llc | 7.769 | -3,00 | 711 | 5,81 | ||||
| 2026-02-06 | 13F/A | Rathbone Brothers plc | 560.250 | 7,70 | 51.361 | 17,63 | ||||
| 2026-02-17 | 13F | Munro Partners | 84.770 | 7.756 | ||||||
| 2026-04-22 | 13F | Louisbourg Investments Inc. | 100 | 0,00 | 11 | 11,11 | ||||
| 2025-10-30 | 13F | Twin Peaks Wealth Advisors, LLC | 0 | -100,00 | 0 | |||||
| 2026-02-10 | 13F | Close Asset Management Ltd | 1.350 | 35,00 | 0 | |||||
| 2026-04-16 | 13F | Brookstone Capital Management | 4.183 | -45,82 | 454 | -35,69 | ||||
| 2026-02-10 | 13F | CIBC Asset Management Inc | 3.118.426 | 0,70 | 287.514 | 10,05 | ||||
| 2026-02-17 | 13F | Aristotle Capital Management, LLC | 1.504.255 | -5,49 | 137.628 | 3,11 | ||||
| 2026-02-06 | 13F | Griffin Asset Management, Inc. | 28.660 | 905,61 | 2.622 | 997,07 | ||||
| 2025-11-13 | 13F | Limestone Investment Advisors LP | 0 | -100,00 | 0 | |||||
| 2026-04-17 | 13F | CENTRAL TRUST Co | 1.734 | 80,06 | 188 | 113,64 | ||||
| 2026-02-02 | 13F | Manhattan West Asset Management, LLC | 18.057 | -2,61 | 1.652 | 6,31 | ||||
| 2026-02-13 | 13F | Golden State Wealth Management, LLC | 750 | 650,00 | 69 | 750,00 | ||||
| 2026-02-17 | 13F | BlueCrest Capital Management Ltd | 11.226 | 1.027 | ||||||
| 2025-11-13 | 13F | Marshall Wace, Llp | Put | 0 | -100,00 | 0 | -100,00 | |||
| 2026-01-29 | 13F | DecisionPoint Financial, LLC | 13 | 0,00 | 1 | 0,00 | ||||
| 2026-02-17 | 13F | United Capital Financial Advisers, Llc | 4.673 | 3,23 | 428 | 12,66 | ||||
| 2026-02-13 | 13F | Chescapmanager LLC | 443.656 | 0,00 | 40.590 | 9,10 | ||||
| 2025-11-13 | 13F | Glenmede Investment Management, LP | 2.916 | 245 | ||||||
| 2026-02-13 | 13F | Osmosis Investment Management UK Ltd | 35.157 | 3.223 | ||||||
| 2026-02-17 | 13F | Bank Of America Corp /de/ | Call | 0 | -100,00 | 0 | -100,00 | |||
| 2026-02-17 | 13F | Himension Fund | 27.289 | 14,16 | 2.497 | 24,55 | ||||
| 2026-02-11 | 13F | Prudential Plc | 0 | -100,00 | 0 | |||||
| 2025-11-10 | 13F | Options Solutions, Llc | 0 | -100,00 | 0 | |||||
| 2026-04-22 | 13F | Spire Wealth Management | 38.519 | 288,30 | 4.184 | 361,19 | ||||
| 2026-02-12 | 13F | Brown Brothers Harriman & Co | 2.030 | 3,05 | 186 | 12,12 | ||||
| 2025-11-14 | 13F | Ossiam | 0 | -100,00 | 0 | |||||
| 2026-02-10 | 13F | Goldman Sachs Group Inc | Call | 0 | -100,00 | 0 | ||||
| 2025-11-13 | 13F | Hudson Bay Capital Management LP | Put | 0 | -100,00 | 0 | ||||
| 2026-02-17 | 13F | Edmond De Rothschild Holding S.a. | 29.260 | -13,69 | 2.678 | -5,80 | ||||
| 2026-04-10 | 13F | Perigon Wealth Management, LLC | 2.116 | 230 | ||||||
| 2026-02-17 | 13F | IHT Wealth Management, LLC | 5.573 | -9,22 | 510 | -0,97 | ||||
| 2026-01-28 | 13F | HB Wealth Management, LLC | 3.453 | 316 | ||||||
| 2026-04-13 | 13F | Highland Capital Management, Llc | 2.625 | -2,78 | 285 | 15,38 | ||||
| 2026-02-17 | 13F | Bedell Frazier Investment Counseling, LLC | 3.721 | 340 | ||||||
| 2025-11-14 | 13F | BlueCrest Capital Management Ltd | Call | 55.800 | 4.679 | |||||
| 2026-02-17 | 13F | VestGen Advisors, LLC | 12.474 | -34,67 | 1.141 | -28,73 | ||||
| 2026-02-02 | 13F | Pittenger & Anderson Inc | 96 | 9 | ||||||
| 2026-04-14 | 13F | Murphy Pohlad Asset Management LLC | 58.040 | -10,97 | 6.304 | 5,68 | ||||
| 2026-03-03 | 13F | NWF Advisory Services Inc. | 13.156 | -44,73 | 1.204 | -39,73 | ||||
| 2026-01-28 | 13F | CAPROCK Group, Inc. | 14.790 | 7,35 | 1.353 | 26,92 | ||||
| 2026-02-12 | 13F | Tiemann Investment Advisors, Llc | 2.350 | 215 | ||||||
| 2026-02-03 | 13F | Costello Asset Management, INC | 800 | 73 | ||||||
| 2026-04-21 | 13F | Refined Wealth Management | 1.950 | 212 | ||||||
| 2026-01-20 | 13F | Sovran Advisors, LLC | 2.241 | -7,09 | 253 | 0,00 | ||||
| 2026-04-20 | 13F | Foster Victor Wealth Advisors, LLC | 104.450 | -15,21 | 12.122 | -15,49 | ||||
| 2026-01-29 | 13F | Sava Infond d.o.o. | 42.530 | -17,78 | 3.891 | -10,30 | ||||
| 2026-02-05 | 13F | Thrivent Financial For Lutherans | 3.494 | 0 | ||||||
| 2026-01-15 | 13F | Lodestone Wealth Management LLC | 100 | 9 | ||||||
| 2026-02-13 | 13F | Arkadios Wealth Advisors | 14.294 | 9,01 | 1.308 | 18,93 | ||||
| 2026-04-24 | 13F | Bayban | 102 | 0,00 | 11 | 22,22 | ||||
| 2026-02-10 | 13F | Bnp Paribas Arbitrage, Sa | 161.878 | 21,48 | 14.810 | 32,54 | ||||
| 2026-04-21 | 13F | Nemes Rush Group LLC | 611 | 0,00 | 66 | 20,00 | ||||
| 2026-01-14 | 13F | Appian Way Asset Management LP | 0 | -100,00 | 0 | |||||
| 2026-02-09 | 13F | Leavell Investment Management, Inc. | 54.580 | 0,00 | 4.994 | 9,09 | ||||
| 2026-02-10 | 13F | Meitav Dash Investments Ltd | 24.284 | 22,95 | 2.222 | 34,12 | ||||
| 2025-11-13 | 13F | Total Investment Management Inc | 0 | -100,00 | 0 | |||||
| 2026-02-10 | 13F | Acadian Asset Management Llc | 621.100 | -31,21 | 57 | -25,33 | ||||
| 2026-04-15 | 13F | DAVENPORT & Co LLC | 14.021 | 2,50 | 1.523 | 21,66 | ||||
| 2026-04-22 | 13F | MFA Wealth Services | 2.170 | 236 | ||||||
| 2026-04-21 | 13F | Pinnacle Associates Ltd | 304.364 | -3,68 | 33.057 | 14,35 | ||||
| 2026-01-26 | 13F | Duff & Phelps Investment Management Co | 6.670 | -26,43 | 610 | -19,74 | ||||
| 2026-02-12 | 13F | Northwest & Ethical Investments L.P. | 61.427 | 59,15 | 5.618 | 73,45 | ||||
| 2026-04-24 | 13F | UMA Financial Services, Inc. | 104 | 0,00 | 11 | 22,22 | ||||
| 2026-04-20 | 13F | Ritholtz Wealth Management | 11.491 | 73,53 | 1.248 | 106,28 | ||||
| 2026-01-26 | 13F | Roman Butler Fullerton & Co | 2.132 | -22,87 | 260 | -11,90 | ||||
| 2026-02-13 | 13F | Fiduciary Trust Co | 24.480 | -5,27 | 2.240 | 3,32 | ||||
| 2026-02-17 | 13F | Wiley Bros.-aintree Capital, Llc | 15.813 | 36,59 | 1.447 | 49,07 | ||||
| 2026-02-17 | 13F | Advisory Services Network, LLC | 13.631 | 53,71 | 1.247 | 67,83 | ||||
| 2025-11-07 | 13F | Gsa Capital Partners Llp | 0 | -100,00 | 0 | |||||
| 2026-02-13 | 13F | Parkside Financial Bank & Trust | 1.939 | 17,02 | 177 | 28,26 | ||||
| 2026-02-11 | 13F | Group One Trading, L.p. | Call | 260.400 | 31,71 | 23.824 | 43,69 | |||
| 2026-04-22 | 13F | Apollon Wealth Management, LLC | 9.286 | 249,36 | 1.009 | 314,81 | ||||
| 2026-02-11 | 13F | Group One Trading, L.p. | Put | 494.200 | 107,21 | 45.214 | 126,07 | |||
| 2026-02-11 | 13F | Group One Trading, L.p. | 99.923 | 54,90 | 9.142 | 69,00 | ||||
| 2026-01-27 | 13F | Legacy Advisors, LLC | 2.307 | 211 | ||||||
| 2026-02-12 | 13F | Marex Group plc | 12.899 | 50,16 | 1.180 | 63,89 | ||||
| 2025-11-13 | 13F | GeoWealth Management, LLC | 0 | -100,00 | 0 | |||||
| 2026-04-10 | 13F | Novem Group | 2.896 | 17,44 | 315 | 39,56 | ||||
| 2026-02-17 | 13F | Susquehanna International Group, Llp | Call | 4.176.100 | 2,26 | 382.071 | 11,56 | |||
| 2026-02-11 | 13F | Prestige Wealth Management Group LLC | 500 | 0,00 | 46 | 9,76 | ||||
| 2026-02-04 | 13F | Dogwood Wealth Management LLC | 77 | 7 | ||||||
| 2026-02-09 | 13F | Smithfield Trust Co | 43 | 0 | ||||||
| 2026-01-29 | 13F | RMG Wealth Management LLC | 1.400 | 0,00 | 170 | 49,12 | ||||
| 2026-04-10 | 13F | Abound Wealth Management | 10 | 1 | ||||||
| 2026-02-17 | 13F | Scopus Asset Management, L.p. | Put | 175.000 | 600,00 | 16.011 | 663,84 | |||
| 2026-02-17 | 13F | Susquehanna International Group, Llp | 448.890 | -0,37 | 41.069 | 8,69 | ||||
| 2026-02-17 | 13F | Susquehanna International Group, Llp | Put | 4.642.100 | 21,05 | 424.706 | 32,07 | |||
| 2026-02-13 | 13F | Smartleaf Asset Management LLC | 619 | 3,00 | 57 | 12,00 | ||||
| 2026-04-24 | 13F | National Asset Management, Inc. | 2.421 | -69,40 | 249 | -65,70 | ||||
| 2026-04-15 | 13F | Addenda Capital Inc. | 550.763 | 2,36 | 83.319 | 23,21 | ||||
| 2026-02-13 | 13F | Brasada Capital Management, Lp | 39.240 | 1,61 | 3.829 | 17,86 | ||||
| 2025-11-13 | 13F | Formula Growth Ltd | 0 | -100,00 | 0 | |||||
| 2026-04-20 | 13F | Contravisory Investment Management, Inc. | 3.082 | 335 | ||||||
| 2025-11-14 | 13F | Black Maple Capital Management LP | 0 | -100,00 | 0 | |||||
| 2026-01-29 | 13F | Beirne Wealth Consulting Services, LLC | 30.538 | 0,03 | 2.794 | 9,10 | ||||
| 2026-02-20 | 13F/A | Arrow Capital Pty Ltd | 62.500 | 38,89 | 5.718 | 0,26 | ||||
| 2026-04-13 | 13F | True Wealth Design, LLC | 24 | 14,29 | 3 | 100,00 | ||||
| 2026-04-13 | 13F | Trust Co | 7 | 0,00 | 1 | |||||
| 2026-02-12 | 13F | Mark Sheptoff Financial Planning, Llc | 5.695 | 3,64 | 521 | 13,26 | ||||
| 2026-02-12 | 13F | Commonwealth Equity Services, Llc | 101.355 | 6,90 | 9.273 | 132.357,14 | ||||
| 2026-04-16 | 13F | Stanley-Laman Group, Ltd. | 130.631 | -6,74 | 14.188 | 10,71 | ||||
| 2026-04-02 | 13F | Hilltop National Bank | 400 | 0,00 | 43 | 19,44 | ||||
| 2026-04-20 | 13F | Tower View Investment Management & Research LLC | 200 | 22 | ||||||
| 2026-04-21 | 13F | Wedbush Securities Inc | 3.482 | 2,93 | 0 | |||||
| 2026-02-06 | 13F | GPS Wealth Strategies Group, LLC | 0 | -100,00 | 0 | |||||
| 2026-02-17 | 13F | Advisor Group Holdings, Inc. | Call | 19 | 850,00 | 108 | 1.428,57 | |||
| 2026-02-27 | 13F | Strategic Investment Solutions, Inc. /IL | 100 | 9 | ||||||
| 2026-04-15 | 13F | City Holding Co | 58 | 0,00 | 6 | 20,00 | ||||
| 2026-02-17 | 13F | Interval Partners, LP | 6.192 | 567 | ||||||
| 2026-02-13 | 13F | Keystone Investors Pte Ltd | 157.879 | 5,51 | 14.444 | 15,11 | ||||
| 2026-02-11 | 13F | J.Safra Asset Management Corp | 740 | 68 | ||||||
| 2026-02-02 | 13F | Horizon Investments, LLC | 1.384 | 34.500,00 | 127 | |||||
| 2026-02-17 | 13F | Scopus Asset Management, L.p. | 354.594 | 4,45 | 32.442 | 13,95 | ||||
| 2026-04-10 | 13F | Naviter Wealth, LLC | 2.548 | 0,00 | 277 | 18,45 | ||||
| 2026-02-17 | 13F | Scopus Asset Management, L.p. | Call | 200.000 | 18.298 | |||||
| 2026-01-29 | 13F | IMC-Chicago, LLC | 20.571 | 1.882 | ||||||
| 2026-02-04 | 13F | Atlantic Union Bankshares Corp | 1.000 | 0,00 | 91 | 9,64 | ||||
| 2026-01-29 | 13F | IMC-Chicago, LLC | Put | 1.129.800 | 177,39 | 103.365 | 202,63 | |||
| 2026-01-29 | 13F | IMC-Chicago, LLC | Call | 545.600 | 27,66 | 49.917 | 39,27 | |||
| 2026-02-10 | 13F | Bowen Hanes & Co Inc | 573.975 | -0,09 | 53 | -99,89 | ||||
| 2026-02-06 | 13F | Mizuho Markets Cayman LP | 0 | -100,00 | 0 | |||||
| 2026-04-08 | 13F | Roberts Wealth Advisors, LLC | 39.987 | 2,46 | 4.343 | 21,62 | ||||
| 2026-02-12 | 13F | Sprott Inc. | 194.706 | 41,94 | 17.814 | 54,86 | ||||
| 2026-02-17 | 13F | Alpine Woods Capital Investors, Llc | 9.766 | 57,57 | 893 | 72,06 | ||||
| 2026-02-06 | 13F | Copia Wealth Management | 755 | 0,00 | 69 | 9,52 | ||||
| 2026-02-13 | 13F | Storgate, LLC | 3.920 | 359 | ||||||
| 2026-04-03 | 13F | Coastline Trust Co | 150 | 0,00 | 16 | 23,08 | ||||
| 2026-02-17 | 13F | SIG North Trading, ULC | Put | 239.700 | 0,97 | 21.930 | 10,16 | |||
| 2026-04-23 | 13F | Merrion Investment Management Co, LLC | 81.100 | -44,94 | 8.808 | -34,64 | ||||
| 2026-01-30 | 13F | Wealthfront Advisers Llc | 7.043 | 37,26 | 644 | 49,77 | ||||
| 2026-02-17 | 13F | SIG North Trading, ULC | Call | 495.000 | -40,54 | 45.288 | -35,13 | |||
| 2026-02-18 | 13F | Vident Advisory, LLC | 511.768 | 5,50 | 46.822 | 15,10 | ||||
| 2026-02-17 | 13F | Captrust Financial Advisors | 28.086 | 0,09 | 2.570 | 9,18 | ||||
| 2026-02-05 | 13F | Baader Bank INC | 38.355 | -10,17 | 3.498 | -1,27 | ||||
| 2026-02-13 | 13F | Walleye Trading LLC | 115.925 | 23,48 | 10.606 | 34,72 | ||||
| 2026-04-20 | 13F | Brian Low Financial Group, Llc | 7.763 | -43,04 | 843 | -32,40 | ||||
| 2026-02-17 | 13F | Investment Management Corp of Ontario | 110.328 | 51,16 | 10.094 | 64,92 | ||||
| 2026-02-13 | 13F | Citigroup Inc | 712.245 | -71,44 | 65.304 | -68,81 | ||||
| 2026-02-13 | 13F | Walleye Trading LLC | Put | 519.500 | 40,60 | 47.529 | 53,39 | |||
| 2026-02-13 | 13F | Walleye Trading LLC | Call | 171.600 | -29,18 | 15.700 | -22,74 | |||
| 2026-02-13 | 13F | Citigroup Inc | Call | 318.500 | 100,95 | 29.202 | 119,48 | |||
| 2026-02-13 | 13F | Citigroup Inc | Put | 359.000 | -67,06 | 32.916 | -64,03 | |||
| 2026-02-12 | 13F | BlackRock, Inc. | 4.538.400 | 16,04 | 415.218 | 26,60 | ||||
| 2026-02-13 | 13F | Recurrent Investment Advisors LLC | 6.757 | 0,00 | 618 | 9,19 | ||||
| 2026-02-17 | 13F | Nomura Holdings Inc | 0 | -100,00 | 0 | |||||
| 2026-04-22 | 13F | Pictet Asset Management Holding SA | 220.527 | 1,45 | 23.906 | 19,94 | ||||
| 2026-01-14 | 13F | ORG Partners LLC | 1.098 | 3,00 | 100 | 12,36 | ||||
| 2026-02-11 | 13F | Deltroit Asset Management (UK) LLP | 289.993 | 26.531 | ||||||
| 2026-02-13 | 13F | Aptus Capital Advisors, LLC | 4.716 | 1,55 | 431 | 10,80 | ||||
| 2026-04-16 | 13F | Birch Financial Group, Llc | 10.767 | 131,55 | 1.169 | 175,06 | ||||
| 2025-10-31 | 13F | Whittier Trust Co Of Nevada Inc | 0 | -100,00 | 0 | |||||
| 2026-02-06 | 13F | CloudAlpha Capital Management Limited/Hong Kong | 0 | -100,00 | 0 | |||||
| 2026-04-17 | 13F | Bell Investment Advisors, Inc | 56 | 0,00 | 6 | 20,00 | ||||
| 2026-02-03 | 13F | International Assets Investment Management, Llc | 3.655 | -7,19 | 334 | 18,44 | ||||
| 2026-02-06 | 13F | Harvest Portfolios Group Inc. | 226.668 | 62,14 | 20.755 | 76,91 | ||||
| 2026-02-12 | 13F | Azimuth Capital Investment Management LLC | 5.660 | 1,07 | 518 | 10,23 | ||||
| 2026-01-27 | 13F | First Horizon Corp | 500 | 681,25 | 46 | 800,00 | ||||
| 2026-02-13 | 13F | Allianz Se | 388 | 0,00 | 36 | 9,38 | ||||
| 2026-01-23 | 13F | Nbt Bank N A /ny | 2.717 | -11,41 | 249 | -3,50 | ||||
| 2025-11-04 | 13F | Pineridge Advisors LLC | 28 | 0,00 | 2 | 0,00 | ||||
| 2026-01-13 | 13F | Synergy Financial Management, LLC | 3.475 | 21,84 | 318 | 50,24 | ||||
| 2026-02-17 | 13F | Crawford Investment Counsel Inc | 29.299 | -35,40 | 2.681 | -29,53 | ||||
| 2025-11-14 | 13F | Sassicaia Capital Advisers Llc | 0 | -100,00 | 0 | |||||
| 2026-01-14 | 13F | Clarius Group, LLC | 2.547 | 0,00 | 233 | 9,39 | ||||
| 2026-01-27 | 13F | Zurcher Kantonalbank (Zurich Cantonalbank) | 135.058 | -10,84 | 12.383 | -2,62 | ||||
| 2026-02-11 | 13F | Deutsche Bank Ag\ | 957.260 | 16,61 | 87.580 | 27,22 | ||||
| 2026-01-29 | 13F | Calamos Wealth Management LLC | 29.706 | 35,29 | 2.718 | 47,58 | ||||
| 2026-02-17 | 13F | Align Financial, LLC | 18.664 | 19 | ||||||
| 2026-02-11 | 13F | Winton Capital Group Ltd | 138.272 | 80,51 | 12.651 | 96,95 | ||||
| 2026-02-13 | 13F | Ubs Asset Management Americas Inc | 990 | 91 | ||||||
| 2026-02-05 | 13F | Gabelli Funds Llc | 363.073 | -1,39 | 33.218 | 7,58 | ||||
| 2026-01-29 | 13F | Concurrent Investment Advisors, LLC | 11.619 | 1.063 | ||||||
| 2026-02-19 | 13F | Connective Capital Management, LLC | 45.029 | 0,00 | 4.120 | 9,08 | ||||
| 2026-02-11 | 13F | Capital Analysts, Inc. | 336 | 0,00 | 0 | |||||
| 2026-02-13 | 13F | Itau Unibanco Holding S.A. | 0 | -100,00 | 0 | |||||
| 2026-02-03 | 13F | Farmers & Merchants Investments Inc | 0 | -100,00 | 0 | |||||
| 2026-02-10 | 13F | Hazlett, Burt & Watson, Inc. | 130 | 0,00 | 0 | |||||
| 2026-01-30 | 13F | Yong Rong (HK) Asset Management Ltd | Call | 0 | -100,00 | 0 | ||||
| 2026-02-17 | 13F | Sig Brokerage, Lp | Call | 50.800 | 761,02 | 4.648 | 840,69 | |||
| 2026-02-17 | 13F | Sig Brokerage, Lp | Put | 74.500 | 6.816 | |||||
| 2026-01-16 | 13F | FNY Investment Advisers, LLC | 0 | -100,00 | 0 | |||||
| 2026-02-17 | 13F | Encompass Capital Advisors LLC | 375.000 | -46,43 | 34.309 | -41,56 | ||||
| 2026-01-22 | 13F | BOCHK Asset Management Ltd | 0 | -100,00 | 0 | |||||
| 2026-02-12 | 13F | BRYN MAWR TRUST Co | 0 | -100,00 | 0 | |||||
| 2026-02-13 | 13F | General American Investors Co Inc | 389.230 | -11,38 | 35.611 | -3,32 | ||||
| 2026-02-13 | 13F | General American Investors Co Inc | Put | 75.000 | 83,82 | 7.125 | 149,47 | |||
| 2026-04-21 | 13F | Gilpin Wealth Management, Llc | 1.150 | -4,17 | 125 | 13,76 | ||||
| 2026-02-04 | 13F | Legacy Financial Advisors, Inc. | 0 | -100,00 | 0 | -100,00 | ||||
| 2026-02-11 | 13F | United Financial Planning Group LLC | 83 | 8 | ||||||
| 2026-01-21 | 13F | Prime Capital Investment Advisors, LLC | 2.387 | -0,46 | 218 | 8,46 | ||||
| 2026-01-30 | 13F | Sage Rhino Capital Llc | 11.552 | -37,34 | 1.057 | -31,65 | ||||
| 2026-04-16 | 13F | Capital Advisors, Ltd. LLC | 485 | -34,01 | 0 | |||||
| 2026-02-10 | 13F | Allen Investment Management LLC | 32.713 | 68,28 | 2.996 | 83,63 | ||||
| 2026-02-13 | 13F | Natixis | 11.052 | 1,08 | 1.011 | 10,37 | ||||
| 2026-02-09 | 13F | Cypress Capital Management LLC (WY) | 26.330 | 2,39 | 2.409 | 11,69 | ||||
| 2026-04-24 | 13F | Key FInancial Inc | 16 | 0,00 | 2 | 0,00 | ||||
| 2026-02-13 | 13F | National Bank Of Canada /fi/ | 3.070.899 | -20,34 | 278.563 | -13,24 | ||||
| 2026-04-20 | 13F | Godsey & Gibb Associates | 140 | 0,00 | 15 | 25,00 | ||||
| 2026-02-17 | 13F | Two Sigma Securities, Llc | 4.393 | 56,06 | 402 | 69,92 | ||||
| 2026-02-17 | 13F/A | Intesa Sanpaolo S.p.a. | 74.760 | 6.833 | ||||||
| 2026-02-13 | 13F | Heritage Wealth Advisors | 54 | 0,00 | 5 | 0,00 | ||||
| 2026-02-12 | 13F | Colonial Trust Advisors | 57.098 | -3,80 | 5.224 | 4,94 | ||||
| 2026-02-12 | 13F | Davy Global Fund Management Ltd | 38.518 | 15,67 | 3.524 | 26,22 | ||||
| 2026-01-15 | 13F | Private Advisory Group LLC | 9.556 | -10,89 | 874 | -2,78 | ||||
| 2026-02-11 | 13F | Modus Advisors, LLC | 170 | 16 | ||||||
| 2026-02-17 | 13F | Northern Trust Corp | 439.833 | 0,31 | 40.240 | 9,44 | ||||
| 2026-04-17 | 13F | AdvisorNet Financial, Inc | 982 | -6,57 | 107 | 10,42 | ||||
| 2026-04-14 | 13F | Tradewinds Capital Management, LLC | 21 | 0,00 | 2 | 100,00 | ||||
| 2026-02-06 | 13F | Lsv Asset Management | 600 | 0,00 | 0 | |||||
| 2026-02-17 | 13F | Arosa Capital Management LP | Call | 325.000 | -60,61 | 29.734 | -57,02 | |||
| 2026-01-20 | 13F/A | Miller Wealth Advisors, Llc | 100 | 9 | ||||||
| 2026-02-17 | 13F | Arosa Capital Management LP | 50.025 | 31,64 | 4.577 | 43,63 | ||||
| 2026-01-26 | 13F | Cm Wealth Advisors Llc | 10.000 | 915 | ||||||
| 2026-02-13 | 13F | Caxton Associates Llp | 525.000 | -6,67 | 48.032 | 1,83 | ||||
| 2026-02-19 | 13F | Invesco Ltd. | 983.816 | -36,98 | 90.009 | -31,25 | ||||
| 2026-01-27 | 13F | TD Waterhouse Canada Inc. | 616.542 | -13,86 | 56.378 | -5,54 | ||||
| 2026-02-10 | 13F | Nomura Asset Management Co Ltd | 0 | 0 | ||||||
| 2026-02-17 | 13F | Wellington Management Group Llp | 806.080 | -29,51 | 73.771 | -23,09 | ||||
| 2026-02-17 | 13F | Cetera Investment Advisers | Put | 2.200 | 5 | |||||
| 2026-01-27 | 13F | Autumn Glory Partners, LLC | 3.590 | -12,22 | 328 | -4,09 | ||||
| 2026-02-17 | 13F | Nomura Holdings Inc | Put | 90.000 | 8.234 | |||||
| 2026-02-17 | 13F | Cetera Investment Advisers | 157.919 | -13,71 | 14.448 | -5,86 | ||||
| 2026-02-12 | 13F | Federated Hermes, Inc. | 30.533 | -52,42 | 2.793 | -48,10 | ||||
| 2026-01-26 | 13F | Shelton Wealth Management, Llc | Call | 2.000 | 183 | |||||
| 2026-01-26 | 13F | Shelton Wealth Management, Llc | 25.906 | 5,33 | 2.370 | 14,94 | ||||
| 2026-02-17 | 13F | Nomura Holdings Inc | Call | 140.900 | 78,81 | 12.891 | 95,07 | |||
| 2026-02-13 | 13F | Ubs Oconnor Llc | 0 | -100,00 | 0 | |||||
| 2026-04-22 | 13F | Gerber, Llc | 2.170 | 236 | ||||||
| 2026-02-03 | 13F | Sequoia Financial Advisors, LLC | 96.151 | 6,88 | 8.797 | 16,60 | ||||
| 2026-04-10 | 13F | Viking Fund Management Llc | 8.000 | -52,94 | 869 | -44,18 | ||||
| 2026-02-11 | 13F | Myriad Asset Management Advisors LLC | 36.434 | 3.333 | ||||||
| 2026-04-10 | 13F | Intellectus Partners, LLC | 82.350 | -3,80 | 8.944 | 14,20 | ||||
| 2026-04-14 | 13F | Thurston, Springer, Miller, Herd & Titak, Inc. | 50 | -15,25 | 5 | 0,00 | ||||
| 2026-01-28 | 13F | WPG Advisers, LLC | 133 | 0,00 | 12 | 9,09 | ||||
| 2025-11-13 | 13F | VSM Wealth Advisory, LLC | 0 | -100,00 | 0 | |||||
| 2026-02-05 | 13F | Accredited Investors Inc. | 0 | -100,00 | 0 | |||||
| 2026-02-13 | 13F | Gen-Wealth Partners Inc | 30 | 0,00 | 3 | 0,00 | ||||
| 2026-02-03 | 13F | SBI Securities Co., Ltd. | 11.998 | 15,78 | 1.098 | 26,24 | ||||
| 2026-02-11 | 13F | Cerity Partners LLC | 23.507 | 16,04 | 2.151 | 26,62 | ||||
| 2026-02-13 | 13F | Clarity Asset Management, Inc. | 0 | -100,00 | 0 | |||||
| 2026-01-29 | 13F | Concord Wealth Partners | 1.079 | 44,44 | 99 | 58,06 | ||||
| 2026-02-13 | 13F | Acasta Partners UK LLP | 16.015 | 1.466 | ||||||
| 2026-02-12 | 13F | Portland Investment Counsel Inc. | 30.000 | 25,00 | 2.747 | 36,40 | ||||
| 2026-01-21 | 13F | Drummond Knight Asset Management Pty Ltd | 0 | -100,00 | 0 | |||||
| 2026-02-12 | 13F | Counterpoint Mutual Funds LLC | 5.496 | 503 | ||||||
| 2026-04-24 | 13F | USS Investment Management Ltd | 92.989 | 0,00 | 10.124 | 18,90 | ||||
| 2026-02-13 | 13F | Cloverfields Capital Group, Lp | 2.292 | 210 | ||||||
| 2026-02-13 | 13F | Marshall Wace, Llp | 1.752.571 | 160.343 | ||||||
| 2026-02-05 | 13F | Pacific Heights Asset Management Llc | 500.000 | 0,00 | 45.745 | 9,10 | ||||
| 2026-02-12 | 13F | Wealthspire Advisors, LLC | 3.914 | 49,39 | 358 | 63,47 | ||||
| 2026-02-17 | 13F | Concentric Capital Strategies, LP | 33.332 | -71,13 | 3.050 | -68,51 | ||||
| 2026-02-05 | 13F | Phoenix Holdings Ltd. | 0 | -100,00 | 0 | |||||
| 2025-11-14 | 13F | Spahn Wealth & Retirement LLC | 0 | -100,00 | 0 | |||||
| 2025-11-10 | 13F | IFS Group,LLC | 4.580 | 382 | ||||||
| 2026-01-20 | 13F | Wall Street Access Asset Management, LLC | 17.796 | 0,00 | 1.628 | 9,12 | ||||
| 2026-02-13 | 13F | SRS Capital Advisors, Inc. | 4.855 | -5,38 | 444 | 3,26 | ||||
| 2026-02-11 | 13F | Simplex Trading, Llc | Put | 240.200 | -43,98 | 21.976 | 62.685,71 | |||
| 2026-04-14 | 13F | Prospera Financial Services Inc | 40.487 | 0,94 | 4.397 | 19,84 | ||||
| 2026-02-03 | 13F | Canal Insurance CO | 0 | -100,00 | 0 | |||||
| 2026-02-11 | 13F | Simplex Trading, Llc | 48.092 | 353,61 | 4.400 | |||||
| 2026-02-04 | 13F | Madison Asset Management, LLC | 39.851 | -32,03 | 3.646 | -25,85 | ||||
| 2026-02-12 | 13F | Scotia Capital Inc. | 979.158 | 3,68 | 89.528 | 13,04 | ||||
| 2026-02-11 | 13F | Simplex Trading, Llc | Call | 384.100 | -19,32 | 35.141 | 90.005,13 | |||
| 2026-02-17 | 13F | Family Management Corp | 3.389 | 310 | ||||||
| 2026-02-05 | 13F/A | Fulcrum Asset Management LLP | 9.379 | -16,98 | 859 | -9,40 | ||||
| 2026-02-13 | 13F | Hurley Capital, LLC | 500 | 0,00 | 46 | 9,76 | ||||
| 2026-04-13 | 13F | Creative Financial Designs Inc /adv | 988 | 0,00 | 107 | 18,89 | ||||
| 2026-04-15 | 13F | Seacrest Wealth Management, Llc | 6.169 | 16,13 | 670 | 21,38 | ||||
| 2026-04-06 | 13F | CX Institutional | 26 | 333,33 | 0 | |||||
| 2026-04-23 | 13F | Harbor Investment Advisory, Llc | 28.980 | -4,76 | 3.148 | 13,08 | ||||
| 2026-02-17 | 13F | Advisor Group Holdings, Inc. | 108.562 | -8,01 | 9.935 | 4,02 | ||||
| 2026-02-17 | 13F | Holocene Advisors, LP | 767.372 | 1.437,11 | 70.207 | 1.577,16 | ||||
| 2026-02-05 | 13F | Stephens Inc /ar/ | 7.423 | -13,51 | 679 | -5,56 | ||||
| 2026-02-04 | 13F | Wsfs Capital Management, Llc | 2.954 | 0,72 | 270 | 10,20 | ||||
| 2026-04-07 | 13F | Anderson Hoagland & Co | 61.161 | 0,87 | 6.643 | 19,74 | ||||
| 2026-04-08 | 13F | Ausbil Investment Management Ltd | 700 | -94,17 | 78 | -93,00 | ||||
| 2026-02-13 | 13F | BRITISH COLUMBIA INVESTMENT MANAGEMENT Corp | 306.200 | -67,76 | 28.038 | -64,81 | ||||
| 2026-04-21 | 13F | GHP Investment Advisors, Inc. | 51 | 0,00 | 6 | 25,00 | ||||
| 2026-04-01 | 13F | Vigilare Wealth Management | 10.874 | 6,32 | 1.181 | 26,31 | ||||
| 2026-02-03 | 13F | We Are One Seven, LLC | 4.049 | 3,48 | 370 | 12,80 | ||||
| 2025-11-24 | 13F/A | Fulcrum Asset Management LLP | Put | 0 | -100,00 | 0 | -100,00 | |||
| 2026-04-14 | 13F | Westend Capital Management LLC | 228.075 | 0,78 | 24.771 | 19,64 | ||||
| 2026-02-17 | 13F | Two Sigma Investments, Lp | 246.651 | 1,88 | 22.566 | 11,15 | ||||
| 2026-02-09 | 13F | Main Street Research LLC | 381.868 | 4,80 | 34.937 | 14,33 | ||||
| 2026-02-17 | 13F | Sagefield Capital LP | 252.828 | 28,28 | 23.131 | 39,96 | ||||
| 2026-02-23 | 13F | Beaird Harris Wealth Management, LLC | 0 | -100,00 | 0 | |||||
| 2025-11-26 | 13F/A | Jpmorgan Chase & Co | Put | 0 | -100,00 | 0 | -100,00 | |||
| 2026-02-17 | 13F | Two Sigma Investments, Lp | Put | 3.000 | 274 | |||||
| 2026-02-17 | 13F | Two Sigma Investments, Lp | Call | 3.000 | 274 | |||||
| 2025-10-27 | 13F | Pacific Capital Partners Ltd | 0 | -100,00 | 0 | |||||
| 2026-02-13 | 13F | Bridgewater Associates, LP | 0 | -100,00 | 0 | |||||
| 2026-02-13 | 13F | Evelyn Partners Investment Management Services Ltd | 800 | 0,00 | 73 | 8,96 | ||||
| 2025-11-14 | 13F | Strategic Wealth Partners, Ltd. | 115.484 | -24,43 | 9.676 | -14,70 | ||||
| 2026-01-15 | 13F | Frank, Rimerman Advisors LLC | 17.342 | 0,40 | 1.587 | 9,53 | ||||
| 2026-02-11 | 13F | Nikko Asset Management Americas, Inc. | 379.751 | 34.743 | ||||||
| 2026-02-17 | 13F | Lombard Odier Asset Management (USA) Corp | 8.285 | -67,51 | 758 | -64,59 | ||||
| 2026-02-27 | 13F | Groupama Asset Managment | 1.928 | 5,93 | 242 | 14,15 | ||||
| 2026-04-22 | 13F | Gold Investment Management Ltd. | 4.142 | 0,00 | 450 | 18,47 | ||||
| 2026-04-24 | 13F | Root Financial Partners, LLC | 32 | 14,29 | 3 | 50,00 | ||||
| 2026-02-18 | 13F | Beacon Pointe Advisors, LLC | 22.610 | 18,18 | 2.069 | 28,93 | ||||
| 2025-11-14 | 13F | Squarepoint Ops LLC | 0 | -100,00 | 0 | -100,00 | ||||
| 2026-02-02 | 13F | Danske Bank A/s | 7.816 | 132,07 | 717 | 156,63 | ||||
| 2026-02-11 | 13F | Harvest Fund Management Co., Ltd | 5.123 | -1,71 | 0 | |||||
| 2026-04-06 | 13F | GAMMA Investing LLC | 681 | 0,74 | 74 | 19,67 | ||||
| 2026-02-10 | 13F | Robertson Opportunity Capital, LLC | 117.600 | -2,08 | 10.759 | 6,83 | ||||
| 2025-11-14 | 13F | Resolute Capital Asset Partners LLC | 0 | -100,00 | 0 | -100,00 | ||||
| 2025-11-14 | 13F | Delta Global Management LP | 0 | -100,00 | 0 | |||||
| 2026-02-13 | 13F | Commerce Bank | 6.364 | 89,35 | 582 | 107,12 | ||||
| 2026-04-23 | 13F | Lansforsakringar Fondforvaltning AB (publ) | 101.121 | 1,19 | 10.962 | 19,64 | ||||
| 2026-01-15 | 13F | J. Safra Sarasin Holding AG | 3.300 | 0,00 | 302 | 9,06 | ||||
| 2026-02-17 | 13F | Scientech Research LLC | 4.205 | -48,97 | 385 | -44,43 | ||||
| 2026-04-07 | 13F | Dwr Wealth Management, Llc | 4.250 | 0,00 | 437 | 12,63 | ||||
| 2026-04-15 | 13F | McAlvany Wealth Management LLC | 9.082 | 2,38 | 934 | 15,04 | ||||
| 2026-02-13 | 13F | FirstWave Capital Management LLC | 9.816 | 898 | ||||||
| 2026-02-13 | 13F | Ieq Capital, Llc | 14.782 | 35,58 | 1.352 | 47,92 | ||||
| 2026-01-16 | 13F | Empirical Financial Services, LLC d.b.a. Empirical Wealth Management | 6.721 | -19,70 | 615 | -12,41 | ||||
| 2026-02-09 | 13F | HBK Sorce Advisory LLC | 7.675 | -0,63 | 872 | 20,94 | ||||
| 2026-04-15 | 13F | Parsons Capital Management Inc/ri | 36.220 | 8,63 | 3.934 | 28,95 | ||||
| 2026-02-11 | 13F | O'shaughnessy Asset Management, Llc | 18.004 | 12,54 | 1.647 | 22,82 | ||||
| 2026-02-04 | 13F | Knuff & Co LLC | 750 | 69 | ||||||
| 2026-02-12 | 13F | Tocqueville Asset Management L.p. | 845.634 | -0,21 | 77.367 | 8,87 | ||||
| 2026-02-17 | 13F | Moore Capital Management, Lp | Call | 0 | -100,00 | 0 | ||||
| 2026-01-29 | 13F | D.a. Davidson & Co. | Call | 1 | 0,00 | 4 | 0,00 | |||
| 2026-02-05 | 13F | Blume Capital Management, Inc. | 13.361 | 0,00 | 1.222 | 9,11 | ||||
| 2026-04-08 | 13F | Clarus Wealth Advisors | 2.133 | 235 | ||||||
| 2026-01-23 | 13F | Diversify Advisory Services, LLC | 8.200 | 42,04 | 955 | 63,92 | ||||
| 2026-02-13 | 13F | Vontobel Holding Ltd. | 28.948 | 2,12 | 2.651 | 11,44 | ||||
| 2026-04-22 | 13F | Princeton Global Asset Management LLC | 1.980 | 0,00 | 215 | 18,78 | ||||
| 2026-02-13 | 13F | Vontobel Holding Ltd. | Put | 10.000 | 0,00 | 916 | 9,06 | |||
| 2026-04-22 | 13F | Stone House Investment Management, LLC | 362 | 1,40 | 39 | 21,88 | ||||
| 2026-04-22 | 13F | Atlantic Edge Private Wealth Management, LLC | 25 | 0,00 | 3 | 0,00 | ||||
| 2026-02-11 | 13F | Primecap Management Co/ca/ | 933.670 | -9,92 | 85.421 | -1,72 | ||||
| 2026-01-08 | 13F | M. Kulyk & Associates, LLC | 106.983 | 2,22 | 9.788 | 11,52 | ||||
| 2026-02-10 | 13F | PCJ Investment Counsel Ltd. | 22.490 | 7,66 | 2.059 | 17,52 | ||||
| 2026-02-12 | 13F | Burkett Asset Management Ltd | 4.860 | 446 | ||||||
| 2026-02-17 | 13F | Worldquant Millennium Advisors Llc | 14.368 | 1.316 | ||||||
| 2026-04-22 | 13F | Gunderson Capital Management Inc. | 95.660 | 49,51 | 10.390 | 77,50 | ||||
| 2026-01-21 | 13F | Country Trust Bank | 0 | -100,00 | 0 | |||||
| 2026-01-28 | 13F | U S Global Investors Inc | 5.000 | 100,00 | 457 | 118,66 | ||||
| 2026-02-10 | 13F | Gulf International Bank (UK) Ltd | 21.358 | 0,95 | 2 | -50,00 | ||||
| 2025-11-14 | 13F | Voloridge Investment Management, Llc | 0 | -100,00 | 0 | -100,00 | ||||
| 2026-02-17 | 13F | Sona Asset Management (us) Llc | 0 | -100,00 | 0 | |||||
| 2026-04-24 | 13F | Private Advisor Group, LLC | 43.578 | -0,26 | 4.733 | 18,39 | ||||
| 2026-01-26 | 13F | PFG Investments, LLC | 5.269 | 34,00 | 482 | 46,50 | ||||
| 2026-02-04 | 13F | Swiss Life Asset Management Ltd | 78.410 | 14,14 | 7.180 | 24,35 | ||||
| 2026-02-11 | 13F | MCF Advisors LLC | 23 | 2 | ||||||
| 2026-02-13 | 13F | Korea Investment CORP | 1.141.868 | 1,38 | 104.694 | 10,73 | ||||
| 2026-02-17 | 13F | Cinctive Capital Management LP | 0 | -100,00 | 0 | |||||
| 2026-02-12 | 13F | Steward Partners Investment Advisory, Llc | 24.830 | -16,00 | 2.272 | -8,35 | ||||
| 2026-02-10 | 13F | Eurizon Capital SGR S.p.A. | 270.337 | 24.733 | ||||||
| 2026-04-21 | 13F | Vise Technologies, Inc. | 8.614 | 0,00 | 788 | 0,00 | ||||
| 2026-04-13 | 13F | IFP Advisors, Inc | 4.978 | -36,71 | 541 | -24,90 | ||||
| 2026-02-17 | 13F | Lazard Asset Management Llc | 8.505 | -88,40 | 779 | -87,35 | ||||
| 2025-11-21 | 13F/A | CIBC Bancorp USA Inc. | 27.000 | 2.264 | ||||||
| 2026-01-23 | 13F | Assetmark, Inc | 2.626 | -6,28 | 240 | 2,56 | ||||
| 2026-02-17 | 13F | Alphadyne Asset Management, LLC | Call | 39.500 | 3.614 | |||||
| 2026-02-06 | 13F | Addison Advisors LLC | 37 | 3 | ||||||
| 2026-02-17 | 13F | Alphadyne Asset Management, LLC | Put | 27.300 | 810,00 | 2.498 | 894,82 | |||
| 2026-01-23 | 13F | FSM Wealth Advisors, LLC | 0 | -100,00 | 0 | |||||
| 2026-04-10 | 13F | Eagle Wealth Strategies Llc | 4.955 | -44,98 | 538 | -34,63 | ||||
| 2026-04-15 | 13F | Nations Financial Group Inc, /ia/ /adv | 4.281 | -82,02 | 465 | -78,65 | ||||
| 2026-02-05 | 13F | Allworth Financial LP | 4.639 | 3,46 | 424 | 12,77 | ||||
| 2026-01-23 | 13F | HBW Advisory Services LLC | 4.068 | -0,15 | 372 | 9,09 | ||||
| 2026-02-17 | 13F | Brevan Howard Capital Management LP | 96.225 | 155,35 | 8.877 | 183,43 | ||||
| 2026-04-24 | 13F | Fulton Bank, N.a. | 2.640 | 0,00 | 287 | 18,67 | ||||
| 2026-02-17 | 13F | Brevan Howard Capital Management LP | Call | 61.400 | -30,62 | 5.664 | -23,01 | |||
| 2026-01-28 | 13F | Kingswood Wealth Advisors, Llc | 2.334 | 214 | ||||||
| 2026-02-13 | 13F | Great West Life Assurance Co /can/ | 462.877 | -31,28 | 42 | -25,00 | ||||
| 2026-02-23 | 13F | Copos Capital S.a r.l. | 381 | 35 | ||||||
| 2026-02-13 | 13F | Ingalls & Snyder Llc | 12.930 | 0,02 | 1 | 0,00 | ||||
| 2026-04-09 | 13F | Silvia Mccoll Wealth Management, Llc | 5.610 | 0,00 | 609 | 18,71 | ||||
| 2026-04-17 | 13F | Roxbury Financial LLC | 34 | 0,00 | 4 | 0,00 | ||||
| 2026-04-22 | 13F | Janney Montgomery Scott LLC | 79.450 | -5,54 | 9 | 14,29 | ||||
| 2026-02-02 | 13F | Intact Investment Management Inc. | 169.740 | -0,88 | 15.542 | 8,13 | ||||
| 2026-04-17 | 13F | First City Capital Management, Inc. | 5.350 | -15,75 | 581 | 0,17 | ||||
| 2026-02-09 | 13F | Coldstream Capital Management Inc | 4.529 | -29,31 | 414 | -22,91 | ||||
| 2026-02-04 | 13F | Ameritas Advisory Services, LLC | 0 | -100,00 | 0 | -100,00 | ||||
| 2026-02-02 | 13F | Allegheny Financial Group LTD | 0 | -100,00 | 0 | |||||
| 2026-02-13 | 13F | OpenArc Corporate Advisory, LLC | 29.678 | 2.715 | ||||||
| 2026-01-16 | 13F | Beaumont Financial Advisors, LLC | 3.848 | -0,72 | 352 | 8,31 | ||||
| 2026-04-23 | 13F | Chicago Capital, LLC | 87.183 | -0,78 | 9.469 | 17,79 | ||||
| 2026-04-06 | 13F | Versant Capital Management, Inc | 2.122 | 20,77 | 230 | 43,75 | ||||
| 2026-02-06 | 13F | Cullen/frost Bankers, Inc. | 1.021 | 132,05 | 93 | 158,33 | ||||
| 2026-02-18 | 13F | Wahed Invest LLC | 8.946 | 6,88 | 820 | 16,81 | ||||
| 2026-04-20 | 13F | Kestra Private Wealth Services, Llc | 6.864 | 7,15 | 746 | 27,13 | ||||
| 2026-01-30 | 13F | Sigma Planning Corp | 3.684 | 1,77 | 337 | 11,22 | ||||
| 2026-04-01 | 13F | Confluence Investment Management Llc | 9.022 | 1,27 | 980 | 20,12 | ||||
| 2026-02-17 | 13F | Parallax Volatility Advisers, L.P. | Put | 325.900 | -56,29 | 29.817 | -52,31 | |||
| 2025-11-12 | 13F | SPX Equities Gestao de Recursos Ltda | 0 | -100,00 | 0 | -100,00 | ||||
| 2026-04-20 | 13F | Jfs Wealth Advisors, Llc | 512 | 0,00 | 56 | 19,57 | ||||
| 2025-11-07 | 13F | Sierra Ocean, Llc | 0 | -100,00 | 0 | |||||
| 2026-02-13 | 13F | SIR Capital Management, L.P. | 22.600 | -74,69 | 2.068 | -72,40 | ||||
| 2026-02-02 | 13F | Qrg Capital Management, Inc. | 3.280 | 18,41 | 300 | 29,31 | ||||
| 2026-02-13 | 13F | Victory Capital Management Inc | 1.417.962 | -43,04 | 129.874 | -37,71 | ||||
| 2026-02-12 | 13F | Hrt Financial Lp | 0 | -100,00 | 0 | -100,00 | ||||
| 2026-04-16 | 13F | Capstone Wealth Management Group LLC | 2.225 | 0,00 | 242 | 18,72 | ||||
| 2026-02-13 | 13F | JustInvest LLC | 35.974 | 9,29 | 3.291 | 19,24 | ||||
| 2026-04-21 | 13F | E&G Advisors, LP | 7.124 | -1,93 | 774 | 16,42 | ||||
| 2026-02-09 | 13F | Integrity Advisory Solutions, LLC | 0 | -100,00 | 0 | |||||
| 2026-01-30 | 13F | Us Bancorp \de\ | 28.702 | -2,31 | 2.626 | 6,58 | ||||
| 2026-02-03 | 13F | NewEdge Wealth, LLC | 11.616 | -6,65 | 1.063 | -10,38 | ||||
| 2026-02-11 | 13F | Marvin & Palmer Associates Inc | 37.673 | -0,59 | 3.447 | -11,03 | ||||
| 2026-01-15 | 13F | Nisa Investment Advisors, Llc | 277 | 25 | ||||||
| 2026-02-11 | 13F | Westerkirk Capital Inc. | 1.220 | -93,34 | 112 | -92,77 | ||||
| 2026-02-17 | 13F | Parallax Volatility Advisers, L.P. | Call | 362.500 | -13,40 | 33.165 | -5,52 | |||
| 2026-02-17 | 13F | ArrowMark Colorado Holdings LLC | 125.789 | -15,46 | 11.508 | -7,77 | ||||
| 2025-11-14 | 13F | Volterra Technologies LP | Call | 0 | -100,00 | 0 | ||||
| 2026-02-17 | 13F | Tudor Investment Corp Et Al | Put | 172.400 | 15.773 | |||||
| 2026-02-17 | 13F | Tudor Investment Corp Et Al | Call | 62.100 | 5.682 | |||||
| 2026-02-13 | 13F | Caitong International Asset Management Co., Ltd | 308 | 30.700,00 | 28 | |||||
| 2026-01-21 | 13F | Y.D. More Investments Ltd | 0 | -100,00 | 0 | |||||
| 2026-02-10 | 13F | Goldman Sachs Group Inc | 3.224.945 | 48,45 | 295.050 | 61,96 | ||||
| 2026-02-17 | 13F | Tudor Investment Corp Et Al | 116.388 | 10.648 | ||||||
| 2026-04-20 | 13F | Segment Wealth Management, LLC | 5.980 | 0,00 | 649 | 18,65 | ||||
| 2026-02-10 | 13F | Goldman Sachs Group Inc | Put | 104.600 | 4,60 | 9.570 | 14,11 | |||
| 2026-02-12 | 13F | Groupe la Francaise | 2.565 | -61,20 | 235 | -46,95 | ||||
| 2026-02-17 | 13F | O'Domhnaill Enterprises, Inc. | 35.371 | 3.236 | ||||||
| 2026-02-11 | 13F | Spark Investment Management LLC | 0 | -100,00 | 0 | -100,00 | ||||
| 2026-02-05 | 13F | Td Private Client Wealth Llc | 562 | -49,32 | 51 | -45,16 | ||||
| 2026-02-12 | 13F | Stamos Capital Partners, L.p. | 30.007 | -16,87 | 2.745 | -9,32 | ||||
| 2026-04-07 | 13F | GK Wealth Management LLC | 4.250 | 437 | ||||||
| 2026-04-23 | 13F | Forum Financial Management, LP | 0 | -100,00 | 0 | |||||
| 2026-02-13 | 13F | Entropy Technologies, LP | 0 | -100,00 | 0 | |||||
| 2026-02-17 | 13F | Mercer Global Advisors Inc /adv | 11.208 | 9,14 | 1.025 | 19,05 | ||||
| 2026-04-20 | 13F | Hixon Zuercher, LLC | 4.000 | 0,00 | 434 | 18,90 | ||||
| 2026-01-29 | 13F | Vanguard Group Inc | 18.059.335 | 1,45 | 1.653.639 | 10,69 | ||||
| 2026-01-30 | 13F | Pure Portfolios Holdings Llc | 3.656 | -2,12 | 334 | 6,71 | ||||
| 2026-04-21 | 13F | PharVision Advisers, LLC | 0 | -100,00 | 0 | |||||
| 2026-02-02 | 13F | Artemis Investment Management LLP | 0 | -100,00 | 0 | |||||
| 2025-11-10 | 13F | Tableaux Llc | 0 | -100,00 | 0 | -100,00 | ||||
| 2026-02-12 | 13F | Summit Financial, LLC | 128.613 | 5,96 | 11.767 | 15,59 | ||||
| 2026-04-15 | 13F | Merit Financial Group, LLC | 7.344 | 14,79 | 798 | 36,24 | ||||
| 2026-01-22 | 13F | Accordant Advisory Group Inc | 109 | 10 | ||||||
| 2025-11-12 | 13F | HAP Trading, LLC | Call | 11.500 | 215 | |||||
| 2025-11-12 | 13F | HAP Trading, LLC | Put | 10.400 | 14 | |||||
| 2026-02-12 | 13F | Ci Investments Inc. | 40.405 | 3.697 | ||||||
| 2026-04-27 | 13F | Leonteq Securities AG | 18.741 | 14,57 | 2.136 | 42,12 | ||||
| 2026-02-17 | 13F | Millennium Management Llc | Call | 90.900 | -16,07 | 8.316 | -8,43 | |||
| 2026-02-17 | 13F | Mbb Public Markets I Llc | 0 | -100,00 | 0 | |||||
| 2026-02-18 | 13F | Mackenzie Financial Corp | 1.278.002 | 42,77 | 116.542 | 55,16 | ||||
| 2026-02-17 | 13F | Millennium Management Llc | Put | 67.700 | 77,23 | 6.194 | 93,35 | |||
| 2025-11-13 | 13F | MetLife Investment Management, LLC | 0 | -100,00 | 0 | -100,00 | ||||
| 2026-02-17 | 13F | Millennium Management Llc | 242.945 | -77,23 | 22.227 | -75,15 | ||||
| 2026-02-13 | 13F | Colony Group, LLC | 266.255 | 4,10 | 22.486 | 5,00 | ||||
| 2026-02-17 | 13F | Caisse De Depot Et Placement Du Quebec | 714.256 | -6,49 | 65.488 | 2,13 | ||||
| 2026-02-17 | 13F | Mpwm Advisory Solutions, Llc | 0 | -100,00 | 0 | |||||
| 2026-02-17 | 13F | Royal Bank Of Canada | Call | 542.500 | -19,16 | 49.633 | -11,81 | |||
| 2026-02-05 | 13F | Gamco Investors, Inc. Et Al | 12.590 | -3,94 | 1.152 | 4,73 | ||||
| 2026-02-17 | 13F | Royal Bank Of Canada | 9.169.196 | -7,78 | 838.891 | 0,61 | ||||
| 2026-02-17 | 13F | Gotham Asset Management, LLC | 19.019 | -22,01 | 1.740 | -14,91 | ||||
| 2026-04-23 | 13F | J.w. Cole Advisors, Inc. | 25.375 | -18,00 | 2.756 | 104,83 | ||||
| 2026-02-17 | 13F | SailingStone Capital Partners LLC | 100.025 | -38,57 | 12.571 | -33,90 | ||||
| 2026-04-23 | 13F | Klein Pavlis & Peasley Financial, Inc. | 68.421 | -14,12 | 7.431 | 1,95 | ||||
| 2026-02-09 | 13F | MRP Capital Investments, LLC | 300 | 0,00 | 27 | 22,73 | ||||
| 2026-02-17 | 13F | Aqr Capital Management Llc | 85.555 | 375,99 | 7.831 | 419,64 | ||||
| 2026-04-27 | 13F | Jamison Private Wealth Management, Inc. | 15.042 | 0,09 | 1.634 | 18,85 | ||||
| 2026-02-11 | 13F | Horizon Kinetics Asset Management Llc | 674.096 | -0,29 | 61.673 | 8,79 | ||||
| 2026-02-17 | 13F | Royal Bank Of Canada | Put | 1.805.400 | 434,30 | 165.176 | 482,92 | |||
| 2026-01-30 | 13F | American Capital Advisory, LLC | 1.000 | 0,00 | 91 | 9,64 | ||||
| 2026-02-11 | 13F | Twin Tree Management, LP | Put | 234.600 | 98,48 | 21.464 | 116,54 | |||
| 2026-02-11 | 13F | Twin Tree Management, LP | 99.627 | 79,89 | 9.115 | 96,25 | ||||
| 2026-02-17 | 13F | Caledonia (Private) Investments Pty Ltd | 5.431.296 | -1,64 | 496.909 | 7,31 | ||||
| 2026-02-12 | 13F | Federation des caisses Desjardins du Quebec | 966.098 | -44,26 | 88.394 | -39,22 | ||||
| 2026-04-10 | 13F | Novem Group | Call | 0 | -100,00 | 0 | -100,00 | |||
| 2026-04-09 | 13F | Park Place Capital Corp | 2.429 | 0,00 | 264 | 18,47 | ||||
| 2026-02-11 | 13F | Twin Tree Management, LP | Call | 105.800 | 185,95 | 9.680 | 212,02 | |||
| 2026-02-10 | 13F | BW Gestao de Investimentos Ltda. | 232.949 | 72,55 | 21.313 | 88,25 | ||||
| 2026-02-23 | 13F | Virtu Financial LLC | 0 | -100,00 | 0 | |||||
| 2026-04-15 | 13F | Exchange Traded Concepts, Llc | 690.909 | -4,48 | 75.040 | 13,40 | ||||
| 2026-02-13 | 13F | Boston Partners | 2.627 | -7,07 | 240 | 9,09 | ||||
| 2026-02-13 | 13F | Avos Capital Management, LLC | 16.796 | -28,75 | 1.537 | -22,27 | ||||
| 2026-02-13 | 13F | Panagora Asset Management Inc | 16.082 | 1.471 | ||||||
| 2026-02-09 | 13F | King Luther Capital Management Corp | 1.069.873 | 0,43 | 97.883 | 9,57 | ||||
| 2026-02-17 | 13F | Warren Averett Asset Management, LLC | 10.630 | 115,57 | 973 | 135,35 | ||||
| 2026-02-13 | 13F | Van Eck Associates Corp | 6.292.995 | 15,60 | 576 | 26,10 | ||||
| 2026-02-17 | 13F | Banco Bilbao Vizcaya Argentaria, S.a. | 0 | -100,00 | 0 | |||||
| 2026-01-21 | 13F | Indiana Trust & Investment Management CO | 500 | 0,00 | 46 | 9,76 | ||||
| 2026-02-13 | 13F | State Street Corp | 8.620 | 69,75 | 789 | 85,41 | ||||
| 2026-02-20 | 13F | Sunbelt Securities, Inc. | 360 | 0,00 | 33 | 6,67 | ||||
| 2026-01-23 | 13F | Sumitomo Mitsui Trust Holdings, Inc. | 396.151 | -16,24 | 36.244 | -8,62 | ||||
| 2026-02-17 | 13F | Silvercrest Asset Management Group Llc | 4.367 | 0,00 | 400 | 9,02 | ||||
| 2026-04-09 | 13F | TrueWealth Advisors, LLC | 3.661 | -58,63 | 398 | -50,93 | ||||
| 2026-02-09 | 13F | Themes Management Co LLC | 19.949 | 1.827 | ||||||
| 2026-02-13 | 13F | Squarepoint Ops LLC | Call | 96.100 | -58,34 | 8.792 | -54,55 | |||
| 2026-04-15 | 13F | Renaissance Investment Group LLC | 61.365 | 7,21 | 6.665 | 27,27 | ||||
| 2026-02-13 | 13F | Squarepoint Ops LLC | Put | 150.000 | -29,58 | 13.724 | -23,17 | |||
| 2026-02-19 | 13F | Atomi Financial Group, Inc. | 3.845 | -60,87 | 352 | -57,40 | ||||
| 2026-02-02 | 13F | Montag A & Associates Inc | 1.800 | 0,00 | 165 | 9,33 | ||||
| 2026-02-04 | 13F | Pacer Advisors, Inc. | 62.602 | 1.667,42 | 4.547 | 1.430,98 | ||||
| 2026-02-09 | 13F | Catalyst Funds Management Pty Ltd | 5.500 | 0,00 | 503 | 9,11 | ||||
| 2026-02-05 | 13F | Pacitti Group Inc. | 6.535 | 2,56 | 598 | 11,80 | ||||
| 2026-02-12 | 13F | Burke & Herbert Bank & Trust Co | 0 | -100,00 | 0 | |||||
| 2026-02-17 | 13F | Castle Hook Partners LP | 2.088.962 | -12,62 | 191.119 | -4,67 | ||||
| 2025-11-14 | 13F | Wolverine Trading, Llc | 80.821 | 5,58 | 6.826 | 21,72 | ||||
| 2025-11-14 | 13F | Wolverine Trading, Llc | Call | 427.100 | 2,37 | 36.073 | 18,01 | |||
| 2025-11-14 | 13F | Wolverine Trading, Llc | Put | 408.000 | 14,13 | 34.460 | 31,55 | |||
| 2026-02-03 | 13F | Chesapeake Capital Corp /il/ | 5.715 | 0,00 | 523 | 8,98 | ||||
| 2026-04-02 | 13F | Noble Wealth Management PBC | 40 | 0,00 | 4 | 33,33 | ||||
| 2026-02-17 | 13F | Colter Lewis Investment Partners LLC | 5.923 | 542 | ||||||
| 2026-02-17 | 13F | Capstone Investment Advisors, Llc | 3.048 | 279 | ||||||
| 2025-11-06 | 13F | Whipplewood Advisors, LLC | 0 | -100,00 | 0 | |||||
| 2026-01-30 | 13F | Kiker Wealth Management, LLC | 0 | -100,00 | 0 | -100,00 | ||||
| 2026-02-11 | 13F | MidWestOne Financial Group, Inc. | 5.136 | 0,23 | 470 | 9,32 | ||||
| 2025-11-03 | 13F | Stonegate Investment Group, LLC | 10.071 | 11,90 | 845 | 26,35 | ||||
| 2026-02-17 | 13F | Yaupon Capital Management LP | 0 | -100,00 | 0 | |||||
| 2026-02-06 | 13F | HighTower Advisors, LLC | 358.084 | 3,06 | 32.761 | 12,43 | ||||
| 2026-01-22 | 13F | Lesa Sroufe & Co | 3.190 | 0,00 | 0 | |||||
| 2026-02-11 | 13F | Syon Capital Llc | 8.246 | 754 | ||||||
| 2026-02-11 | 13F | Telemark Asset Management, LLC | 1.000.000 | 0,00 | 91.490 | 9,10 | ||||
| 2026-02-13 | 13F | Mml Investors Services, Llc | 45.713 | 8,54 | 4.182 | 18,44 | ||||
| 2026-04-01 | 13F | Bangor Savings Bank | 435 | -12,47 | 47 | 4,44 | ||||
| 2026-02-17 | 13F | Price T Rowe Associates Inc /md/ | 2.279.913 | -6,06 | 209 | 2,46 | ||||
| 2026-02-10 | 13F/A | Evolution Wealth Management Inc. | 0 | -100,00 | 0 | |||||
| 2026-02-06 | 13F | Pinnbrook Capital Management Lp | Call | 0 | -100,00 | 0 | -100,00 | |||
| 2026-04-21 | 13F | Grimes & Company, Inc. | 7.078 | -38,32 | 769 | -26,79 | ||||
| 2026-02-17 | 13F | Coppell Advisory Solutions LLC | 4.439 | 7,27 | 406 | 16,05 | ||||
| 2026-02-02 | 13F | Fifth Third Bancorp | 2.142 | -4,59 | 196 | 3,72 | ||||
| 2026-02-11 | 13F | Empowered Funds, LLC | 8.546 | -82,74 | 782 | -81,19 | ||||
| 2026-02-09 | 13F | Legal & General Group Plc | 2.619.923 | 5,51 | 240.206 | 15,23 | ||||
| 2026-02-17 | 13F | Maryland State Retirement & Pension System | 45.543 | 4.172 | ||||||
| 2026-02-10 | 13F | O'Neil Global Advisors, Inc. | 0 | -100,00 | 0 | -100,00 | ||||
| 2026-02-09 | 13F | Revere Asset Management, Inc | 54.162 | 4.955 | ||||||
| 2026-02-11 | 13F | Caldwell Investment Management Ltd. | 41.000 | 30,16 | 3.744 | 40,71 | ||||
| 2026-02-11 | 13F | Capital Wealth Planning, LLC | 150.738 | 37,64 | 14.857 | 61,76 | ||||
| 2026-04-20 | 13F | Kercheville Advisors, LLC | 43.227 | -13,61 | 4.695 | -23,02 | ||||
| 2026-02-10 | 13F | WCG Wealth Advisors LLC | 72.650 | 6.647 | ||||||
| 2026-01-30 | 13F | Canandaigua National Bank & Trust Co | 3.112 | -8,71 | 285 | -0,35 | ||||
| 2026-01-30 | 13F | Pekin Hardy Strauss, Inc. | 201.192 | -2,80 | 18.407 | 6,05 | ||||
| 2026-02-12 | 13F | Voya Investment Management Llc | 62.672 | 5.734 | ||||||
| 2026-02-13 | 13F | Neuberger Berman Group LLC | 542.917 | 161,45 | 49.681 | 185,24 | ||||
| 2026-02-13 | 13F | Candriam Luxembourg S.C.A. | 8.837 | 58,23 | 810 | 73,08 | ||||
| 2026-02-06 | 13F | Windmill Hill Asset Management Ltd | 9.328 | -24,01 | 853 | -17,10 | ||||
| 2026-02-18 | 13F | First Citizens Bank & Trust Co | 2.442 | -51,11 | 223 | -46,65 | ||||
| 2026-02-13 | 13F | Pinnacle Wealth Planning Services, Inc. | 2.222 | 203 | ||||||
| 2026-01-29 | 13F | D.a. Davidson & Co. | 85.579 | 7,85 | 7.830 | 17,66 | ||||
| 2026-04-13 | 13F | Hm Payson & Co | 399 | -5,45 | 43 | 13,16 | ||||
| 2026-02-17 | 13F | Blue Line Capital, LLC / IL | 12.035 | 1.101 | ||||||
| 2026-01-27 | 13F | Regions Financial Corp | 4.202 | -12,24 | 384 | -4,24 | ||||
| 2026-03-24 | 13F | Armis Advisers, LLC | 43.021 | -1,42 | 4.369 | -0,73 | ||||
| 2026-02-17 | 13F | Glenmede Trust Co Na | 9.071 | 830 | ||||||
| 2026-04-21 | 13F | Foundation Resource Management Inc | 56.025 | -1,71 | 6.085 | 16,66 | ||||
| 2026-02-06 | 13F | Global Retirement Partners, LLC | 4.818 | -0,80 | 441 | 8,11 | ||||
| 2025-11-13 | 13F | Jefferies Financial Group Inc. | Call | 0 | -100,00 | 0 | ||||
| 2026-01-30 | 13F | Trifecta Capital Advisors, LLC | 950 | 0,00 | 87 | 8,86 | ||||
| 2026-02-06 | 13F | Covestor Ltd | 62 | -6,06 | 0 | |||||
| 2026-04-20 | 13F | Minichmacgregor Wealth Management, Llc | 6.000 | -1,10 | 652 | 17,30 | ||||
| 2026-02-03 | 13F | Patten & Patten Inc/tn | 14.285 | 1,42 | 1.307 | 10,58 | ||||
| 2025-11-13 | 13F | Jefferies Financial Group Inc. | Put | 0 | -100,00 | 0 | ||||
| 2025-11-13 | 13F | Jefferies Financial Group Inc. | 0 | -100,00 | 0 | |||||
| 2026-04-13 | 13F | Bank of New Hampshire | 8.880 | 2,84 | 964 | 22,03 | ||||
| 2026-01-27 | 13F | Jackson, Grant Investment Advisers, Inc. | 248 | 0,00 | 23 | 10,00 | ||||
| 2026-04-20 | 13F | Banque Cantonale Vaudoise | 68.565 | 4,48 | 7.444 | 23,92 | ||||
| 2026-02-09 | 13F | IPG Investment Advisors LLC | 3.015 | 5,05 | 276 | 14,58 | ||||
| 2026-02-12 | 13F | Strata Wealth Advisors, LLC | 0 | -100,00 | 0 | |||||
| 2026-04-16 | 13F | SG Americas Securities, LLC | 217.275 | -5,64 | 24 | 9,52 | ||||
| 2026-01-29 | 13F | Riggs Asset Managment Co. Inc. | 46.934 | 0,09 | 4.294 | 9,18 | ||||
| 2026-02-03 | 13F | Crossmark Global Holdings, Inc. | 6.717 | -19,59 | 615 | -12,29 | ||||
| 2026-02-10 | 13F | Norges Bank | 4.841.376 | 443.265 | ||||||
| 2025-11-14 | 13F | Hamilton Wealth, LLC | 0 | -100,00 | 0 | |||||
| 2026-04-07 | 13F | Park Avenue Securities Llc | 5.478 | -9,86 | 1 | |||||
| 2026-01-30 | 13F | Archer Investment Corp | 189 | 0,00 | 17 | 13,33 | ||||
| 2026-02-12 | 13F | Bank Of Montreal /can/ | Put | 101.400 | -91,33 | 9.285 | -90,54 | |||
| 2026-02-12 | 13F | Bank Of Montreal /can/ | Call | 6.000 | -96,92 | 549 | -96,64 | |||
| 2026-02-12 | 13F | Bank Of Montreal /can/ | 5.236.640 | 1,52 | 479.512 | 10,85 | ||||
| 2026-01-30 | 13F | Camden Capital, LLC | 3.819 | 0,55 | 349 | 9,75 | ||||
| 2026-01-28 | 13F | Kapitalo Investimentos Ltda | 0 | -100,00 | 0 | |||||
| 2026-02-13 | 13F | Police & Firemen's Retirement System of New Jersey | 58.509 | -7,14 | 5.365 | 1,42 | ||||
| 2025-11-12 | 13F | Creekmur Asset Management LLC | 168 | 0,00 | 14 | 16,67 | ||||
| 2026-04-22 | 13F | Sterling Capital Management LLC | 272 | 30 | ||||||
| 2026-02-13 | 13F | Centiva Capital, LP | Call | 0 | -100,00 | 0 | ||||
| 2026-04-16 | 13F | Sheets Smith Wealth Management | 7.163 | 0,10 | 778 | 18,81 | ||||
| 2026-02-13 | 13F | Toroso Investments, LLC | 133.262 | 230,06 | 12.192 | 260,18 | ||||
| 2026-02-17 | 13F | Guggenheim Capital Llc | 25.710 | -5,01 | 2.352 | 3,66 | ||||
| 2026-02-17 | 13F | Oxford Asset Management Llp | 3.424 | -72,24 | 313 | -38,26 | ||||
| 2025-11-12 | 13F | Integrated Advisors Network LLC | 0 | -100,00 | 0 | |||||
| 2026-04-09 | 13F | Tealwood Asset Management Inc | 24.959 | -0,89 | 3 | 0,00 | ||||
| 2026-02-17 | 13F | Lloyd Harbor Capital Management, LLC | 267.461 | 22,99 | 24.470 | 34,19 | ||||
| 2026-02-17 | 13F | Bank Of America Corp /de/ | 7.575.390 | -0,40 | 693.072 | 8,66 | ||||
| 2026-02-02 | 13F | Chung Wu Investment Group, LLC | 6.530 | 71,84 | 597 | 87,74 | ||||
| 2026-04-22 | 13F | JNBA Financial Advisors | 39 | 0,00 | 4 | 33,33 | ||||
| 2026-02-17 | 13F | Orion Resource Partners LP | 22.317 | -17,73 | 2.042 | -10,25 | ||||
| 2026-01-26 | 13F | Moran Wealth Management, LLC | 35.441 | -4,67 | 3.242 | 4,01 | ||||
| 2026-02-05 | 13F | O'Brien Greene & Co. Inc | 14.400 | 0,00 | 1.317 | 9,11 | ||||
| 2025-11-14 | 13F | Manchester Capital Management LLC | 750 | 25,00 | 63 | 40,91 | ||||
| 2025-11-14 | 13F | Wetherby Asset Management Inc | 20.574 | 6,70 | 1.725 | 20,55 | ||||
| 2026-02-17 | 13F | Ameriprise Financial Inc | 187.629 | -72,69 | 17.707 | -69,52 | ||||
| 2026-01-13 | 13F | Dakota Wealth Management | 51.799 | 55,86 | 4.739 | 70,04 | ||||
| 2026-04-24 | 13F | Tcfg Wealth Management, Llc | 15.115 | -39,24 | 1.642 | -27,87 | ||||
| 2026-02-17 | 13F | Tanaka Capital Management Inc | 16.390 | -0,70 | 2 | 0,00 | ||||
| 2025-11-14 | 13F | ExodusPoint Capital Management, LP | 0 | -100,00 | 0 | |||||
| 2026-02-05 | 13F | L & S Advisors Inc | 78.113 | 6,03 | 7.147 | 15,67 | ||||
| 2026-02-17 | 13F | EFG International AG | 117.476 | 10.776 | ||||||
| 2026-04-21 | 13F | BCS Private Wealth Management, Inc. | 26.105 | 0,23 | 2.835 | 19,02 | ||||
| 2026-02-17 | 13F | Creative Planning | 82.018 | 19,22 | 7.504 | 30,08 | ||||
| 2026-04-09 | 13F | Whitaker-Myers Wealth Managers, LTD. | 0 | -100,00 | 0 | |||||
| 2026-02-04 | 13F | Independent Advisor Alliance | 6.243 | 15,18 | 571 | 25,77 | ||||
| 2026-02-11 | 13F | Ramirez Asset Management, Inc. | 123.674 | 4,72 | 11.315 | 14,25 | ||||
| 2026-02-13 | 13F | River Wealth Advisors LLC | 43.699 | 15,46 | 3.998 | 26,00 | ||||
| 2026-04-23 | 13F | Kohmann Bosshard Financial Services, LLC | 71 | 5,97 | 8 | 16,67 | ||||
| 2025-11-07 | 13F | Synovus Financial Corp | 59.309 | -23,45 | 4.974 | -13,53 | ||||
| 2026-02-17 | 13F | Sciencast Management LP | 34.486 | 3.155 | ||||||
| 2026-04-08 | 13F | Violich Capital Management, Inc. | 3.200 | 0,00 | 348 | 18,84 | ||||
| 2026-02-09 | 13F | Waratah Capital Advisors Ltd. | Call | 150.000 | 13.724 | |||||
| 2026-02-10 | 13F | Titan Global Capital Management Usa Llc | 36.011 | 1,93 | 3.295 | 11,21 | ||||
| 2026-01-23 | 13F | Smith, Moore & Co. | 2.641 | -2,11 | 242 | 6,64 | ||||
| 2026-02-11 | 13F | Wellspring Financial Advisors, LLC | 4.077 | 373 | ||||||
| 2026-02-13 | 13F | Wells Fargo & Company/mn | 394.601 | 5,92 | 36.102 | 15,56 | ||||
| 2026-04-08 | 13F | Wealth Enhancement Advisory Services, Llc | 10.715 | -35,90 | 1.206 | -29,31 | ||||
| 2026-04-20 | 13F | CWA Asset Management Group, LLC | 207.625 | -2,86 | 22.550 | 15,32 | ||||
| 2026-01-22 | 13F | Bear Mountain Capital, Inc. | 250 | 0,00 | 28 | 40,00 | ||||
| 2026-02-11 | 13F | Strategy Asset Managers Llc | 15.423 | 2,19 | 1.411 | 11,54 | ||||
| 2026-02-03 | 13F | Navellier & Associates Inc | 0 | -100,00 | 0 | -100,00 | ||||
| 2025-11-13 | 13F | Summit X, LLC | 0 | -100,00 | 0 | |||||
| 2026-04-20 | 13F | Meyer Handelman Co | 4.950 | 0,00 | 538 | 18,81 | ||||
| 2026-02-12 | 13F | Barometer Capital Management Inc. | 0 | -100,00 | 0 | |||||
| 2026-02-17 | 13F | Man Group plc | 1.599.017 | -5,87 | 146.294 | 2,69 | ||||
| 2026-02-17 | 13F | Permanens Capital L.P. | 174.183 | 4,52 | 15.936 | 14,03 | ||||
| 2026-04-17 | 13F | PKO Investment Management Joint-Stock Co | 17.300 | 39,52 | 1.877 | 65,08 | ||||
| 2026-02-10 | 13F | Operose Advisors LLC | 3.728 | -19,69 | 341 | -12,34 | ||||
| 2026-02-17 | 13F | Toronto Dominion Bank | Call | 5.100 | -50,96 | 467 | -46,44 | |||
| 2026-02-17 | 13F | Toronto Dominion Bank | Put | 41.600 | 20,58 | 3.809 | 31,62 | |||
| 2026-01-09 | 13F | TABR Capital Management, LLC | 0 | -100,00 | 0 | |||||
| 2026-02-17 | 13F | Toronto Dominion Bank | 1.524.482 | 88,95 | 139.594 | 106,19 | ||||
| 2026-02-17 | 13F | Yaupon Capital Management LP | Put | 205.000 | 18.755 | |||||
| 2026-03-31 | 13F | Sankala Group LLC | 250 | 0,00 | 26 | -10,34 | ||||
| 2026-02-17 | 13F | Lombard Odier Asset Management (Switzerland) SA | 13.313 | 32,96 | 1.219 | 45,12 | ||||
| 2026-01-22 | 13F | Mh & Associates Securities Management Corp /adv | 31.359 | 2.869 | ||||||
| 2026-02-10 | 13F | Verus Capital Partners, Llc | 6.876 | -3,45 | 629 | 5,36 | ||||
| 2026-02-17 | 13F | Lighthouse Investment Partners, LLC | 50.000 | 4.574 | ||||||
| 2026-02-12 | 13F | Titleist Asset Management, Llc | 19.088 | 17,73 | 1.746 | 28,48 | ||||
| 2026-01-21 | 13F | Leo Wealth, LLC | 5.618 | -10,94 | 514 | -2,84 | ||||
| 2026-02-03 | 13F | Sterling Investment Management, Inc. | 34.553 | -1,45 | 3.161 | 7,52 | ||||
| 2026-02-13 | 13F | Southport Management, L.l.c. | 27.500 | -8,33 | 2.516 | 0,00 | ||||
| 2026-02-17 | 13F | London & Capital Asset Management Ltd | 185.553 | 16.977 | ||||||
| 2026-02-11 | 13F | Capital World Investors | 13.545.354 | 0,31 | 1.240.047 | 9,43 | ||||
| 2026-02-13 | 13F | BNP Paribas Asset Management Holding S.A. | 790.629 | 16,93 | 74 | 30,36 | ||||
| 2026-02-17 | 13F | Manatuck Hill Partners, LLC | 0 | -100,00 | 0 | |||||
| 2026-02-10 | 13F | State of Wyoming | 538 | -82,90 | 49 | -81,37 | ||||
| 2026-02-13 | 13F | Oxford Financial Group Ltd | 0 | -100,00 | 0 | |||||
| 2026-04-08 | 13F | Dynamic Advisor Solutions LLC | 15.883 | 3,73 | 1.725 | 23,21 | ||||
| 2026-04-17 | 13F | Athena Wealth Management, LLC | 2.690 | 292 | ||||||
| 2026-04-07 | 13F | Eastern Bank | 0 | -100,00 | 0 | |||||
| 2026-02-12 | 13F | Andra AP-fonden | 17.180 | 2.159 | ||||||
| 2026-02-13 | 13F | Mountaineer Partners Management, LLC | 42.424 | 3.881 | ||||||
| 2026-02-10 | 13F | Intech Investment Management Llc | 361.820 | -27,74 | 33.174 | -21,07 | ||||
| 2026-02-18 | 13F | State of Tennessee, Treasury Department | 253.124 | -1,31 | 31.480 | 46,22 | ||||
| 2025-11-21 | 13F | Nebula Research & Development LLC | 0 | -100,00 | 0 | -100,00 | ||||
| 2026-04-16 | 13F | SG Americas Securities, LLC | Call | 0 | -100,00 | 0 | ||||
| 2026-02-06 | 13F | Kimelman & Baird, LLC | 0 | -100,00 | 0 | |||||
| 2026-02-04 | 13F | Community Bank, N.A. | 965 | 0,00 | 88 | 10,00 | ||||
| 2026-02-12 | 13F | Principal Securities, Inc. | 0 | -100,00 | 0 | -100,00 | ||||
| 2026-02-09 | 13F | Mediolanum International Funds Ltd | 23.885 | -30,30 | 2.185 | -24,53 | ||||
| 2026-02-09 | 13F | Fisher Asset Management, LLC | 6.741 | 36,13 | 617 | 48,43 | ||||
| 2026-04-13 | 13F | Gill Capital Partners, Llc | 230 | 25 | ||||||
| 2026-04-21 | 13F | Financial Consulate, Inc | 318 | 4,61 | 35 | 25,93 | ||||
| 2026-04-08 | 13F | Thompson Investment Management, Inc. | 2.605 | 0,00 | 283 | 18,49 | ||||
| 2026-02-09 | 13F | Waratah Capital Advisors Ltd. | 0 | -100,00 | 0 | -100,00 | ||||
| 2026-02-10 | 13F | One Capital Management, LLC | 4.200 | 384 | ||||||
| 2026-02-09 | 13F | Integrity Alliance, Llc. | 8.814 | 806 | ||||||
| 2026-02-10 | 13F | IAG Wealth Partners, LLC | 184 | 0,00 | 17 | 6,67 | ||||
| 2025-11-14 | 13F | Sourcerock Group LLC | 0 | -100,00 | 0 | -100,00 | ||||
| 2026-02-13 | 13F | Kilter Group LLC | 23 | 2 | ||||||
| 2026-02-13 | 13F | Flow Traders U.s. Llc | 0 | -100,00 | 0 | |||||
| 2026-01-07 | 13F | Procyon Private Wealth Partners, LLC | 2.363 | -4,83 | 216 | 3,85 | ||||
| 2026-04-24 | 13F | Black Swift Group, LLC | 3.000 | 326 | ||||||
| 2026-02-17 | 13F | KADENSA CAPITAL Ltd | 0 | -100,00 | 0 |