Grundlæggende statistik
| Porteføljeværdi | $ 154.151.980 |
| Nuværende stillinger | 103 |
Seneste beholdninger, ydeevne, AUM (fra 13F, 13D)
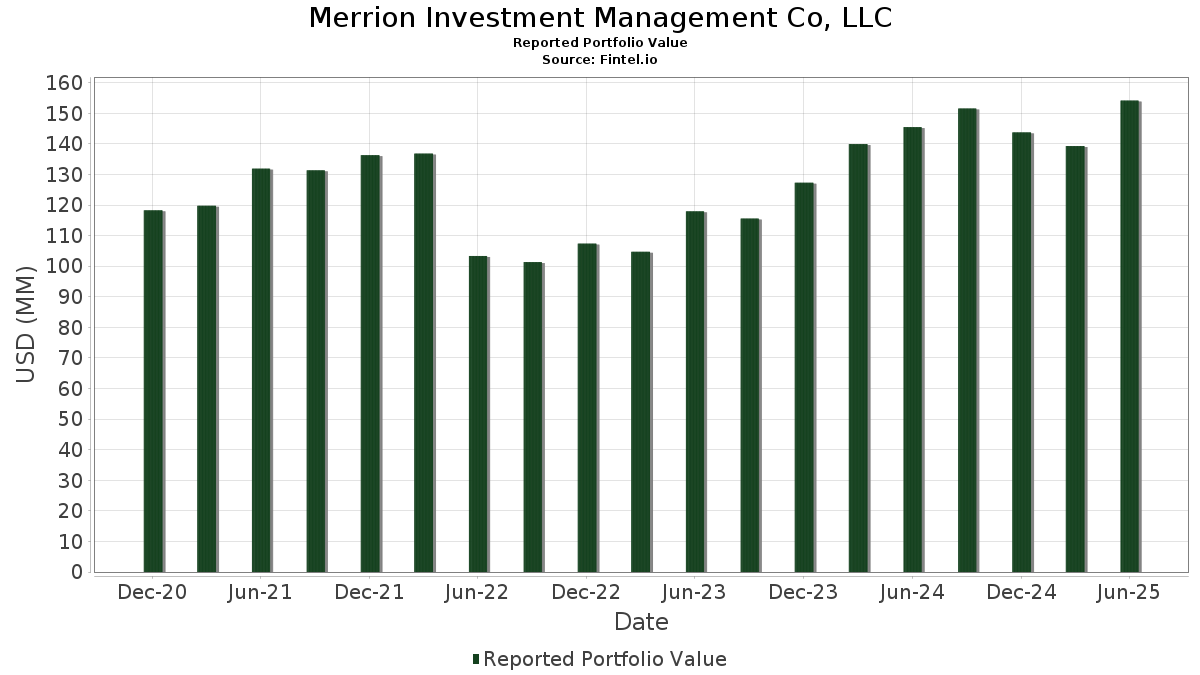
Merrion Investment Management Co, LLC har afsløret 103 samlede besiddelser i deres seneste SEC-arkivering. Den seneste porteføljeværdi er beregnet til at være $ 154.151.980 USD. Faktiske aktiver under forvaltning (AUM) er denne værdi plus kontanter (som ikke er oplyst). Merrion Investment Management Co, LLCs største beholdninger er Cameco Corporation (US:CCJ) , Jefferies Financial Group Inc. (US:JEF) , Direxion Shares ETF Trust - Direxion Daily NVDA Bear 1X Shares (US:NVDD) , Alphabet Inc. (US:GOOG) , and Apple Inc. (US:AAPL) . Merrion Investment Management Co, LLCs nye stillinger omfatter Baker Hughes Company (US:BKR) , Orla Mining Ltd. (US:ORLA) , Palantir Technologies Inc. (US:PLTR) , Blue Owl Capital Inc. (US:OWL) , and .
Top øger dette kvartal
Vi bruger ændringen i porteføljeallokeringen, fordi dette er den mest meningsfulde metrik. Ændringer kan skyldes handler eller ændringer i aktiekurser.
| Sikkerhed | Aktier (MM) |
Værdi (MM$) |
Portefølje % | ΔPortefølje % |
|---|---|---|---|---|
| 0,20 | 14,88 | 9,6548 | 3,4196 | |
| 0,07 | 10,40 | 6,7469 | 1,4168 | |
| 0,03 | 3,85 | 2,4990 | 0,9440 | |
| 0,01 | 2,96 | 1,9171 | 0,6656 | |
| 0,01 | 2,43 | 1,5756 | 0,5397 | |
| 0,02 | 0,73 | 0,4726 | 0,4726 | |
| 0,01 | 3,88 | 2,5201 | 0,3673 | |
| 0,01 | 3,41 | 2,2139 | 0,3055 | |
| 0,04 | 0,35 | 0,2301 | 0,2301 | |
| 0,00 | 1,42 | 0,9208 | 0,2111 |
Top falder i dette kvartal
Vi bruger ændringen i porteføljeallokeringen, fordi dette er den mest meningsfulde metrik. Ændringer kan skyldes handler eller ændringer i aktiekurser.
| Sikkerhed | Aktier (MM) |
Værdi (MM$) |
Portefølje % | ΔPortefølje % |
|---|---|---|---|---|
| 0,04 | 7,75 | 5,0306 | -2,5750 | |
| 0,01 | 4,92 | 3,1944 | -1,1948 | |
| 0,21 | 11,34 | 7,3551 | -0,7837 | |
| 0,12 | 2,45 | 1,5878 | -0,6653 | |
| 0,09 | 1,93 | 1,2549 | -0,4726 | |
| 0,01 | 1,48 | 0,9576 | -0,4312 | |
| 0,01 | 1,36 | 0,8795 | -0,3651 | |
| 0,15 | 0,53 | 0,3406 | -0,3298 | |
| 0,03 | 2,43 | 1,5769 | -0,3207 | |
| 0,00 | 0,62 | 0,4051 | -0,2388 |
13F og Fondsarkivering
Denne formular blev indsendt den 2025-08-07 for rapporteringsperioden 2025-06-30. Klik på linkikonet for at se den fulde transaktionshistorik.
Opgrader for at låse op for premium-data og eksportere til Excel ![]() .
.
| Sikkerhed | Type | Gennemsnitlig aktiekurs | Aktier (MM) |
Δ Aktier (%) |
Δ Aktier (%) |
Værdi ($MM) |
Portefølje (%) |
ΔPortefølje (%) |
|
|---|---|---|---|---|---|---|---|---|---|
| CCJ / Cameco Corporation | 0,20 | -4,98 | 14,88 | 71,38 | 9,6548 | 3,4196 | |||
| JEF / Jefferies Financial Group Inc. | 0,21 | -2,03 | 11,34 | 0,02 | 7,3551 | -0,7837 | |||
| NVDD / Direxion Shares ETF Trust - Direxion Daily NVDA Bear 1X Shares | 0,07 | -3,90 | 10,40 | 40,09 | 6,7469 | 1,4168 | |||
| GOOG / Alphabet Inc. | 0,06 | -0,39 | 10,01 | 13,11 | 6,4962 | 0,1396 | |||
| AAPL / Apple Inc. | 0,04 | -20,75 | 7,75 | -26,80 | 5,0306 | -2,5750 | |||
| BRK.B / Berkshire Hathaway Inc. | 0,01 | -11,69 | 4,92 | -19,45 | 3,1944 | -1,1948 | |||
| MGM / MGM Resorts International | 0,11 | -2,56 | 3,93 | 13,05 | 2,5519 | 0,0539 | |||
| GS / The Goldman Sachs Group, Inc. | 0,01 | 0,00 | 3,88 | 29,55 | 2,5201 | 0,3673 | |||
| VRT / Vertiv Holdings Co | 0,03 | 0,00 | 3,85 | 77,84 | 2,4990 | 0,9440 | |||
| MSFT / Microsoft Corporation | 0,01 | -3,11 | 3,41 | 28,37 | 2,2139 | 0,3055 | |||
| NVEC / NVE Corporation | 0,04 | -6,50 | 3,18 | 7,95 | 2,0629 | -0,0516 | |||
| GEV / GE Vernova Inc. | 0,01 | -2,19 | 2,96 | 69,54 | 1,9171 | 0,6656 | |||
| SPY / SPDR S&P 500 ETF | 0,00 | -2,95 | 2,85 | 7,19 | 1,8473 | -0,0599 | |||
| GLW / Corning Incorporated | 0,05 | 0,00 | 2,66 | 14,89 | 1,7228 | 0,0630 | |||
| MPC / Marathon Petroleum Corporation | 0,02 | -4,10 | 2,59 | 9,36 | 1,6831 | -0,0204 | |||
| CNQ / Canadian Natural Resources Limited | 0,08 | -2,48 | 2,47 | -1,90 | 1,6051 | -0,2056 | |||
| NMM / Navios Maritime Partners L.P. - Limited Partnership | 0,07 | 8,33 | 2,45 | 4,08 | 1,5888 | -0,1007 | |||
| HAL / Halliburton Company | 0,12 | -2,91 | 2,45 | -22,02 | 1,5878 | -0,6653 | |||
| AIG / American International Group, Inc. | 0,03 | -6,58 | 2,43 | -8,02 | 1,5769 | -0,3207 | |||
| CEG / Constellation Energy Corporation | 0,01 | 5,16 | 2,43 | 68,38 | 1,5756 | 0,5397 | |||
| TFPM / Triple Flag Precious Metals Corp. | 0,09 | 0,00 | 2,14 | 23,74 | 1,3865 | 0,1461 | |||
| VTS / Vitesse Energy, Inc. | 0,09 | -10,50 | 1,93 | -19,62 | 1,2549 | -0,4726 | |||
| AJG / Arthur J. Gallagher & Co. | 0,01 | 0,00 | 1,60 | -7,30 | 1,0383 | -0,2010 | |||
| JNJ / Johnson & Johnson | 0,01 | -17,15 | 1,48 | -23,68 | 0,9576 | -0,4312 | |||
| NFLX / Netflix, Inc. | 0,00 | 0,00 | 1,42 | 43,62 | 0,9208 | 0,2111 | |||
| MU / Micron Technology, Inc. | 0,01 | 0,00 | 1,39 | 41,88 | 0,9015 | 0,1981 | |||
| COST / Costco Wholesale Corporation | 0,00 | 5,66 | 1,39 | 10,53 | 0,8991 | -0,0006 | |||
| XOM / Exxon Mobil Corporation | 0,01 | -13,72 | 1,36 | -21,81 | 0,8795 | -0,3651 | |||
| AMZN / Amazon.com, Inc. | 0,01 | 0,00 | 1,32 | 15,32 | 0,8546 | 0,0344 | |||
| ABBV / AbbVie Inc. | 0,01 | 0,00 | 1,30 | -11,39 | 0,8429 | -0,2101 | |||
| JPM / JPMorgan Chase & Co. | 0,00 | -7,27 | 1,20 | 9,58 | 0,7793 | -0,0077 | |||
| QQQ / Invesco QQQ Trust, Series 1 | 0,00 | 19,60 | 1,18 | 40,74 | 0,7644 | 0,1631 | |||
| GE / General Electric Company | 0,00 | -1,18 | 1,08 | 27,18 | 0,7013 | 0,0906 | |||
| BWXT / BWX Technologies, Inc. | 0,01 | -1,87 | 1,06 | 43,34 | 0,6850 | 0,1559 | |||
| GSAT / Globalstar, Inc. | 0,04 | 0,00 | 1,03 | 12,84 | 0,6673 | 0,0131 | |||
| LLY / Eli Lilly and Company | 0,00 | -13,33 | 1,01 | -18,17 | 0,6574 | -0,2321 | |||
| APO / Apollo Global Management, Inc. | 0,01 | 12,76 | 0,97 | 16,85 | 0,6304 | 0,0331 | |||
| UTG / Reaves Utility Income Fund | 0,03 | 0,00 | 0,90 | 11,19 | 0,5868 | 0,0027 | |||
| META / Meta Platforms, Inc. | 0,00 | 2,33 | 0,81 | 31,02 | 0,5267 | 0,0819 | |||
| CB / Chubb Limited | 0,00 | 0,00 | 0,80 | -4,41 | 0,5208 | -0,0818 | |||
| WMB / The Williams Companies, Inc. | 0,01 | -2,30 | 0,80 | 2,70 | 0,5195 | -0,0404 | |||
| NE / Noble Corporation plc | 0,03 | 0,00 | 0,80 | 11,95 | 0,5167 | 0,0062 | |||
| HON / Honeywell International Inc. | 0,00 | -3,54 | 0,79 | 6,02 | 0,5142 | -0,0223 | |||
| PEG / Public Service Enterprise Group Incorporated | 0,01 | -11,17 | 0,77 | -9,09 | 0,4997 | -0,1089 | |||
| QCOM / QUALCOMM Incorporated | 0,00 | -3,66 | 0,73 | -0,14 | 0,4763 | -0,0514 | |||
| BKR / Baker Hughes Company | 0,02 | 0,73 | 0,4726 | 0,4726 | |||||
| EPD / Enterprise Products Partners L.P. - Limited Partnership | 0,02 | -5,46 | 0,70 | -14,15 | 0,4569 | -0,1319 | |||
| PG / The Procter & Gamble Company | 0,00 | -4,39 | 0,69 | -10,68 | 0,4507 | -0,1073 | |||
| AMGN / Amgen Inc. | 0,00 | 0,00 | 0,69 | -10,29 | 0,4470 | -0,1050 | |||
| HD / The Home Depot, Inc. | 0,00 | -22,36 | 0,69 | -22,37 | 0,4460 | -0,1895 | |||
| CVX / Chevron Corporation | 0,00 | -18,65 | 0,62 | -30,36 | 0,4051 | -0,2388 | |||
| LNG / Cheniere Energy, Inc. | 0,00 | 0,00 | 0,61 | 5,19 | 0,3949 | -0,0204 | |||
| TSLX / Sixth Street Specialty Lending, Inc. | 0,03 | 0,00 | 0,60 | 6,44 | 0,3861 | -0,0155 | |||
| MPLX / MPLX LP - Limited Partnership | 0,01 | 0,00 | 0,59 | -3,73 | 0,3851 | -0,0577 | |||
| ICE / Intercontinental Exchange, Inc. | 0,00 | 0,00 | 0,56 | 6,50 | 0,3615 | -0,0147 | |||
| VRTX / Vertex Pharmaceuticals Incorporated | 0,00 | 0,00 | 0,56 | -8,25 | 0,3610 | -0,0741 | |||
| MLM / Martin Marietta Materials, Inc. | 0,00 | 0,00 | 0,55 | 14,64 | 0,3561 | 0,0128 | |||
| PSX / Phillips 66 | 0,00 | -10,00 | 0,54 | -13,13 | 0,3483 | -0,0950 | |||
| TECK / Teck Resources Limited | 0,01 | -8,48 | 0,53 | 1,34 | 0,3451 | -0,0314 | |||
| MERC / Mercer International Inc. | 0,15 | 0,00 | 0,53 | -43,73 | 0,3406 | -0,3298 | |||
| SAP / SAP SE - Depositary Receipt (Common Stock) | 0,00 | 0,00 | 0,49 | 13,36 | 0,3196 | 0,0074 | |||
| WMT / Walmart Inc. | 0,01 | 0,00 | 0,49 | 11,42 | 0,3172 | 0,0020 | |||
| SPG / Simon Property Group, Inc. | 0,00 | 0,00 | 0,48 | -3,21 | 0,3129 | -0,0449 | |||
| WM / Waste Management, Inc. | 0,00 | 0,00 | 0,48 | -1,23 | 0,3117 | -0,0373 | |||
| LIN / Linde plc | 0,00 | 0,00 | 0,48 | 0,85 | 0,3095 | -0,0305 | |||
| FCNCA / First Citizens BancShares, Inc. | 0,00 | 26,88 | 0,46 | 34,01 | 0,2995 | 0,0519 | |||
| AXP / American Express Company | 0,00 | 0,00 | 0,45 | 18,68 | 0,2930 | 0,0195 | |||
| MMC / Marsh & McLennan Companies, Inc. | 0,00 | 0,00 | 0,44 | -10,30 | 0,2881 | -0,0678 | |||
| RSP / Invesco Exchange-Traded Fund Trust - Invesco S&P 500 Equal Weight ETF | 0,00 | -19,17 | 0,44 | -15,22 | 0,2859 | -0,0872 | |||
| VIVA.X / Vanguard Index Funds - Vanguard Value ETF | 0,00 | 7,69 | 0,43 | 10,46 | 0,2809 | -0,0012 | |||
| MA / Mastercard Incorporated | 0,00 | 0,00 | 0,42 | 2,43 | 0,2734 | -0,0217 | |||
| PNC / The PNC Financial Services Group, Inc. | 0,00 | -17,59 | 0,41 | -12,66 | 0,2691 | -0,0717 | |||
| PANW / Palo Alto Networks, Inc. | 0,00 | 0,00 | 0,41 | 19,94 | 0,2655 | 0,0205 | |||
| ENVX / Enovix Corporation | 0,04 | -0,08 | 0,39 | 40,65 | 0,2542 | 0,0543 | |||
| CAT / Caterpillar Inc. | 0,00 | 0,00 | 0,39 | 17,93 | 0,2518 | 0,0151 | |||
| XYL / Xylem Inc. | 0,00 | 0,00 | 0,39 | 8,38 | 0,2518 | -0,0055 | |||
| LYB / LyondellBasell Industries N.V. | 0,01 | 1,15 | 0,38 | -16,99 | 0,2477 | -0,0821 | |||
| OKE / ONEOK, Inc. | 0,00 | 12,50 | 0,37 | -7,32 | 0,2383 | -0,0466 | |||
| TSLA / Tesla, Inc. | 0,00 | 0,00 | 0,37 | 22,41 | 0,2380 | 0,0231 | |||
| SOXX / iShares Trust - iShares Semiconductor ETF | 0,00 | 0,00 | 0,36 | 26,95 | 0,2323 | 0,0296 | |||
| V / Visa Inc. | 0,00 | 0,00 | 0,36 | 1,43 | 0,2303 | -0,0213 | |||
| ORLA / Orla Mining Ltd. | 0,04 | 0,35 | 0,2301 | 0,2301 | |||||
| NEE / NextEra Energy, Inc. | 0,00 | -29,60 | 0,34 | -31,05 | 0,2222 | -0,1345 | |||
| PFF / iShares Trust - iShares Preferred and Income Securities ETF | 0,01 | 0,00 | 0,31 | -0,33 | 0,1990 | -0,0216 | |||
| PLTR / Palantir Technologies Inc. | 0,00 | 0,31 | 0,1990 | 0,1990 | |||||
| GLD / SPDR Gold Trust | 0,00 | 0,00 | 0,30 | 5,56 | 0,1977 | -0,0091 | |||
| BX / Blackstone Inc. | 0,00 | -20,00 | 0,30 | -14,33 | 0,1941 | -0,0568 | |||
| NVS / Novartis AG - Depositary Receipt (Common Stock) | 0,00 | 0,00 | 0,29 | 8,33 | 0,1860 | -0,0036 | |||
| ITA / iShares Trust - iShares U.S. Aerospace & Defense ETF | 0,00 | 0,00 | 0,28 | 23,14 | 0,1836 | 0,0187 | |||
| MS / Morgan Stanley | 0,00 | 0,00 | 0,28 | 20,60 | 0,1828 | 0,0152 | |||
| WCN / Waste Connections, Inc. | 0,00 | 0,00 | 0,28 | -4,11 | 0,1817 | -0,0285 | |||
| HLT / Hilton Worldwide Holdings Inc. | 0,00 | 0,00 | 0,27 | 17,18 | 0,1728 | 0,0094 | |||
| AB / AllianceBernstein Holding L.P. - Limited Partnership | 0,01 | 0,00 | 0,27 | 6,43 | 0,1722 | -0,0066 | |||
| TSCO / Tractor Supply Company | 0,01 | 0,00 | 0,26 | -4,36 | 0,1712 | -0,0266 | |||
| NRA / NRG Energy, Inc. | 0,00 | 0,26 | 0,1703 | 0,1703 | |||||
| UBER / Uber Technologies, Inc. | 0,00 | -1,77 | 0,26 | 25,73 | 0,1683 | 0,0202 | |||
| MSGS / Madison Square Garden Sports Corp. | 0,00 | -2,39 | 0,26 | 4,51 | 0,1660 | -0,0094 | |||
| SPLV / Invesco Exchange-Traded Fund Trust II - Invesco S&P 500 Low Volatility ETF | 0,00 | 0,00 | 0,25 | -2,68 | 0,1653 | -0,0224 | |||
| IVV / iShares Trust - iShares Core S&P 500 ETF | 0,00 | 0,00 | 0,24 | 10,75 | 0,1539 | -0,0002 | |||
| OLN / Olin Corporation | 0,01 | -0,97 | 0,23 | -17,82 | 0,1469 | -0,0512 | |||
| LHX / L3Harris Technologies, Inc. | 0,00 | 0,22 | 0,1396 | 0,1396 | |||||
| NOW / ServiceNow, Inc. | 0,00 | 0,21 | 0,1334 | 0,1334 | |||||
| OWL / Blue Owl Capital Inc. | 0,01 | 0,19 | 0,1246 | 0,1246 | |||||
| FCX / Freeport-McMoRan Inc. | 0,00 | -100,00 | 0,00 | 0,0000 | |||||
| COP / ConocoPhillips | 0,00 | -100,00 | 0,00 | 0,0000 |