Grundlæggende statistik
| Institutionelle ejere | 1200 total, 1132 long only, 17 short only, 51 long/short - change of -1,87% MRQ |
| Gennemsnitlig porteføljeallokering | 0.7858 % - change of -14,85% MRQ |
| Institutionelle aktier (lange) | 491.109.321 (ex 13D/G) - change of 39,69MM shares 8,79% MRQ |
| Institutionel værdi (lang) | $ 42.170.432 USD ($1000) |
Institutionelt ejerskab og aktionærer
iShares Trust - iShares 20+ Year Treasury Bond ETF (US:TLT) har 1200 institutionelle ejere og aktionærer, der har indsendt 13D/G- eller 13F-formularer til Securities Exchange Commission (SEC). Disse institutioner har i alt 491,109,321 aktier. Største aktionærer omfatter Bank Of America Corp /de/, Northwestern Mutual Wealth Management Co, Jane Street Group, Llc, TMF - Direxion Daily 20+ Year Treasury Bull 3X Shares, Susquehanna International Group, Llp, Susquehanna International Group, Llp, Citadel Advisors Llc, Rafferty Asset Management, LLC, BlackRock, Inc., and Citigroup Inc .
iShares Trust - iShares 20+ Year Treasury Bond ETF (NasdaqGM:TLT) institutionel ejerskabsstruktur viser aktuelle positioner i virksomheden efter institutioner og fonde, samt seneste ændringer i positionsstørrelse. Større aktionærer kan omfatte individuelle investorer, investeringsforeninger, hedgefonde eller institutioner. Skema 13D angiver, at investoren besidder (eller besidder) mere end 5 % af virksomheden og har til hensigt (eller har til hensigt at) aktivt at forfølge en ændring i forretningsstrategi. Skema 13G indikerer en passiv investering på over 5%.
The share price as of March 13, 2026 is 86,54 / share. Previously, on March 17, 2025, the share price was 90,62 / share. This represents a decline of 4,50% over that period.

Fondens stemningsscore
Fund Sentiment Score (fka Ownership Accumulation Score) finder de aktier, der bliver mest købt af fonde. Det er resultatet af en sofistikeret, multi-faktor kvantitativ model, der identificerer virksomheder med de højeste niveauer af institutionel akkumulering. Scoringsmodellen bruger en kombination af den samlede stigning i oplyste ejere, ændringerne i porteføljeallokeringer i disse ejere og andre målinger. Tallet går fra 0 til 100, hvor højere tal indikerer et højere niveau af akkumulering for sine jævnaldrende, og 50 er gennemsnittet.
Opdateringsfrekvens: Dagligt
Se Ownership Explorer, som giver en liste over højest rangerende virksomheder.
AI+ Ask Fintel’s AI assistant about iShares Trust - iShares 20+ Year Treasury Bond ETF.
Select a question to share a public post with an AI-crafted answer.
Thinking of good questions…
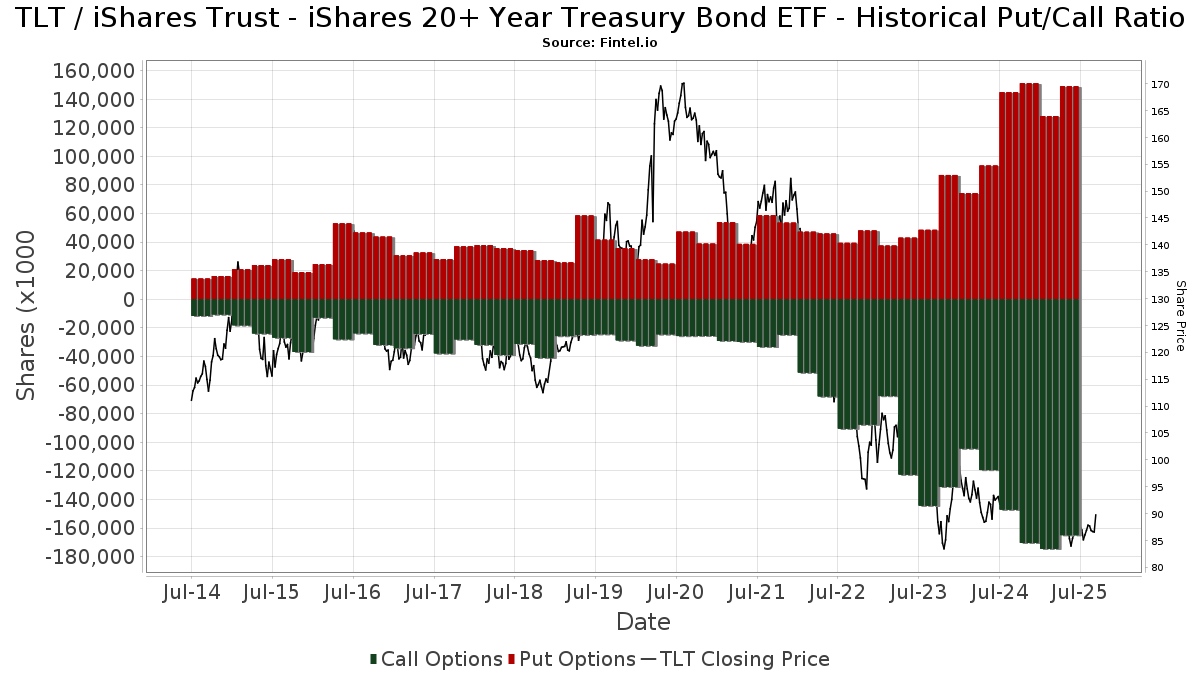
Institutionel Put/Call-forhold
Ud over at indberette standardaktie- og gældsudstedelser skal institutter med mere end 100 mill. aktiver under forvaltning også oplyse deres put- og call-optionsbeholdninger. Da salgsoptioner generelt indikerer negativ stemning, og købsoptioner indikerer positiv stemning, kan vi få en fornemmelse af den overordnede institutionelle stemning ved at plotte forholdet mellem put og kald. Diagrammet til højre viser det historiske put/call-forhold for dette instrument.
Brug af Put/Call Ratio som en indikator for investorernes stemning overvinder en af de vigtigste mangler ved at bruge totalt institutionelt ejerskab, som er, at en betydelig mængde af aktiver under forvaltning investeres passivt for at spore indekser. Passivt forvaltede fonde køber typisk ikke optioner, så indikatoren for put/call-forholdet følger mere nøje følelsen af aktivt forvaltede fonde.
13F og NPORT arkivering
Detaljer om 13F-arkivering er gratis. Detaljer om NP-ansøgninger kræver et premium-medlemskab. Grønne rækker angiver nye positioner. Røde rækker angiver lukkede positioner. Klik på linket ikon for at se den fulde transaktionshistorik.
Opgrader
for at låse premium-data op og eksportere til Excel ![]() .
.
Important Note
In an effort to reduce load times for our mobile users, we are testing some ways to deliver lighter pages.
In this first test, we will deliver only the most recent 750 transactions (out of 1618 for this stock). If you are interested in loading *all* the transactions for this company, click the "load all" button below. This is just a test and if you don't like it, please let us know by submitting some gentle feedback via the link at the bottom of this page.
Load All| Fil dato | Kilde | Investor | Type | Gennemsnitlig pris (Øst) |
Aktier | Δ Aktier (%) |
Rapporteret Værdi ($1000) |
Δ Værdi (%) |
Port Alloc (%) |
|
|---|---|---|---|---|---|---|---|---|---|---|
| 2026-02-17 | 13F | DV Trading LLC | 11.651 | 1.016 | ||||||
| 2026-02-13 | 13F | Walleye Capital LLC | 186.130 | 16.223 | ||||||
| 2026-02-13 | 13F | Walleye Capital LLC | Call | 499.600 | -76,89 | 43.545 | -77,46 | |||
| 2026-02-17 | 13F | Brevan Howard Capital Management LP | Call | 1.000.000 | 0,00 | 87.160 | -2,47 | |||
| 2026-01-09 | 13F | Cultivar Capital, Inc. | 146.188 | 3,29 | 12.742 | 0,74 | ||||
| 2026-02-17 | 13F | Brevan Howard Capital Management LP | 160.000 | 13.946 | ||||||
| 2026-02-17 | 13F | Brevan Howard Capital Management LP | Put | 1.000.000 | 0,00 | 87.160 | -2,47 | |||
| 2026-02-13 | 13F | Wells Fargo & Company/mn | 4.455.020 | -2,93 | 388.299 | -5,33 | ||||
| 2026-02-17 | 13F | Bank Of America Corp /de/ | Call | 0 | -100,00 | 0 | ||||
| 2026-01-07 | 13F | Private Client Services, Llc | 0 | -100,00 | 0 | |||||
| 2026-01-28 | 13F | Consolidated Planning Corp | 2.649 | 2,24 | 231 | -0,43 | ||||
| 2026-02-03 | 13F | Ballast Advisors Llc | 1.767 | -18,04 | 154 | -19,79 | ||||
| 2026-01-12 | 13F | ONE Advisory Partners, LLC | 12.338 | 48,01 | 1.075 | 42,57 | ||||
| 2026-02-13 | 13F | Delos Wealth Advisors, LLC | 9.465 | 39,29 | 825 | 35,75 | ||||
| 2026-01-22 | 13F | AllGen Financial Advisors, Inc. | 18.941 | -51,00 | 1.651 | -52,23 | ||||
| 2025-11-06 | 13F | Claudia M.p. Batlle, Crp (r) Llc | 0 | -100,00 | 0 | |||||
| 2026-02-13 | 13F | Archetype Wealth Partners | 7.542 | 0,00 | 1 | |||||
| 2026-02-20 | 13F | Kovitz Investment Group Partners, LLC | 119.017 | 9,22 | 10.374 | 6,52 | ||||
| 2026-01-13 | 13F | Sharkey, Howes & Javer | 234.820 | 30,08 | 20.467 | 26,86 | ||||
| 2026-01-30 | 13F | Sigma Planning Corp | 45.336 | 0,02 | 3.938 | -2,77 | ||||
| 2026-02-13 | 13F | AlTi Global, Inc. | 520.685 | -4,12 | 45.383 | -6,49 | ||||
| 2026-02-17 | 13F | Nearwater Capital Markets, Ltd | 110.000 | 0,00 | 9.588 | -2,47 | ||||
| 2026-01-20 | 13F | Princeton Global Asset Management LLC | 0 | -100,00 | 0 | -100,00 | ||||
| 2026-02-09 | 13F | Harbour Investments, Inc. | 12.167 | 113,31 | 1.060 | 108,25 | ||||
| 2026-02-13 | 13F | Smartleaf Asset Management LLC | 294 | -20,33 | 26 | -24,24 | ||||
| 2026-01-21 | 13F | Clayton Financial Group LLC | 100 | 9 | ||||||
| 2026-01-26 | 13F | Foster Victor Wealth Advisors, LLC | 2.880 | 253 | ||||||
| 2026-02-10 | 13F | Exit Wealth Advisors, LLC. | 0 | -100,00 | 0 | |||||
| 2026-02-13 | 13F | Karpus Management, Inc. | 155 | 14 | ||||||
| 2026-02-11 | 13F | T3 Companies, LLC | 2.450 | 214 | ||||||
| 2026-01-14 | 13F | Moisand Fitzgerald Tamayo, LLC | 0 | -100,00 | 0 | |||||
| 2026-02-05 | 13F | Tucker Asset Management Llc | 7.623 | 94,07 | 664 | 89,17 | ||||
| 2025-11-14 | 13F | Wolverine Trading, Llc | Call | 3.821.900 | -20,06 | 342.557 | -18,01 | |||
| 2026-02-17 | 13F | Old Mission Capital Llc | 218.285 | -80,95 | 19.026 | -81,43 | ||||
| 2025-11-14 | 13F | Wolverine Trading, Llc | 140.265 | 236,22 | 12.572 | 244,88 | ||||
| 2026-01-20 | 13F | Toth Financial Advisory Corp | 317 | -9,17 | 28 | -12,90 | ||||
| 2026-01-27 | 13F | Regions Financial Corp | 5.413 | 19,81 | 472 | 16,87 | ||||
| 2025-10-17 | 13F | Warren Street Wealth Advisors, LLC | 0 | -100,00 | 0 | -100,00 | ||||
| 2026-01-20 | 13F | Nvwm, Llc | 14.700 | -1,28 | 1.281 | -3,68 | ||||
| 2026-02-02 | 13F | Horizon Investments, LLC | Put | 250.000 | 44 | |||||
| 2026-02-12 | 13F | Loomis Sayles & Co L P | 16.261 | 9.937,65 | 1.417 | 10.021,43 | ||||
| 2026-01-07 | 13F | Harbor Investment Advisory, Llc | 593 | 0,00 | 52 | -1,92 | ||||
| 2026-02-03 | 13F | RD Finance Ltd | 15.300 | -95,60 | 1 | -96,77 | ||||
| 2025-09-17 | NP | NWNAX - Nationwide Destination 2045 Fund Class A | 12.520 | 17,49 | 1.088 | 14,17 | ||||
| 2026-02-02 | 13F | Ashton Thomas Securities, Llc | 0 | -100,00 | 0 | |||||
| 2026-02-03 | 13F | Smith & Howard Wealth Management, LLC | Call | 32.000 | 3.029 | |||||
| 2026-01-29 | 13F | IMC-Chicago, LLC | 197.940 | 161,30 | 17.252 | 154,87 | ||||
| 2025-10-21 | 13F | Strait & Sound Wealth Management LLC | 0 | -100,00 | 0 | -100,00 | ||||
| 2025-10-27 | 13F | Belvedere Trading LLC | Call | 0 | -100,00 | 0 | ||||
| 2026-01-27 | 13F | TD Waterhouse Canada Inc. | 106.245 | -5,13 | 9.260 | -7,42 | ||||
| 2026-02-03 | 13F | Smith & Howard Wealth Management, LLC | Put | 11.500 | -43,90 | 1.084 | -43,98 | |||
| 2025-11-07 | 13F | Synovus Financial Corp | 4.664 | 13,92 | 417 | 15,51 | ||||
| 2026-02-10 | 13F | IFG Advisory, LLC | 5.628 | 491 | ||||||
| 2026-01-02 | 13F | Boltwood Capital Management | 19.064 | 8,41 | 1.662 | 5,73 | ||||
| 2026-02-17 | 13F | Modern Wealth Management, LLC | 31.199 | 5,67 | 2.719 | 3,07 | ||||
| 2026-02-23 | 13F | Revere Asset Management, Inc | 0 | -100,00 | 0 | |||||
| 2026-02-13 | 13F | Ubs Oconnor Llc | Call | 0 | -100,00 | 0 | -100,00 | |||
| 2026-02-09 | 13F | Interactive Financial Advisors | 79.010 | -1,40 | 6.887 | -3,84 | ||||
| 2025-11-10 | 13F | Waratah Capital Advisors Ltd. | Put | 0 | -100,00 | 0 | -100,00 | |||
| 2026-01-14 | 13F | Beacon Investment Advisory Services, Inc. | 0 | -100,00 | 0 | |||||
| 2026-02-24 | 13F | MidFirst Bank | 259 | 23 | ||||||
| 2026-02-13 | 13F | Rafferty Asset Management, LLC | 30.401.006 | -16,76 | 2.649.752 | -18,82 | ||||
| 2026-02-17 | 13F | Parallax Volatility Advisers, L.P. | 110.931 | -57,70 | 9.669 | -58,75 | ||||
| 2026-02-17 | 13F | Parallax Volatility Advisers, L.P. | Put | 200.100 | 219,65 | 17.441 | 211,76 | |||
| 2026-02-17 | 13F | Parallax Volatility Advisers, L.P. | Call | 1.077.500 | 2.773,33 | 93.915 | 2.702,57 | |||
| 2026-01-21 | 13F | MBA Advisors LLC | 21.533 | -3,95 | 1.877 | -6,34 | ||||
| 2026-02-03 | 13F | NewEdge Wealth, LLC | 11.275 | 5,93 | 983 | 3,81 | ||||
| 2026-01-13 | 13F | Mayflower Financial Advisors, LLC | 6.882 | 34,31 | 600 | 31,07 | ||||
| 2026-02-12 | 13F | Federated Hermes, Inc. | 55 | 5 | ||||||
| 2026-02-13 | 13F | Boreal Capital Management LLC | 0 | 45 | -54,64 | |||||
| 2025-11-12 | 13F | Aptus Capital Advisors, LLC | Call | 0 | -100,00 | 0 | -100,00 | |||
| 2026-01-27 | 13F | WealthCollab, LLC | 128 | 11 | ||||||
| 2025-09-17 | 13F/A | Bank Julius Baer & Co. Ltd, Zurich | 960 | -75,80 | 87 | -77,23 | ||||
| 2026-02-03 | 13F | Smith & Howard Wealth Management, LLC | 45.000 | 40,62 | 3.922 | 37,18 | ||||
| 2025-09-17 | NP | NWEBX - Nationwide Destination Retirement Fund Class R | 98.036 | 3,98 | 8.521 | 1,02 | ||||
| 2026-01-23 | 13F | Summit Financial Consulting LLC | 12.067 | -6,82 | 1.052 | -9,16 | ||||
| 2026-01-27 | 13F | Berger Financial Group, Inc | 3.753 | -19,79 | 327 | -21,77 | ||||
| 2026-02-06 | 13F | Pnc Financial Services Group, Inc. | 327.946 | -5,17 | 28.584 | -7,51 | ||||
| 2026-02-17 | 13F | EFG International AG | 13.154 | 1.147 | ||||||
| 2026-02-24 | 13F | Bell Investment Advisors, Inc | 430.551 | 3,71 | 37.527 | 1,15 | ||||
| 2026-02-04 | 13F | Liberty Wealth Management Llc | 14.638 | -5,48 | 1.276 | -7,81 | ||||
| 2026-01-16 | 13F | Crew Capital Management, Ltd. | 0 | -100,00 | 0 | |||||
| 2026-02-06 | 13F | Envestnet Portfolio Solutions, Inc. | 494.007 | 5,26 | 43.058 | 2,66 | ||||
| 2026-02-09 | 13F | Integrity Alliance, Llc. | 216.834 | 0,55 | 18.899 | -1,93 | ||||
| 2026-01-21 | 13F | Westfuller Advisors, LLC | 6.406 | -3,44 | 558 | -5,74 | ||||
| 2026-02-09 | 13F | Fisher Asset Management, LLC | 53.930 | -58,11 | 4.701 | -59,15 | ||||
| 2026-01-28 | 13F | West Michigan Advisors, Llc | 13.437 | 163,21 | 1.171 | 156,80 | ||||
| 2026-02-05 | 13F | RiverFront Investment Group, LLC | 17.438 | 13,22 | 1.520 | 10,39 | ||||
| 2026-02-13 | 13F | Sofos Investments, Inc. | 12 | 20,00 | 1 | |||||
| 2026-01-29 | 13F | Quest 10 Wealth Builders, Inc. | 2.298 | 22,10 | 200 | 19,05 | ||||
| 2025-10-31 | 13F | Baker Avenue Asset Management, LP | Put | 0 | -100,00 | 0 | ||||
| 2026-01-12 | 13F | Archer Investment Management, LLC | 44.911 | -27,39 | 3.914 | -29,18 | ||||
| 2026-01-14 | 13F | Eastern Bank | 329 | 51,61 | 29 | 47,37 | ||||
| 2026-02-17 | 13F | Prostatis Group LLC | 3.094 | -0,13 | 270 | -2,54 | ||||
| 2026-01-29 | 13F | Comerica Bank | 79.070 | -0,84 | 6.892 | -3,30 | ||||
| 2026-02-03 | 13F | Sequoia Financial Advisors, LLC | 3.532 | -0,48 | 308 | -3,15 | ||||
| 2026-01-14 | 13F | Tradewinds Capital Management, LLC | 140 | 0,00 | 12 | 0,00 | ||||
| 2026-02-12 | 13F | Keystone Financial Services | 5.998 | -5,56 | 523 | -7,94 | ||||
| 2026-01-22 | 13F | Glass Jacobson Investment Advisors llc | 625 | 1,63 | 54 | 0,00 | ||||
| 2026-01-23 | 13F | Smith, Moore & Co. | 3.106 | -3,12 | 271 | -5,59 | ||||
| 2025-11-14 | 13F | Wolverine Trading, Llc | Put | 2.723.700 | 7,24 | 244.125 | 9,99 | |||
| 2026-02-17 | 13F | Russell Investments Group, Ltd. | 122 | 121,82 | 11 | 150,00 | ||||
| 2026-02-17 | 13F | Warren Averett Asset Management, LLC | 27.666 | -2,65 | 2.411 | -5,04 | ||||
| 2026-02-05 | 13F | Thrivent Financial For Lutherans | 16.131 | 6,98 | 1 | 0,00 | ||||
| 2026-02-13 | 13F | Portfolio Resources Advisor Group, Inc. | 2.836 | 247 | ||||||
| 2026-02-17 | 13F | Lighthouse Investment Partners, LLC | 16.556 | 627,74 | 1.443 | 610,84 | ||||
| 2026-01-23 | 13F | Watershed Private Wealth Llc | 3.633 | 0,03 | 317 | -2,47 | ||||
| 2026-01-26 | 13F | PFG Investments, LLC | 29.594 | -7,50 | 2.579 | -9,79 | ||||
| 2026-02-12 | 13F | Founders Financial Alliance, LLC | 270 | -63,66 | 24 | -65,15 | ||||
| 2026-02-17 | 13F | Stokes Family Office, LLC | 4.824 | 37,59 | 420 | 34,19 | ||||
| 2026-01-20 | 13F | Austin Private Wealth, LLC | 2.336 | -58,93 | 204 | -60,04 | ||||
| 2026-02-17 | 13F | Wiley Bros.-aintree Capital, Llc | 183.889 | -14,24 | 16.034 | -16,25 | ||||
| 2026-02-17 | 13F | Nomura Holdings Inc | Put | 49.200 | -37,88 | 4.288 | -39,42 | |||
| 2026-02-19 | 13F | Birchwood Financial Partners, Inc. | 96 | 8 | ||||||
| 2026-02-13 | 13F | Southeast Asset Advisors Inc. | 0 | -100,00 | 0 | |||||
| 2026-02-18 | 13F | Caitlin John, LLC | 4.475 | 81,47 | 390 | 77,27 | ||||
| 2026-01-23 | 13F | Cantor Fitzgerald Investment Adviser L.p. | 208.294 | -4,12 | 18.155 | -6,49 | ||||
| 2026-02-02 | 13F | Aurora Private Wealth, Inc. | 33.685 | 6,17 | 3 | 0,00 | ||||
| 2026-02-09 | 13F | Morris Financial Concepts, Inc. | 40 | 0,00 | 3 | 0,00 | ||||
| 2026-02-09 | 13F | Frazier Financial Advisors, LLC | 153 | 0,00 | 13 | 0,00 | ||||
| 2026-02-12 | 13F | Kovack Advisors, Inc. | 22.557 | 599,23 | 586 | 103,13 | ||||
| 2026-01-22 | 13F | Personal Cfo Solutions, Llc | 6.136 | -1,02 | 535 | -3,61 | ||||
| 2026-02-13 | 13F | Banco Santander, S.A. | 53.830 | -2,79 | 4.692 | -5,21 | ||||
| 2025-11-12 | 13F | Northstar Financial Companies, Inc. | 0 | -100,00 | 0 | |||||
| 2026-01-09 | 13F | SG Americas Securities, LLC | 125.052 | 225,12 | 11 | 233,33 | ||||
| 2026-02-03 | 13F | Maxi Investments CY Ltd | 172.000 | -38,78 | 15 | -44,00 | ||||
| 2025-12-09 | 13F | Painted Porch Advisors LLC | 73 | 0,00 | 7 | 0,00 | ||||
| 2026-01-09 | 13F | Affinity Capital Advisors, LLC | 23.748 | 49,06 | 2.070 | 45,09 | ||||
| 2026-01-22 | 13F | Yoder Wealth Management, Inc. | 29.427 | -1,47 | 2.565 | -3,93 | ||||
| 2026-02-17 | 13F | Optiver Holding B.V. | 333.760 | -23,53 | 29.091 | -25,42 | ||||
| 2026-01-28 | 13F | Cadinha & Co Llc | 28.267 | -1,08 | 2.464 | -3,53 | ||||
| 2026-02-20 | 13F | Sunbelt Securities, Inc. | 13.063 | -1,94 | 1.139 | -4,37 | ||||
| 2026-02-03 | 13F | Rezny Wealth Management, Inc. | 7.377 | -4,12 | ||||||
| 2026-01-20 | 13F | Independence Bank of Kentucky | 63 | 0,00 | 5 | 0,00 | ||||
| 2026-02-17 | 13F | Snowden Capital Advisors LLC | 10.894 | -35,15 | 950 | -36,78 | ||||
| 2026-02-11 | 13F | Janney Montgomery Scott LLC | 1.470.307 | 0,23 | 128 | -2,29 | ||||
| 2026-01-29 | 13F | D.a. Davidson & Co. | 11.523 | -12,99 | 1.004 | -15,13 | ||||
| 2026-02-13 | 13F | Voya Financial Advisors, Inc. | 23.756 | 37,43 | 2.092 | 35,05 | ||||
| 2026-02-17 | 13F | Bank Of America Corp /de/ | 109.057.503 | 10,47 | 9.505.452 | 7,74 | ||||
| 2026-01-27 | 13F | Leisure Capital Management | 8.575 | -8,66 | 747 | -10,97 | ||||
| 2026-01-26 | 13F | Quadrant Private Wealth Management, LLC | 125.916 | 0,18 | 10.975 | -2,30 | ||||
| 2026-01-14 | 13F | Goelzer Investment Management, Inc. | 16.639 | 1,42 | 1.450 | -1,09 | ||||
| 2026-01-06 | 13F | Nelson, Van Denburg & Campbell Wealth Management Group, LLC | 3.762 | 35,91 | 328 | 32,39 | ||||
| 2026-01-13 | 13F | Matrix Trust Co | 14.419 | 0,00 | 1 | 0,00 | ||||
| 2026-02-13 | 13F | Colony Group, LLC | 104.903 | -20,17 | 9.150 | -22,08 | ||||
| 2026-01-27 | 13F | Osborne Partners Capital Management, Llc | 218.530 | 0,13 | 19.047 | -2,34 | ||||
| 2026-02-02 | 13F | Syntax Research, Inc. | 6.703 | -74,49 | 584 | -75,13 | ||||
| 2025-11-20 | 13F | Maven Securities LTD | 0 | -100,00 | 0 | |||||
| 2026-02-13 | 13F | Soros Fund Management Llc | Call | 0 | -100,00 | 0 | -100,00 | |||
| 2026-02-12 | 13F | StoneX Group Inc. | 10.447 | 190,92 | 911 | 184,38 | ||||
| 2026-02-17 | 13F | Shay Capital LLC | Call | 54.400 | 88,24 | 4.742 | 83,62 | |||
| 2026-02-17 | 13F | Shay Capital LLC | Put | 55.000 | 4.794 | |||||
| 2026-02-17 | 13F | Shay Capital LLC | 18.716 | 3,44 | 1.631 | 0,87 | ||||
| 2026-02-06 | 13F | Mach-1 Financial Group, Inc. | 0 | -100,00 | 0 | |||||
| 2026-01-06 | 13F | Arlington Capital Management, Inc. | 98.831 | 1,04 | 8.614 | -1,45 | ||||
| 2026-02-17 | 13F | LMR Partners LLP | 0 | -100,00 | 0 | |||||
| 2026-02-11 | 13F | West Family Investments, Inc. | 133.337 | 8,93 | 14.929 | 8,20 | ||||
| 2026-02-03 | 13F | Security Benefit Life Insurance Co /ks/ | 110.000 | 0,00 | 9.588 | -2,47 | ||||
| 2026-01-30 | 13F | Simplicity Wealth,LLC | 242.894 | 8,84 | 21.171 | 6,15 | ||||
| 2026-02-13 | 13F | Kilter Group LLC | 1 | -99,75 | 0 | -100,00 | ||||
| 2026-02-11 | 13F | Summer Road Llc | 170 | 0,00 | 15 | -6,67 | ||||
| 2026-01-14 | 13F | International Private Wealth Advisors LLC | 53.682 | -1,83 | 4.679 | -4,26 | ||||
| 2026-02-17 | 13F | High Falls Advisors, Inc | 9.399 | 226,81 | 819 | 218,68 | ||||
| 2026-01-20 | 13F | Wealth Management Associates, Inc. | 139.375 | 8,07 | 12.148 | 5,40 | ||||
| 2026-02-13 | 13F | Cordoba Advisory Partners LLC | 84.783 | 7.390 | ||||||
| 2026-02-13 | 13F | MAI Capital Management | 18.505 | -26,20 | 1.613 | -28,04 | ||||
| 2026-01-20 | 13F | Savvy Advisors, Inc. | 16.946 | 72,83 | 1.477 | 68,61 | ||||
| 2026-02-18 | 13F | Hanlon Investment Management, Inc. | 13.260 | -3,96 | 1.156 | -6,33 | ||||
| 2026-01-23 | 13F | Bellevue Asset Management, Llc | 71 | 1,43 | 6 | 0,00 | ||||
| 2026-02-11 | 13F | Picton Mahoney Asset Management | 10.000 | 0,00 | 872 | |||||
| 2026-02-13 | 13F | Walleye Trading LLC | 47.857 | 315,64 | 4.171 | 305,34 | ||||
| 2026-01-09 | 13F | Aurelius Family Office LLC | 6.835 | -3,08 | 598 | -5,24 | ||||
| 2026-02-13 | 13F | Walleye Trading LLC | Put | 305.100 | 69,31 | 26.593 | 65,13 | |||
| 2026-02-13 | 13F | Walleye Trading LLC | Call | 283.000 | 19,06 | 24.666 | 16,11 | |||
| 2026-02-17 | 13F | Ibex Wealth Advisors | 10.737 | 0,00 | 936 | -2,50 | ||||
| 2025-09-26 | NP | MAPP - Harbor Multi-Asset Explorer ETF | 2.498 | -29,34 | 217 | -31,33 | ||||
| 2026-02-17 | 13F | Integrated Advisors Network LLC | 23.577 | -6,87 | 2.055 | -9,20 | ||||
| 2026-02-17 | 13F | ExodusPoint Capital Management, LP | Call | 0 | -100,00 | 0 | -100,00 | |||
| 2026-02-02 | 13F | CENTRAL TRUST Co | 3.032 | 0,00 | 264 | -2,22 | ||||
| 2026-01-28 | 13F | Old National Bancorp /in/ | 292.158 | -3,30 | 25.464 | -5,69 | ||||
| 2026-02-13 | 13F | Bluedoor Private Wealth, Llc | 6.200 | 540 | ||||||
| 2026-02-10 | 13F | Operose Advisors LLC | 0 | -100,00 | 0 | |||||
| 2026-02-11 | 13F | Bck Capital Management Lp | Call | 0 | -100,00 | 0 | ||||
| 2026-02-13 | 13F | Level Four Advisory Services, Llc | 25.996 | 60,65 | 2.266 | 56,64 | ||||
| 2026-02-17 | 13F | Lazard Asset Management Llc | 39.527 | -4,13 | 3.445 | -6,49 | ||||
| 2026-02-03 | 13F | Detalus Advisors, LLC | 8.641 | 11,42 | 753 | 8,66 | ||||
| 2026-02-17 | 13F | Two Sigma Securities, Llc | 80.068 | 2.622,48 | 6.979 | 2.563,36 | ||||
| 2026-01-26 | 13F | Townsend & Associates, Inc | 509.184 | 1,45 | 44.966 | -1,76 | ||||
| 2026-01-12 | 13F | Robinson Value Management, Ltd. | 41.986 | -1,24 | 3.660 | -3,69 | ||||
| 2026-02-17 | 13F | Old Mission Capital Llc | Call | 6.631.500 | -2,02 | 2.574 | -64,06 | |||
| 2026-01-20 | 13F | Ethos Financial Group, LLC | 85.763 | 2.880,99 | 7.475 | 2.808,56 | ||||
| 2026-01-22 | 13F | Intergy Private Wealth, LLC | 39.171 | 2,41 | 3.414 | -0,12 | ||||
| 2026-02-13 | 13F | Polymer Capital Management (HK) LTD | 10.294 | 0,00 | 897 | -2,39 | ||||
| 2026-01-28 | 13F | United Asset Strategies, Inc. | 10.272 | -9,35 | 895 | -11,56 | ||||
| 2026-01-13 | 13F | Stableford Capital Ii Llc | 0 | -100,00 | 0 | |||||
| 2026-02-17 | 13F | Old Mission Capital Llc | Put | 4.014.200 | -19,70 | 3.721 | -42,65 | |||
| 2026-01-28 | 13F | Clarity Financial LLC | 136.223 | 0,88 | 11.873 | -1,62 | ||||
| 2026-01-23 | 13F | Stonehaven Wealth & Tax Solutions, Llc | 36.189 | 25,49 | 3.154 | 22,39 | ||||
| 2026-01-26 | 13F | Chicago Capital, LLC | 3.800 | 0,00 | 331 | -2,36 | ||||
| 2026-02-12 | 13F | BRYN MAWR TRUST Co | 40.000 | 0,00 | 3.486 | -2,46 | ||||
| 2026-02-13 | 13F | Fifth Lane Capital, Lp | Call | 30.000 | 2.615 | |||||
| 2025-11-12 | 13F | Kaizen Financial Strategies | 0 | -100,00 | 0 | -100,00 | ||||
| 2026-02-13 | 13F | Wells Fargo & Company/mn | Put | 1.700 | -99,42 | 148 | -99,43 | |||
| 2026-02-13 | 13F | Wells Fargo & Company/mn | Call | 751.700 | 275,85 | 65.518 | 266,55 | |||
| 2026-02-13 | 13F/A | Militia Capital Partners, LP | 0 | -100,00 | 0 | -100,00 | ||||
| 2026-02-09 | 13F | Huntington National Bank | 7.109 | -0,59 | ||||||
| 2026-01-08 | 13F | Centerline Wealth Advisors, LLC | 12.001 | -83,78 | 1.046 | -84,19 | ||||
| 2026-01-06 | 13F | Unique Wealth, Llc | 2.815 | 3,53 | 245 | 1,24 | ||||
| 2026-02-13 | 13F | Invictus Private Wealth, Llc | 0 | -100,00 | 0 | |||||
| 2026-01-23 | 13F | Tectonic Advisors Llc | 17.784 | -0,99 | 1.550 | -3,43 | ||||
| 2026-02-17 | 13F | Cahill Financial Advisors Inc | 4.191 | 13,12 | 365 | 10,27 | ||||
| 2026-01-15 | 13F | Royal Fund Management, LLC | 200.427 | -42,01 | 17.470 | -43,45 | ||||
| 2026-02-02 | 13F | Nkcfo Llc | 6.000 | 0,00 | 1 | |||||
| 2025-09-23 | NP | MDAKX - MainStay Moderate ETF Allocation Fund Class C | 35.393 | -26,12 | 3.076 | -28,23 | ||||
| 2026-02-17 | 13F | Mercer Global Advisors Inc /adv | 117.080 | -9,62 | 10.074 | -11,97 | ||||
| 2026-02-06 | 13F | Evoke Wealth, Llc | Call | 0 | -100,00 | 0 | -100,00 | |||
| 2026-01-21 | 13F | Canton Hathaway, LLC | 489 | 12,16 | 43 | 7,69 | ||||
| 2026-01-16 | 13F | Matauro, Llc | 43.073 | 3.754 | ||||||
| 2026-02-03 | 13F | Pilgrim Partners Asia Pte Ltd | 31.640 | -8,40 | 2.758 | -10,66 | ||||
| 2026-02-10 | 13F | Root Financial Partners, LLC | 0 | -100,00 | 0 | |||||
| 2026-02-17 | 13F | Parkwood LLC | Call | 300.000 | 0,00 | 26 | 0,00 | |||
| 2026-01-22 | 13F | Financial Consulate, Inc | 506 | 25.200,00 | 44 | |||||
| 2026-02-12 | 13F | McMillan Office, Inc. | 65 | 6 | ||||||
| 2025-10-09 | 13F | Astoria Portfolio Advisors LLC. | 0 | -100,00 | 0 | -100,00 | ||||
| 2026-02-04 | 13F | Nwam Llc | 8.260 | 15,59 | 729 | 11,81 | ||||
| 2026-02-17 | 13F | Core Wealth Advisors, Inc. | 9.108 | 50,84 | 794 | 47,12 | ||||
| 2026-02-17 | 13F | Tudor Investment Corp Et Al | 124.213 | -52,80 | 10.826 | -53,97 | ||||
| 2025-10-30 | 13F | Tranquilli Financial Advisor LLC | 0 | -100,00 | 0 | -100,00 | ||||
| 2026-01-21 | 13F | SJS Investment Consulting Inc. | 33 | 3 | ||||||
| 2025-11-12 | 13F | Twin Focus Capital Partners, Llc | 0 | -100,00 | 0 | -100,00 | ||||
| 2025-11-18 | 13F | Pictet Asset Management Holding SA | 0 | -100,00 | 0 | -100,00 | ||||
| 2026-01-09 | 13F | BOS Asset Management, LLC | 208.544 | -3,04 | 18.177 | -5,44 | ||||
| 2026-02-17 | 13F | Tudor Investment Corp Et Al | Put | 12.000 | 1.046 | |||||
| 2025-10-28 | 13F/A | Kingstone Capital Partners Texas, LLC | 0 | -100,00 | 0 | -100,00 | ||||
| 2026-02-17 | 13F | Tudor Investment Corp Et Al | Call | 54.000 | 28,57 | 4.707 | 25,39 | |||
| 2026-02-17 | 13F | Northern Trust Corp | 227.048 | 5,16 | 19.790 | 2,56 | ||||
| 2026-02-17 | 13F | Fmr Llc | 12.140 | 7,42 | 1.058 | 4,86 | ||||
| 2026-02-11 | 13F | Swan Global Investments, LLC | 3.300 | 37,50 | 288 | 34,11 | ||||
| 2026-02-17 | 13F | Css Llc/il | Call | 44.000 | 10,00 | 3.835 | 7,30 | |||
| 2026-02-06 | 13F | Evoke Wealth, Llc | Put | 0 | -100,00 | 0 | -100,00 | |||
| 2026-02-05 | 13F | Everstar Asset Management, LLC | 0 | -100,00 | 0 | |||||
| 2026-02-17 | 13F | Credit Agricole S A | 117.062 | 5,27 | 10.203 | 2,68 | ||||
| 2026-01-21 | 13F | Sowell Financial Services LLC | 76.793 | 7,44 | 6.693 | 4,79 | ||||
| 2026-02-14 | 13F | Howe & Rusling Inc | 4.385 | 10,37 | 382 | 7,61 | ||||
| 2026-02-11 | 13F | Alethea Capital Management, Llc | 23.123 | 0,00 | 2.015 | -2,47 | ||||
| 2026-02-18 | 13F | Beacon Pointe Advisors, LLC | Put | 0 | -100,00 | 0 | ||||
| 2025-11-12 | 13F | Simplex Trading, Llc | 0 | -100,00 | 0 | |||||
| 2026-02-12 | 13F | Commonwealth Equity Services, Llc | 929.344 | -39,92 | 81.002 | 58.596,38 | ||||
| 2025-12-17 | 13F | Alternative Investment Advisors, LLC. | 0 | -100,00 | 0 | |||||
| 2026-01-30 | 13F | State of New Jersey Common Pension Fund D | 15.000 | 0,00 | 1.307 | -2,46 | ||||
| 2026-02-12 | 13F | Miller Financial Services LLC | 40.920 | 14,55 | 3.567 | 11,72 | ||||
| 2026-02-17 | 13F | Creative Planning | 32.272 | -60,73 | 2.813 | -61,71 | ||||
| 2026-02-02 | 13F | Robertson Stephens Wealth Management, LLC | 12.930 | 290,40 | 1.127 | 280,74 | ||||
| 2026-02-18 | 13F | EP Wealth Advisors, Inc. | 6.974 | 2,72 | 608 | 1,34 | ||||
| 2026-02-06 | 13F | Vestmark Advisory Solutions, Inc. | 271.938 | 58,93 | 23.702 | 55,01 | ||||
| 2025-09-17 | NP | NWMAX - Nationwide Destination 2040 Fund Class A | 24.614 | 11,04 | 2.139 | 7,87 | ||||
| 2026-02-10 | 13F | CFS Investment Advisory Services, LLC | 17.416 | -1,55 | 1.518 | -6,24 | ||||
| 2025-11-06 | 13F | Navellier & Associates Inc | 0 | -100,00 | 0 | -100,00 | ||||
| 2026-02-03 | 13F | D.B. Root & Company, LLC | 3.877 | -43,62 | 338 | -45,11 | ||||
| 2026-02-17 | 13F | Cardiff Park Advisors, Llc | 0 | -100,00 | 0 | |||||
| 2026-02-17 | 13F | Jump Financial, LLC | 1.157.021 | 50.668,80 | 100.846 | 49.577,34 | ||||
| 2026-02-12 | 13F | Ankerstar Wealth, LLC | 21 | 2 | ||||||
| 2026-02-12 | 13F | Insigneo Advisory Services, Llc | 32.160 | -38,31 | 2.803 | -39,82 | ||||
| 2026-02-13 | 13F | Avid Wealth Partners LLC | 5.997 | -21,23 | 523 | -23,24 | ||||
| 2026-01-29 | 13F | Dunhill Financial, LLC | 776 | 1,31 | ||||||
| 2026-02-13 | 13F | TFB Advisors LLC | 12.567 | 2,07 | 1.095 | -2,06 | ||||
| 2026-01-12 | 13F | VisionPoint Advisory Group, LLC | 4.464 | -5,36 | 389 | -7,60 | ||||
| 2026-02-17 | 13F | Northeast Financial Group, Inc. | 96.063 | 6,48 | 8.377 | 3,86 | ||||
| 2026-02-17 | 13F | Main Street Financial Solutions, LLC | 5.010 | -31,76 | 437 | -33,54 | ||||
| 2026-02-26 | 13F | Anchor Investment Management, LLC | 47 | 2,17 | 4 | 0,00 | ||||
| 2026-01-20 | 13F | Stratos Wealth Partners, LTD. | 108.262 | -3,67 | 9.436 | -6,04 | ||||
| 2026-02-10 | 13F | Moors & Cabot, Inc. | 11.174 | 2,70 | 974 | 0,10 | ||||
| 2026-01-20 | 13F | J2 Capital Management Inc | 7.720 | 5,09 | 673 | 2,44 | ||||
| 2026-02-13 | 13F | Ausdal Financial Partners, Inc. | 13.470 | 31,72 | 1.174 | 28,59 | ||||
| 2026-01-14 | 13F | Emergent Wealth Advisors, LLC | 11.715 | -10,96 | 1.021 | -13,11 | ||||
| 2026-02-13 | 13F | National Bank Of Canada /fi/ | 788.441 | 310,26 | 68.719 | 300,08 | ||||
| 2026-01-30 | 13F | Strategic Blueprint, LLC | 23.168 | 9,17 | 2.019 | 6,49 | ||||
| 2026-01-30 | 13F | Strategic Blueprint, LLC | Call | 5.000 | 436 | |||||
| 2026-01-05 | 13F | GK Wealth Management LLC | 5.882 | 4,61 | 513 | 1,99 | ||||
| 2025-10-20 | 13F | Calamos Advisors LLC | Put | 0 | -100,00 | 0 | ||||
| 2026-02-13 | 13F | Toroso Investments, LLC | Put | 1.500.000 | 3.348,28 | 130.740 | 3.275,68 | |||
| 2026-02-18 | 13F | GWM Advisors LLC | 0 | -100,00 | 0 | |||||
| 2026-02-27 | 13F | Strategic Investment Solutions, Inc. /IL | 2.058 | -48,73 | 179 | -50,00 | ||||
| 2026-02-17 | 13F | Keebeck Wealth Management, LLC | 11.838 | 43,86 | 1.032 | 40,27 | ||||
| 2026-02-04 | 13F | Oxbow Advisors, LLC | 2.860 | 0,00 | 249 | -2,35 | ||||
| 2026-01-08 | 13F | Occidental Asset Management, LLC | 171.875 | 4,32 | 14.981 | 1,74 | ||||
| 2026-01-16 | 13F | Surience Private Wealth Llc | 0 | -100,00 | 0 | |||||
| 2026-01-27 | 13F | Lodestar Private Asset Management Llc | 10.956 | -0,46 | 955 | -2,95 | ||||
| 2026-02-17 | 13F | Eddie Patel Inc | 143.077 | 12.471 | ||||||
| 2026-02-17 | 13F | Risk Paradigm Group, LLC | 22.659 | 7.003,13 | 1.975 | 5.094,74 | ||||
| 2026-02-02 | 13F | Avidian Wealth Solutions, LLC | 6.999 | -15,30 | 610 | -17,34 | ||||
| 2026-02-13 | 13F | Fairfield, Bush & Co. | 7.769 | -10,89 | 677 | -13,09 | ||||
| 2026-02-02 | 13F | Advanced Asset Management Advisors Inc | 75 | 50,00 | 7 | 50,00 | ||||
| 2026-01-28 | 13F | Accretive Wealth Partners, LLC | 5.998 | -4,25 | 523 | -6,62 | ||||
| 2025-09-17 | NP | NADCX - Nationwide Investor Destinations Moderately Conservative Fund Class A | 37.253 | -63,73 | 3.238 | -64,76 | ||||
| 2026-01-14 | 13F | Nova Wealth Management, Inc. | 49 | 145,00 | 4 | 300,00 | ||||
| 2026-02-03 | 13F | SBI Securities Co., Ltd. | 309.137 | -0,42 | 26.944 | -2,88 | ||||
| 2026-02-06 | 13F | Americana Partners, LLC | 99.530 | 23,09 | 8.675 | 20,05 | ||||
| 2026-01-26 | 13F | Milestones Private Investment Advisors LLC | 47.983 | -12,29 | 4.182 | -14,44 | ||||
| 2026-02-12 | 13F | Keel Point, LLC | 21.165 | 1,10 | 1.845 | -1,44 | ||||
| 2026-01-21 | 13F | Newbridge Financial Services Group, Inc. | 3.086 | 20,17 | 269 | 17,47 | ||||
| 2026-02-13 | 13F | Northwest Bancshares, Inc. | 0 | -100,00 | 0 | |||||
| 2026-01-22 | 13F | Willis Johnson & Associates, Inc. | 267.934 | 13,51 | 23.353 | 10,70 | ||||
| 2026-01-14 | 13F | Exchange Traded Concepts, Llc | 0 | -100,00 | 0 | -100,00 | ||||
| 2026-02-13 | 13F | Toroso Investments, LLC | Call | 40.000 | -8,05 | 3.486 | -9,99 | |||
| 2026-01-26 | 13F | Spectrum Asset Management, Inc. (NB/CA) | 8.370 | 0,00 | 730 | -2,54 | ||||
| 2026-01-28 | 13F | Migdal Insurance & Financial Holdings Ltd. | 7.600 | -16,17 | 1 | |||||
| 2026-02-12 | 13F | IFC & Insurance Marketing, Inc. | 26 | 0 | ||||||
| 2025-11-13 | 13F | Promus Capital, LLC | 414 | -96,34 | 37 | -96,29 | ||||
| 2026-02-17 | 13F | Hunting Hill Global Capital, LLC | 1.867 | 163 | ||||||
| 2026-02-10 | 13F | Intellectus Partners, LLC | 3.051 | 0,23 | 266 | -2,57 | ||||
| 2026-01-21 | 13F | Prime Capital Investment Advisors, LLC | Call | 0 | -100,00 | 0 | -100,00 | |||
| 2026-02-04 | 13F | Tsfg, Llc | 385 | -39,08 | 0 | |||||
| 2026-02-13 | 13F | Towarzystwo Funduszy Inwestycyjnych Pzu Sa | 0 | -100,00 | 0 | |||||
| 2026-02-05 | 13F | AlphaCore Capital LLC | 3.398 | 10.196,97 | 296 | 14.700,00 | ||||
| 2026-02-17 | 13F | Hunting Hill Global Capital, LLC | Call | 17.600 | -46,01 | 1.534 | -47,34 | |||
| 2026-02-13 | 13F | Toroso Investments, LLC | 753.846 | 1.105,48 | 65.705 | 1.079,83 | ||||
| 2026-02-02 | 13F | Chung Wu Investment Group, LLC | 0 | -100,00 | 0 | |||||
| 2026-02-13 | 13F | Neuberger Berman Group LLC | 43.397 | -48,54 | 3.782 | -49,81 | ||||
| 2026-02-06 | 13F/A | Rathbone Brothers plc | 2.550 | -31,45 | 222 | -33,13 | ||||
| 2026-02-17 | 13F | Coastal Bridge Advisors, LLC | 34.910 | -5,88 | 3.043 | -8,21 | ||||
| 2026-02-09 | 13F | Cary Street Partners Financial Llc | 7.925 | -20,77 | 691 | -22,73 | ||||
| 2026-02-25 | 13F | Tempo Wealth, LLC | 20.765 | 1.810 | ||||||
| 2026-02-10 | 13F | Godfrey Financial Associates, Inc. | 80 | 7 | ||||||
| 2026-02-13 | 13F | Arete Wealth Advisors, LLC | 26.674 | 2,20 | 2 | 0,00 | ||||
| 2026-01-22 | 13F | Venturi Wealth Management, LLC | 2.440 | -4,16 | 213 | -6,61 | ||||
| 2025-11-14 | 13F | Full Sail Capital, LLC | 87.944 | -5,94 | 7.860 | -4,75 | ||||
| 2026-02-12 | 13F | Sumitomo Mitsui Financial Group, Inc. | 300.063 | -7,53 | 26.153 | -9,82 | ||||
| 2026-02-03 | 13F | Apeiron RIA LLC | 25.964 | 2.259 | ||||||
| 2026-02-17 | 13F | Safe Harbor Fiduciary, LLC | 198 | -99,31 | 17 | -99,33 | ||||
| 2025-11-14 | 13F | Elequin Capital Lp | 0 | -100,00 | 0 | |||||
| 2026-01-26 | 13F | Second Half Financial Partners, LLC | 5.234 | -27,99 | 456 | -29,74 | ||||
| 2026-02-02 | 13F | Sachetta, LLC | 85 | 7 | ||||||
| 2026-02-04 | 13F | BEAM Asset Management, LLC | 16.732 | 5,54 | 1.458 | 2,97 | ||||
| 2026-01-20 | 13F | SHEPHERD WEALTH MANAGEMENT Ltd LIABILITY Co | 8.575 | -2,82 | 753 | -4,20 | ||||
| 2026-02-03 | 13F | Koshinski Asset Management, Inc. | 12.931 | 7,26 | 1.127 | 4,64 | ||||
| 2026-02-11 | 13F | Empowered Funds, LLC | 0 | -100,00 | 0 | |||||
| 2026-01-28 | 13F | FORM Wealth Advisors, LLC | 146.677 | -1,39 | 12.784 | -2,61 | ||||
| 2026-02-04 | 13F | Ameritas Advisory Services, LLC | 17.707 | 66,80 | 1.543 | 62,76 | ||||
| 2026-02-04 | 13F | Ground Swell Capital, LLC | 12.175 | 1.061 | ||||||
| 2026-02-13 | 13F | Palisade Asset Management, LLC | 0 | -100,00 | 0 | |||||
| 2026-01-14 | 13F | Sjbenen Advisory, Llc | 97.200 | 2.807 | ||||||
| 2026-02-03 | 13F | Morse Asset Management, Inc | 15.093 | -12,72 | 1.316 | -14,89 | ||||
| 2025-11-12 | 13F | PKS Advisory Services, LLC | 0 | -100,00 | 0 | -100,00 | ||||
| 2026-01-08 | 13F | Versant Capital Management, Inc | 46 | 0,00 | 4 | 0,00 | ||||
| 2026-01-14 | 13F | Sjbenen Advisory, Llc | Put | 5.600 | 488 | |||||
| 2026-02-17 | 13F | Polar Asset Management Partners Inc. | Put | 0 | -100,00 | 0 | ||||
| 2026-02-05 | 13F | High Note Wealth, LLC | 120.952 | 8,68 | 10.542 | 5,99 | ||||
| 2026-02-10 | 13F | Lido Advisors, LLC | 212.385 | 0,90 | 18.744 | -0,36 | ||||
| 2026-01-30 | 13F | Us Bancorp \de\ | 921.383 | 1,35 | 80.321 | -1,15 | ||||
| 2026-02-06 | 13F | Keystone Financial Group | 5.902 | -15,05 | 514 | -17,10 | ||||
| 2026-01-20 | 13F | Investment Planning Advisors, Inc. | 3.485 | 4,53 | 304 | 2,02 | ||||
| 2026-02-06 | 13F | IFP Advisors, Inc | 480.682 | 282,17 | 41.896 | 272,74 | ||||
| 2026-01-26 | 13F | Valmark Advisers, Inc. | 4.159 | 18,63 | 362 | 15,65 | ||||
| 2026-02-11 | 13F | Real Talk Capital, LLC | 12.881 | 3,32 | 1.123 | 0,72 | ||||
| 2026-01-21 | 13F | Modera Wealth Management, LLC | 0 | -100,00 | 0 | |||||
| 2026-02-09 | 13F | Arrow Investment Advisors, LLC | 14.474 | -2,50 | 1.262 | -4,90 | ||||
| 2026-02-05 | 13F | WealthPlan Investment Management, LLC | 22.411 | -3,39 | 1.953 | -5,79 | ||||
| 2026-02-05 | 13F | Atria Investments Llc | 134.667 | -7,70 | 11.738 | -9,98 | ||||
| 2026-01-20 | 13F | Thurston, Springer, Miller, Herd & Titak, Inc. | 10 | 1 | ||||||
| 2026-01-28 | 13F | Barrett & Company, Inc. | 286 | 0,00 | 25 | -4,00 | ||||
| 2026-01-27 | 13F | Friedenthal Financial | 3.756 | 3,87 | 327 | 1,24 | ||||
| 2026-02-13 | 13F | Healthcare Of Ontario Pension Plan Trust Fund | 100 | 0,00 | 9 | 0,00 | ||||
| 2026-01-20 | 13F | Signaturefd, Llc | 801 | 6,52 | 70 | 2,99 | ||||
| 2026-02-17 | 13F | Moore Capital Management, Lp | Put | 2.650.000 | 230.974 | |||||
| 2025-11-21 | 13F/A | CIBC Bancorp USA Inc. | 14.950 | 1.336 | ||||||
| 2026-02-11 | 13F | Signet Private Wealth LLC | 21.306 | 1.857 | ||||||
| 2026-02-13 | 13F | Pinnacle Wealth Planning Services, Inc. | 2.698 | -9,07 | 235 | -11,32 | ||||
| 2026-02-04 | 13F | Valeo Financial Advisors, LLC | 0 | -100,00 | 0 | |||||
| 2026-01-23 | 13F | Assetmark, Inc | 1.430.487 | -12,14 | 124.681 | -14,32 | ||||
| 2026-02-09 | 13F | Fidelis Capital Partners, LLC | 16.860 | 1.469 | ||||||
| 2026-02-10 | 13F | Founders Financial Securities Llc | 4.876 | 425 | ||||||
| 2025-11-10 | 13F | Ameritas Investment Partners, Inc. | 0 | -100,00 | 0 | -100,00 | ||||
| 2026-01-07 | 13F | Retirement Wealth Solutions LLC | 60 | 1.900,00 | 5 | |||||
| 2026-02-06 | 13F | Forefront Wealth Partners, LLC | 0 | -100,00 | 0 | -100,00 | ||||
| 2026-02-17 | 13F | Moore Capital Management, Lp | Call | 3.250.000 | 225,00 | 283.270 | 216,96 | |||
| 2026-01-14 | 13F | CPR Investments Inc. | 76.780 | 164,40 | 6.692 | 157,88 | ||||
| 2026-02-04 | 13F | Fourth Dimension Wealth, LLC | 1.111 | -21,98 | 97 | -24,41 | ||||
| 2026-02-13 | 13F | Healthcare Of Ontario Pension Plan Trust Fund | Put | 125.000 | 10.895 | |||||
| 2026-02-13 | 13F | Healthcare Of Ontario Pension Plan Trust Fund | Call | 225.000 | -55,00 | 19.611 | -56,11 | |||
| 2026-02-11 | 13F | Dearborn Partners Llc | 2.500 | 0,00 | 218 | -2,69 | ||||
| 2026-01-06 | 13F | Afg Fiduciary Services Limited Partnership | 53.325 | -23,96 | 4.641 | -25,90 | ||||
| 2026-02-13 | 13F | Financial Network Wealth Advisors LLC | 813 | 0,12 | 71 | -2,78 | ||||
| 2026-02-12 | 13F | Rossby Financial, LCC | 878 | 7,47 | 77 | 5,56 | ||||
| 2025-10-31 | 13F | Mendel Capital Management LLC | 2.903 | 0,38 | 259 | 1,57 | ||||
| 2026-02-11 | 13F | Peachtree Investment Partners, LLC | 200 | 17 | ||||||
| 2026-02-06 | 13F | Covestor Ltd | 5 | 0,00 | 0 | |||||
| 2026-01-12 | 13F | Focus Financial Network, Inc. | 5.921 | -25,76 | 516 | -27,53 | ||||
| 2026-02-04 | 13F | Hirtle Callaghan & Co LLC | 1.637 | 5,27 | ||||||
| 2026-02-11 | 13F | Gordian Capital Singapore Pte Ltd | 1 | 0,00 | 0 | |||||
| 2026-02-17 | 13F | Cape Investment Advisory, Inc. | 136 | 0,00 | 12 | -8,33 | ||||
| 2026-02-17 | 13F | Fwl Investment Management, Llc | 1.200 | 92,00 | 105 | 89,09 | ||||
| 2026-01-30 | 13F | Kiker Wealth Management, LLC | 3.529 | -94,99 | 308 | -95,12 | ||||
| 2026-02-05 | 13F | Center for Financial Planning, Inc. | 58 | -88,40 | 5 | -88,64 | ||||
| 2026-02-04 | 13F | Midwest Heritage Bank, FSB | 42.670 | 6,48 | 3.719 | 3,85 | ||||
| 2026-02-10 | 13F | Acorn Wealth Advisors, LLC | 3.213 | 4,79 | 280 | 2,56 | ||||
| 2026-02-03 | 13F | RFG Advisory, LLC | 32.975 | 8,29 | 2.874 | 5,62 | ||||
| 2026-02-12 | 13F | Sun Life Financial Inc | 9.150 | 0,00 | 1 | |||||
| 2026-01-12 | 13F | Benin Management CORP | 53.408 | 4.655 | ||||||
| 2026-01-14 | 13F | Cypress Wealth Services, LLC | 3.955 | 25,08 | 345 | 21,99 | ||||
| 2026-02-17 | 13F | Jain Global LLC | Put | 1.462.300 | 63,50 | 127.454 | 59,45 | |||
| 2026-02-17 | 13F | Jain Global LLC | Call | 5.826.900 | 151,52 | 507.873 | 145,30 | |||
| 2026-02-03 | 13F | Cassaday & Co Wealth Management LLC | 30.132 | -0,06 | 2.626 | -2,52 | ||||
| 2025-11-12 | 13F | CMT Capital Markets Trading GmbH | 0 | -100,00 | 0 | |||||
| 2026-01-09 | 13F | Dynamic Advisor Solutions LLC | 32.092 | 17,21 | 1.926 | -21,33 | ||||
| 2026-02-17 | 13F | Raymond James Financial Inc | Put | 13.200 | 0,00 | 1.109 | 0,00 | |||
| 2026-02-17 | 13F | Raymond James Financial Inc | 2.353.066 | -7,35 | 205.093 | -9,64 | ||||
| 2026-02-13 | 13F | Edenbrook Capital, LLC | Call | 100.000 | 8.716 | |||||
| 2026-01-26 | 13F | Roman Butler Fullerton & Co | 13.725 | 129,40 | 1.204 | 121,14 | ||||
| 2025-10-17 | 13F | Legacy Advisory Services, LLC | 134.716 | 2,42 | 11.765 | -8,83 | ||||
| 2026-02-12 | 13F | Proficio Capital Partners LLC | 3.519 | 307 | ||||||
| 2025-11-14 | 13F/A | NorthRock Partners, LLC | 0 | -100,00 | 0 | |||||
| 2026-01-16 | 13F | West Branch Capital LLC | 209 | 1,46 | 18 | 0,00 | ||||
| 2026-02-02 | 13F | Alliance Wealth Advisors, LLC /UT | 9.508 | -38,35 | 829 | -39,91 | ||||
| 2026-02-03 | 13F | Legacy Wealth Managment, LLC/ID | 39 | -4,88 | 3 | 0,00 | ||||
| 2025-10-28 | 13F | Copperleaf Capital, LLC | 0 | -100,00 | 0 | -100,00 | ||||
| 2025-10-07 | 13F | Heritage Family Offices, LLP | 0 | -100,00 | 0 | -100,00 | ||||
| 2025-11-10 | 13F | Adviser Investments LLC | 0 | -100,00 | 0 | |||||
| 2026-02-13 | 13F | Resources Investment Advisors, LLC. | 352.643 | 7,81 | 30.736 | 5,15 | ||||
| 2026-02-12 | 13F | Tiemann Investment Advisors, Llc | 2.475 | -1,98 | 216 | -4,44 | ||||
| 2026-01-22 | 13F | HHM Wealth Advisors, LLC | 13 | 1 | ||||||
| 2026-02-11 | 13F | Entelevest, LLC | 3.043 | 265 | ||||||
| 2026-02-12 | 13F | CIBC Private Wealth Group, LLC | 16.253 | -23,52 | 1.417 | -25,43 | ||||
| 2026-02-17 | 13F | Ameriflex Group, Inc. | 91 | -62,70 | 8 | -66,67 | ||||
| 2026-02-18 | 13F/A | Virtue Capital Management, LLC | 37.992 | 28,66 | 3.306 | -23,12 | ||||
| 2026-02-12 | 13F | Hudock, Inc. | 2.855 | 1,24 | 249 | -1,59 | ||||
| 2026-02-13 | 13F | Winter & Associates, Inc. | 2.622 | 229 | ||||||
| 2026-02-13 | 13F | McAdam, LLC | 21.262 | -4,84 | 1.853 | -7,16 | ||||
| 2026-02-11 | 13F | X-Square Capital, LLC | 4.000 | 0,00 | 0 | |||||
| 2026-01-13 | 13F | Capital Investment Advisors, LLC | 3.926 | 1,76 | 342 | -0,58 | ||||
| 2026-01-26 | 13F | AE Wealth Management LLC | 228.142 | 14,94 | 19.885 | 12,10 | ||||
| 2026-01-22 | 13F | TSA Wealth Managment LLC | 3.921 | 36,81 | 342 | 33,20 | ||||
| 2026-02-09 | 13F | PSI Advisors, LLC | 70.913 | 4,14 | 6.181 | 1,56 | ||||
| 2026-02-02 | 13F | Peregrine Asset Advisers, Inc. | 36.057 | 37,60 | 3.143 | 34,22 | ||||
| 2026-01-15 | 13F | Highline Wealth Partners Llc | 450 | 0,00 | 39 | -2,50 | ||||
| 2026-02-12 | 13F | Mosley Wealth Management | 0 | -100,00 | 0 | |||||
| 2026-02-13 | 13F | Bank Of Nova Scotia | 95.087 | -36,79 | 8.276 | -38,44 | ||||
| 2026-02-06 | 13F | Kingdom Financial Group LLC. | 2.622 | 229 | ||||||
| 2026-02-10 | 13F | Cherry Tree Wealth Management, LLC | 445 | 0,00 | 39 | -2,56 | ||||
| 2026-02-11 | 13F | Capital Group Private Client Services, Inc. | 23.194 | 1,47 | 2.022 | -1,03 | ||||
| 2026-02-13 | 13F | Bank Of Nova Scotia | Put | 2.000 | 174 | |||||
| 2026-02-03 | 13F | Insight 2811, Inc. | 256.287 | -1,52 | 22.338 | -3,96 | ||||
| 2026-02-10 | 13F | Tidemark, LLC | 514 | -0,77 | 45 | -4,35 | ||||
| 2026-01-21 | 13F | Impact Investors, Inc | 0 | -100,00 | 0 | |||||
| 2026-01-21 | 13F | Daytona Street Capital LLC | 175 | 15 | ||||||
| 2026-02-09 | 13F | Rooted Wealth Advisors, Inc. | 11.984 | 30,40 | 1.037 | 26,31 | ||||
| 2026-02-12 | 13F | Fortress Private Ledger, Llc | 2.834 | -18,26 | 247 | -20,06 | ||||
| 2026-02-09 | 13F | Narus Financial Partners, LLC | 17.214 | -0,24 | 1.500 | -2,72 | ||||
| 2026-02-02 | 13F | B.O.S.S. Retirement Advisors, LLC | 4.700 | -66,30 | 410 | -67,17 | ||||
| 2026-01-23 | 13F | ERTS Wealth Advisors, LLC | 16.047 | -1,07 | 1.399 | -3,52 | ||||
| 2026-01-23 | 13F | Paragon Capital Management Inc | 11.901 | -0,36 | 1.037 | -2,81 | ||||
| 2026-02-17 | 13F | MIRAE ASSET GLOBAL ETFS HOLDINGS Ltd. | 529.900 | -25,11 | 46.186 | -26,96 | ||||
| 2025-11-13 | 13F | Renaissance Technologies Llc | 0 | -100,00 | 0 | |||||
| 2025-11-14 | 13F | WNY Asset Management, LLC | 4.698 | -25,65 | 420 | -24,78 | ||||
| 2026-02-03 | 13F | Winch Advisory Services, LLC | 244 | 1,24 | 21 | 0,00 | ||||
| 2026-02-17 | 13F | National Asset Management, Inc. | 6.182 | -10,34 | 539 | -12,66 | ||||
| 2026-02-06 | 13F | Empirical Asset Management, LLC | 18.463 | 4,29 | 1.609 | 1,71 | ||||
| 2026-01-29 | 13F | Nbc Securities, Inc. | 1.470 | 11,96 | 128 | 9,40 | ||||
| 2026-01-21 | 13F | Flagship Harbor Advisors, Llc | 604 | 53 | ||||||
| 2026-02-24 | 13F | Tru Independence Asset Management 2, Llc | 26.310 | -7,46 | 2.293 | -9,72 | ||||
| 2026-01-27 | 13F | HCR Wealth Advisors | 2.709 | -41,16 | 236 | -42,72 | ||||
| 2025-10-22 | 13F | Gries Financial Llc | 2.955 | -34,17 | 264 | -33,33 | ||||
| 2026-02-06 | 13F | Harvest Portfolios Group Inc. | 3.120.016 | -11,75 | 271.941 | -13,93 | ||||
| 2026-02-12 | 13F | Bank Of Montreal /can/ | Put | 3.150.400 | 177,18 | 274.589 | 170,32 | |||
| 2026-02-12 | 13F | Bank Of Montreal /can/ | Call | 19.800 | 1.726 | |||||
| 2026-02-12 | 13F | Bank Of Montreal /can/ | 10.801.080 | -40,35 | 941.422 | -41,82 | ||||
| 2026-02-17 | 13F | XTX Topco Ltd | 44.320 | 3.863 | ||||||
| 2026-02-13 | 13F | Venture Visionary Partners LLC | 148.781 | -1,78 | 12.968 | -4,22 | ||||
| 2025-11-14 | 13F | Northeast Planning Associates, Inc. / Nh / | 0 | -100,00 | 0 | |||||
| 2026-02-11 | 13F | Stirlingshire Investments, Inc. | 7.971 | 695 | ||||||
| 2026-01-14 | 13F | Keystone Global Partners, LLC | 2 | -60,00 | ||||||
| 2026-02-17 | 13F | Readystate Asset Management Lp | Call | 0 | -100,00 | 0 | -100,00 | |||
| 2026-02-10 | 13F | Lcnb Corp | 6.250 | 0,00 | 545 | -2,51 | ||||
| 2026-02-11 | 13F | First Command Advisory Services, Inc. | 0 | -100,00 | 0 | |||||
| 2026-01-20 | 13F | Coastal Investment Advisors, Inc. | 9.380 | 30,70 | 818 | 27,46 | ||||
| 2025-11-05 | 13F | SPC Financial, Inc. | 3.130 | 1,62 | 280 | 2,95 | ||||
| 2026-02-05 | 13F | Sequent Planning LLC | 3.832 | 23,57 | 334 | 20,22 | ||||
| 2026-02-13 | 13F | Arkadios Wealth Advisors | Call | 500 | 0,00 | 44 | -2,27 | |||
| 2026-02-17 | 13F | Balyasny Asset Management Llc | Put | 1.882.400 | 12,13 | 164.070 | 9,36 | |||
| 2026-02-13 | 13F | Arkadios Wealth Advisors | 79.744 | 4,99 | 6.951 | 2,39 | ||||
| 2026-02-06 | 13F | BOK Financial Private Wealth, Inc. | 420 | 37 | ||||||
| 2026-02-17 | 13F | Balyasny Asset Management Llc | Call | 1.677.200 | 27,28 | 146.185 | 24,14 | |||
| 2026-02-17 | 13F | IHT Wealth Management, LLC | 495.380 | -1,33 | 43.177 | -3,77 | ||||
| 2026-02-17 | 13F | Massar Capital Management, LP | Put | 290.000 | 25.276 | |||||
| 2025-11-14 | 13F | Eqis Capital Management, Inc. | 0 | -100,00 | 0 | |||||
| 2026-01-05 | 13F | Coastline Trust Co | 207 | -40,86 | 18 | -41,94 | ||||
| 2026-01-20 | 13F | Tritonpoint Wealth, Llc | 0 | -100,00 | 0 | |||||
| 2026-02-06 | 13F | Cadence Wealth Management LLC | 574.974 | 15,41 | 50.115 | 12,56 | ||||
| 2026-01-28 | 13F | Salomon & Ludwin, LLC | 314 | -0,63 | 27 | -3,57 | ||||
| 2025-11-14 | 13F | Masters Capital Management Llc | Call | 0 | -100,00 | 0 | ||||
| 2026-01-29 | 13F | Compass Ion Advisors, LLC | 2.950 | 0,00 | 257 | -2,28 | ||||
| 2026-02-13 | 13F | Journey Strategic Wealth Llc | 278.692 | -0,49 | 24.291 | -2,95 | ||||
| 2026-01-22 | 13F | Bartlett & Co. Wealth Management Llc | 45 | 0,00 | 4 | -25,00 | ||||
| 2026-01-27 | 13F | Horst & Graben Wealth Management LLC | 132.485 | 1,07 | 11.554 | -1,37 | ||||
| 2026-01-27 | 13F | Klaas Financial Asset Advisors, LLC | 108.395 | 2,99 | 9.448 | 0,45 | ||||
| 2026-02-17 | 13F | Paloma Partners Management Co | Call | 150.000 | 13.074 | |||||
| 2025-11-25 | 13F | Kimelman & Baird, LLC | 0 | -100,00 | 0 | -100,00 | ||||
| 2026-02-11 | 13F | Group One Trading, L.p. | 50.230 | 4.378 | ||||||
| 2026-01-16 | 13F | Sims Investment Management, Llc | 40.225 | 20,79 | 3.506 | 17,81 | ||||
| 2026-02-10 | 13F | Td Asset Management Inc | 59.873 | 0,00 | 5.219 | -2,47 | ||||
| 2026-01-28 | 13F | Milestone Asset Management, Llc | 12.022 | 1.048 | ||||||
| 2026-02-06 | 13F | Signature Estate & Investment Advisors Llc | 2.314 | 1,85 | 202 | -0,99 | ||||
| 2026-02-17 | 13F | Massar Capital Management, LP | Call | 337.000 | 29.373 | |||||
| 2026-01-23 | 13F | Rsm Us Wealth Management Llc | 11.150 | 194,43 | 980 | 189,64 | ||||
| 2026-01-23 | 13F | Westside Investment Management, Inc. | 5.095 | -25,40 | 444 | -27,21 | ||||
| 2026-01-12 | 13F | National Wealth Management Group, LLC | 0 | -100,00 | 0 | |||||
| 2026-02-13 | 13F | Vega Investment Solutions | 0 | -100,00 | 0 | |||||
| 2026-01-07 | 13F | American Asset Management Inc. | 6.202 | 12,29 | 541 | 9,53 | ||||
| 2026-02-17 | 13F | Fairscale Capital, LLC | 1.220 | 0,00 | 106 | -2,75 | ||||
| 2025-10-17 | 13F | Ffg Retirement Advisors Llc | 0 | -100,00 | 0 | -100,00 | ||||
| 2025-11-12 | 13F | MGB Wealth Management, LLC | 0 | -100,00 | 0 | |||||
| 2025-11-14 | 13F | Cubist Systematic Strategies, LLC | 22.319 | 1.995 | ||||||
| 2025-11-14 | 13F | Cubist Systematic Strategies, LLC | Put | 954.100 | 8,63 | 85.268 | 10,01 | |||
| 2026-02-02 | 13F | Cornerstone Planning Group LLC | 334 | -24,60 | 29 | -27,50 | ||||
| 2025-11-14 | 13F | Cubist Systematic Strategies, LLC | Call | 464.900 | -39,93 | 41.548 | -39,16 | |||
| 2026-03-06 | 13F | Hsbc Holdings Plc | Call | 0 | -100,00 | 0 | -100,00 | |||
| 2025-11-13 | 13F | Herold Advisors, Inc. | 0 | -100,00 | 0 | |||||
| 2025-10-29 | 13F | Rede Wealth, LLC | 0 | -100,00 | 0 | |||||
| 2025-10-28 | 13F | Pinnacle Financial Partners Inc | 66.833 | 12,49 | 5.973 | 13,90 | ||||
| 2026-02-10 | 13F | Eq Llc | 52.306 | 47,70 | 4.559 | 44,09 | ||||
| 2026-01-30 | 13F | Smart Money Group LLC | 13.412 | -9,55 | 1.169 | -11,85 | ||||
| 2026-01-15 | 13F | Savior LLC | 22.021 | 198,87 | 1.919 | 191,64 | ||||
| 2026-02-17 | 13F | Marathon Asset Management Lp | Call | 3.000 | -88,89 | 8 | -95,27 | |||
| 2025-10-17 | 13F | Smallwood Wealth Investment Management, LLC | 0 | -100,00 | 0 | -100,00 | ||||
| 2026-01-27 | 13F | Able Wealth Management LLC | 10.894 | 1,95 | 950 | -0,63 | ||||
| 2026-02-17 | 13F | LMR Partners LLP | Call | 415.000 | -13,54 | 36.171 | -15,68 | |||
| 2026-01-14 | 13F | ORG Partners LLC | 17.131 | 425,65 | 1.493 | -0,33 | ||||
| 2026-01-20 | 13F | Maryland Capital Advisors Inc. | 1.772 | 0,00 | 154 | -2,53 | ||||
| 2026-02-02 | 13F | Horizon Investments, LLC | 337.037 | 336,40 | 29.376 | 328,66 | ||||
| 2026-01-02 | 13F | Global Wealth Strategies & Associates | 75.993 | 7,41 | 6.624 | 4,76 | ||||
| 2026-01-07 | 13F | St. Louis Financial Planners Asset Management, LLC | 0 | -100,00 | 0 | |||||
| 2026-01-15 | 13F | Archford Capital Strategies, LLC | 25.535 | 2.226 | ||||||
| 2026-01-09 | 13F | Tactive Advisors, LLC | 0 | -100,00 | 0 | |||||
| 2026-01-12 | 13F | DAVENPORT & Co LLC | 83.300 | -5,43 | 7.260 | -7,76 | ||||
| 2026-01-26 | 13F | Consolidated Portfolio Review Corp | 0 | -100,00 | 0 | |||||
| 2026-01-20 | 13F | Stratos Wealth Advisors, LLC | 20.568 | -25,39 | 1.793 | -27,24 | ||||
| 2026-02-17 | 13F | Toronto Dominion Bank | Call | 132.800 | 165,60 | 11.575 | 159,04 | |||
| 2026-02-17 | 13F | Toronto Dominion Bank | Put | 132.800 | 11.575 | |||||
| 2025-11-06 | 13F | Fundamentun, Llc | 0 | -100,00 | 0 | -100,00 | ||||
| 2026-02-17 | 13F | Graham Capital Management, L.P. | Put | 450.000 | 350,00 | 39.222 | 338,87 | |||
| 2025-11-10 | 13F | First Heartland Consultants, Inc. | 0 | -100,00 | 0 | |||||
| 2026-02-17 | 13F | Graham Capital Management, L.P. | 38.000 | 0,00 | 3.312 | -2,47 | ||||
| 2026-01-16 | 13F | Perigon Wealth Management, LLC | 111.619 | 14,56 | 9.729 | 11,73 | ||||
| 2025-11-17 | 13F | FSA Wealth Management LLC | 11 | 0,00 | 1 | |||||
| 2026-02-05 | 13F | IMG Wealth Management, Inc. | 41 | 4 | ||||||
| 2026-02-13 | 13F | Kestra Advisory Services, LLC | 0 | -100,00 | 0 | |||||
| 2026-01-26 | 13F | Merit Financial Group, LLC | 8.533 | -23,06 | 744 | -25,03 | ||||
| 2026-01-12 | 13F | CVA Family Office, LLC | 0 | -100,00 | 0 | |||||
| 2026-01-15 | 13F | Victory Financial Group, Llc | 6.627 | -28,59 | 578 | -34,28 | ||||
| 2026-01-27 | 13F | Checchi Capital Advisers, LLC | 115.134 | 34,35 | 10.035 | 31,02 | ||||
| 2025-11-04 | 13F | Pineridge Advisors LLC | 141 | 0,71 | 13 | 0,00 | ||||
| 2026-02-17 | 13F | VestGen Advisors, LLC | 16.837 | 7,93 | 1.467 | 5,24 | ||||
| 2026-02-13 | 13F | Capula Management Ltd | 0 | -100,00 | 0 | -100,00 | ||||
| 2026-02-13 | 13F | Capula Management Ltd | Put | 0 | -100,00 | 0 | -100,00 | |||
| 2026-02-02 | 13F | Estate Counselors, LLC | 4.425 | -31,29 | 386 | -33,04 | ||||
| 2025-11-14 | 13F | Quarry LP | Call | 0 | -100,00 | 0 | -100,00 | |||
| 2026-02-03 | 13F | Privium Fund Management (UK) Ltd | 0 | -100,00 | 0 | |||||
| 2026-01-27 | 13F | First Horizon Corp | 90.041 | 46,04 | 7.848 | 42,41 | ||||
| 2026-01-30 | 13F | Bogart Wealth, LLC | 29 | 0,00 | 3 | 0,00 | ||||
| 2026-02-17 | 13F | Millennium Management Llc | 1.015.956 | 10,79 | 88.551 | 8,05 | ||||
| 2026-01-26 | 13F | Annex Advisory Services, LLC | 4.424 | -12,86 | 386 | -15,01 | ||||
| 2026-01-30 | 13F | Caldwell Securities, Inc | 10.432 | -3,57 | 909 | -5,90 | ||||
| 2026-02-17 | 13F | Millennium Management Llc | Call | 1.511.200 | -58,18 | 131.716 | -59,22 | |||
| 2026-01-22 | 13F | Quotient Wealth Partners, LLC | 70.037 | -90,50 | 6.104 | -90,74 | ||||
| 2026-02-11 | 13F | Curtis Wealth Management Llc | 74.263 | 6.561 | ||||||
| 2026-02-10 | 13F | KERR FINANCIAL PLANNING Corp | 747 | 93,02 | 66 | 91,18 | ||||
| 2026-02-11 | 13F | Paces Ferry Wealth Advisors, Llc | 6.210 | -80,58 | 541 | -81,06 | ||||
| 2026-02-17 | 13F | Lombard Odier Asset Management (USA) Corp | Put | 417.000 | 0,00 | 36.346 | -2,47 | |||
| 2026-02-17 | 13F | Paloma Partners Management Co | 0 | -100,00 | 0 | |||||
| 2026-02-13 | 13F | Gen-Wealth Partners Inc | 1.774 | 9,71 | 155 | 6,94 | ||||
| 2026-02-13 | 13F | Marino Management, LLC | 154.653 | 13.588 | ||||||
| 2026-02-17 | 13F | Millennium Management Llc | Put | 1.687.900 | -19,23 | 147.117 | -21,23 | |||
| 2026-01-29 | 13F | Huntleigh Advisors, Inc. | 0 | -100,00 | 0 | |||||
| 2026-02-19 | 13F | CI Private Wealth, LLC | 63.594 | 21,82 | 5.544 | 18,82 | ||||
| 2026-02-06 | 13F | Van Hulzen Asset Management, LLC | 14.686 | -4,21 | 1.280 | -6,57 | ||||
| 2025-11-13 | 13F | DLD Asset Management, LP | 0 | -100,00 | 0 | |||||
| 2026-01-29 | 13F | Sanctuary Advisors, LLC | 244.123 | 15,08 | 21.278 | 12,23 | ||||
| 2026-01-14 | 13F | Accurate Wealth Management, LLC | 0 | -100,00 | 0 | -100,00 | ||||
| 2026-02-04 | 13F | Advisor OS, LLC | 0 | -100,00 | 0 | |||||
| 2026-03-05 | 13F | Bayban | 804 | 70 | ||||||
| 2025-10-30 | 13F | Investment Management Corp /va/ /adv | 0 | -100,00 | 0 | |||||
| 2026-01-12 | 13F | Gilman Hill Asset Management, LLC | 5.500 | 37,50 | 479 | 34,17 | ||||
| 2026-02-11 | 13F | Ipsen Advisor Group LLC | 0 | -100,00 | 0 | |||||
| 2026-02-10 | 13F | Yukon Wealth Management, Inc. | 22.807 | -2,71 | 1.974 | -5,78 | ||||
| 2026-02-17 | 13F | Strive Financial Group ,LLC | 1.108 | 97 | ||||||
| 2025-10-17 | 13F | Actinver Wealth Management, Inc. | 0 | -100,00 | 0 | |||||
| 2026-01-23 | 13F | SimpliFi, Inc. | 4.785 | 32,48 | 417 | 29,50 | ||||
| 2026-02-17 | 13F | Wellington Management Group Llp | Put | 0 | -100,00 | 0 | ||||
| 2026-01-16 | 13F | FNY Investment Advisers, LLC | 12.380 | -75,22 | 1 | -75,00 | ||||
| 2026-01-16 | 13F | FNY Investment Advisers, LLC | Call | 450 | 0 | |||||
| 2026-01-07 | 13F | Fragasso Group Inc. | 4.815 | -1,27 | 420 | -3,68 | ||||
| 2026-01-12 | 13F | Seacrest Wealth Management, Llc | 9.631 | 3,22 | 846 | 1,56 | ||||
| 2025-10-28 | 13F | Ritholtz Wealth Management | 0 | -100,00 | 0 | -100,00 | ||||
| 2026-01-07 | 13F | Central Pacific Bank - Trust Division | 0 | -100,00 | 0 | -100,00 | ||||
| 2026-02-12 | 13F | Johnson Financial Group, Inc. | 7.493 | 2,53 | 653 | 0,00 | ||||
| 2025-10-27 | 13F | Qvr Llc | Put | 0 | -100,00 | 0 | -100,00 | |||
| 2025-10-27 | 13F | Qvr Llc | Call | 0 | -100,00 | 0 | -100,00 | |||
| 2026-02-06 | 13F | Cedar Wealth Management, LLC | 3.195 | 0,00 | 278 | -2,46 | ||||
| 2026-02-13 | 13F | Integrated Wealth Concepts LLC | 26.684 | -23,73 | 2.326 | -25,62 | ||||
| 2026-02-03 | 13F | Encompass More Asset Management | 106.809 | -35,36 | 9.310 | -36,96 | ||||
| 2026-02-17 | 13F/A | American Alpha Advisors, LLC | 17.853 | 25,73 | 1.556 | 22,62 | ||||
| 2026-01-08 | 13F | Chesapeake Asset Management Llc | 0 | -100,00 | 0 | |||||
| 2026-02-17 | 13F | BlueCrest Capital Management Ltd | Call | 20.000 | 1.743 | |||||
| 2026-01-15 | 13F | Polaris Investment Advisors, LLC | 2.319 | 202 | ||||||
| 2025-11-12 | 13F | Capasso Planning Partners LLC | 0 | -100,00 | 0 | |||||
| 2026-02-13 | 13F | Wexford Capital Lp | Call | 0 | -100,00 | 0 | ||||
| 2026-02-17 | 13F | Crabel Capital Management, LLC | 17.373 | -2,90 | 1.514 | -5,26 | ||||
| 2026-02-12 | 13F | Great Valley Advisor Group, Inc. | 22.835 | -1,72 | 1.990 | -4,14 | ||||
| 2026-02-11 | 13F | Capital Analysts, Inc. | 1.340 | 477,59 | 0 | |||||
| 2026-01-29 | 13F | RMG Wealth Management LLC | 1.142 | 231 | ||||||
| 2026-02-05 | 13F | Atlas Private Wealth Advisors | 44.304 | 0,69 | 3.862 | -1,81 | ||||
| 2026-02-06 | 13F | Summit Wealth Group, LLC | 7.926 | -4,03 | 691 | -6,50 | ||||
| 2026-02-17 | 13F | Prelude Capital Management, Llc | 41.400 | -46,97 | 3.608 | -48,28 | ||||
| 2026-01-27 | 13F | Q3 Asset Management | 32.460 | 3 | ||||||
| 2026-02-17 | 13F | DZ BANK AG Deutsche Zentral Genossenschafts Bank, Frankfurt am Main | 825 | 72 | ||||||
| 2025-10-27 | 13F/A | OMNI 360 Wealth, Inc. | 0 | -100,00 | 0 | -100,00 | ||||
| 2026-02-13 | 13F | First Trust Advisors Lp | 45.484 | 1,42 | 3.964 | -1,10 | ||||
| 2026-01-26 | 13F | Independent Wealth Network Inc. | 5.562 | -0,38 | 485 | -2,81 | ||||
| 2026-01-30 | 13F | Camden Capital, LLC | 0 | -100,00 | 0 | |||||
| 2026-02-10 | 13F | Goldman Sachs Group Inc | 1.355.909 | -43,65 | 118.181 | -45,04 | ||||
| 2026-01-13 | 13F | Avaii Wealth Management, Llc | 0 | -100,00 | 0 | |||||
| 2026-01-22 | 13F | Fiduciary Alliance LLC | 3.325 | -38,88 | 290 | -40,53 | ||||
| 2025-10-17 | 13F | Client 1st Advisory Group, Llc | 0 | -100,00 | 0 | |||||
| 2026-01-23 | 13F | U.S. Capital Wealth Advisors, LLC | 331.569 | -0,69 | 28.900 | -3,15 | ||||
| 2026-02-13 | 13F | Barclays Plc | 8.226.708 | 29,80 | 717.040 | 26,59 | ||||
| 2026-01-29 | 13F | St Germain D J Co Inc | 0 | -100,00 | 0 | |||||
| 2026-02-13 | 13F | Centiva Capital, LP | 0 | -100,00 | 0 | -100,00 | ||||
| 2026-02-17 | 13F | Invenomic Capital Management LP | Call | 3.500 | 305 | |||||
| 2026-02-13 | 13F | Cavalier Investments, LLC | Call | 0 | -100,00 | 0 | -100,00 | |||
| 2026-02-10 | 13F | Exor Capital LLP | Call | 0 | -100,00 | 0 | -100,00 | |||
| 2026-02-17 | 13F | Opal Capital Llc | 4.834 | 592 | ||||||
| 2026-02-17 | 13F | Gladstone Institutional Advisory LLC | 141.817 | 21,69 | 12.361 | 18,67 | ||||
| 2026-02-13 | 13F | Centiva Capital, LP | Call | 0 | -100,00 | 0 | -100,00 | |||
| 2026-02-10 | 13F | Goldman Sachs Group Inc | Call | 17.614.400 | 84,87 | 1.535.271 | 80,30 | |||
| 2026-02-10 | 13F | Goldman Sachs Group Inc | Put | 20.313.100 | 15,54 | 1.770.490 | 12,68 | |||
| 2026-02-11 | 13F | XML Financial, LLC | 2.556 | 223 | ||||||
| 2026-01-22 | 13F | Vision Financial Markets Llc | 0 | -100,00 | 0 | |||||
| 2026-02-03 | 13F | Alta Wealth Advisors LLC | 0 | -100,00 | 0 | |||||
| 2025-11-14 | 13F | Ion Asset Management Ltd. | Put | 0 | -100,00 | 0 | -100,00 | |||
| 2026-01-21 | 13F | Finley Financial, LLC | 1.040 | 0,00 | 91 | -2,17 | ||||
| 2026-02-17 | 13F | Clark Capital Management Group, Inc. | 0 | -100,00 | 0 | |||||
| 2026-01-15 | 13F | Saxony Capital Management, LLC | 0 | -100,00 | 0 | |||||
| 2026-01-21 | 13F | Stone House Investment Management, LLC | 385 | 1.066,67 | 34 | 1.550,00 | ||||
| 2026-01-23 | 13F | Fonville Wealth Management LLC | 3.132 | 0,29 | 273 | -2,15 | ||||
| 2026-02-04 | 13F | Independent Advisor Alliance | 69.594 | -1,20 | 6.066 | -3,65 | ||||
| 2026-02-04 | 13F | Wsfs Capital Management, Llc | 4.569 | -7,23 | 398 | -9,55 | ||||
| 2026-01-20 | 13F | Arvest Investments, Inc. | 27.299 | -0,17 | 2.379 | -2,62 | ||||
| 2026-01-08 | 13F | Maridea Wealth Management LLC | 17.769 | -14,70 | 1.549 | -18,83 | ||||
| 2026-01-28 | 13F | Financial Perspectives, Inc | 202 | 18 | ||||||
| 2026-01-23 | 13F | Farther Finance Advisors, LLC | 289.040 | 19,17 | 25.193 | 16,22 | ||||
| 2026-01-26 | 13F | LifeWealth Investments, LLC | 69.212 | 3,34 | 6.032 | 0,79 | ||||
| 2026-01-08 | 13F | Wealth Enhancement Advisory Services, Llc | 167.906 | -0,21 | 14.655 | -2,33 | ||||
| 2026-01-02 | 13F | Insight Wealth Strategies, LLC | 320.946 | 2,16 | 27.974 | -0,37 | ||||
| 2026-02-06 | 13F | Brown Wealth Management, Llc | 72.011 | 109,74 | 6.277 | 104,56 | ||||
| 2026-02-17 | 13F | Sona Asset Management (us) Llc | Call | 600.000 | 445,45 | 52.296 | 432,00 | |||
| 2026-01-06 | 13F | RDA Financial Network | 2.646 | 0,00 | 231 | -2,54 | ||||
| 2026-02-13 | 13F | LGT Financial Advisors LLC | 0 | -100,00 | 0 | |||||
| 2026-02-17 | 13F | Sona Asset Management (us) Llc | Put | 600.000 | -79,87 | 52.296 | -80,36 | |||
| 2026-01-23 | 13F | SpringVest Wealth Management LLC | 2.580 | -11,03 | 225 | -13,51 | ||||
| 2026-02-13 | 13F | Cavalier Investments, LLC | 107.636 | 30,28 | 9.382 | 27,06 | ||||
| 2026-02-04 | 13F | Dynamic Wealth Strategies, LLC | 22.444 | 13,98 | 1.956 | 11,20 | ||||
| 2026-01-08 | 13F | Wealth Enhancement Advisory Services, Llc | Call | 215.000 | 7,50 | 427 | 6,77 | |||
| 2026-01-23 | 13F | Visionary Horizons, LLC | 2.679 | 0,00 | 234 | -2,51 | ||||
| 2026-01-16 | 13F | Crowley Wealth Management, Inc. | 0 | -100,00 | 0 | -100,00 | ||||
| 2026-01-15 | 13F | Affinity Wealth Management Llc | 289.870 | 2,59 | 25.265 | 0,06 | ||||
| 2026-02-13 | 13F | Brown Advisory Inc | 8.313 | -24,17 | 725 | -26,05 | ||||
| 2026-02-17 | 13F | Mpwm Advisory Solutions, Llc | 0 | -100,00 | 0 | |||||
| 2026-01-21 | 13F | Erickson Financial Group, LLC | 28.847 | -1,74 | 2.514 | -4,16 | ||||
| 2026-03-09 | 13F | Burton Enright Welch | 0 | -100,00 | 0 | |||||
| 2026-02-03 | 13F | International Assets Investment Management, Llc | 4.953 | 432 | ||||||
| 2025-11-13 | 13F | Brown Brothers Harriman & Co | 0 | -100,00 | 0 | |||||
| 2026-01-29 | 13F | Concurrent Investment Advisors, LLC | 536.123 | 6,61 | 46.728 | 3,97 | ||||
| 2026-02-03 | 13F | Patton Albertson Miller Group, Llc | 14.494 | -0,82 | 1.263 | -3,29 | ||||
| 2026-02-17 | 13F | Hyundai Investments Co., Ltd. | 5.456 | 479 | ||||||
| 2026-02-17 | 13F | Wealth Watch Advisors, INC | 741 | -0,54 | 65 | -3,03 | ||||
| 2026-02-06 | 13F | EverSource Wealth Advisors, LLC | 16.720 | 25,51 | 1.457 | 22,44 | ||||
| 2025-11-05 | 13F | Fullcircle Wealth Llc | 3.055 | -1,07 | 275 | 1,11 | ||||
| 2026-01-26 | 13F | Clean Yield Group | 440 | 0,00 | 38 | -2,56 | ||||
| 2026-01-12 | 13F | DKM Wealth Management, Inc. | 14.970 | -33,65 | 1.305 | -35,32 | ||||
| 2026-02-09 | 13F | Integrity Advisory Solutions, LLC | 12.739 | 12,62 | 1.110 | 9,90 | ||||
| 2026-02-25 | 13F | Westshore Wealth, LLC | 5.748 | -21,75 | 501 | -23,78 | ||||
| 2026-01-28 | 13F | Quaker Wealth Management, LLC | 196.860 | 2,29 | 17.158 | -0,24 | ||||
| 2025-11-06 | 13F | Financial Advocates Investment Management | 10.091 | -78,26 | 902 | -78,00 | ||||
| 2026-02-13 | 13F | Centaurus Financial, Inc. | 198.600 | 5,78 | 17 | 6,25 | ||||
| 2025-11-07 | 13F | Beacon Capital Management, LLC | 0 | -100,00 | 0 | -100,00 | ||||
| 2026-01-21 | 13F | 4wealth Advisors, Inc. | 20.475 | 3,02 | 1.785 | 0,45 | ||||
| 2026-02-17 | 13F | GeoWealth Management, LLC | 49.961 | 5,97 | 4.355 | 3,35 | ||||
| 2026-01-29 | 13F | Golden State Equity Partners | 7.581 | -34,64 | 661 | -36,29 | ||||
| 2026-02-17 | 13F | Imprint Wealth LLC | 64 | -50,00 | 6 | -54,55 | ||||
| 2026-01-27 | 13F | Latitude Advisors, LLC | 41.262 | 2,10 | 3.596 | -0,42 | ||||
| 2026-02-17 | 13F | Cresset Asset Management, LLC | Call | 0 | -100,00 | 0 | -100,00 | |||
| 2025-11-14 | 13F | Hotchkis & Wiley Capital Management Llc | 0 | -100,00 | 0 | -100,00 | ||||
| 2026-02-13 | 13F | Clay Northam Wealth Management, LLC | 29.474 | -21,64 | 2.569 | -23,59 | ||||
| 2026-02-13 | 13F | Avos Capital Management, LLC | 40.204 | -74,53 | 3.504 | -75,16 | ||||
| 2026-01-14 | 13F | Johnson Bixby & Associates, LLC | 2.484 | 0,00 | 217 | -2,26 | ||||
| 2026-02-13 | 13F | Change Path, LLC | 64.617 | -2,84 | 5.632 | -5,23 | ||||
| 2026-02-05 | 13F | Plante Moran Financial Advisors, LLC | 0 | -100,00 | 0 | |||||
| 2026-02-12 | 13F | Advisors Asset Management, Inc. | 5.633 | -26,42 | 491 | -28,36 | ||||
| 2026-01-30 | 13F | Wealthfront Advisers Llc | 114.043 | 49,81 | 9.940 | 46,10 | ||||
| 2026-02-09 | 13F | Cypress Capital Management LLC (WY) | 13 | 0,00 | 1 | 0,00 | ||||
| 2026-02-11 | 13F | Mascagni Wealth Management, Inc. | 3.080 | 1,05 | 268 | -1,47 | ||||
| 2026-02-13 | 13F | Hurley Capital, LLC | 164 | 0,61 | 14 | 0,00 | ||||
| 2026-01-07 | 13F | Innova Wealth Partners | 0 | -100,00 | 0 | |||||
| 2026-02-13 | 13F | Glen Eagle Advisors, LLC | 7 | 0,00 | 1 | |||||
| 2026-01-20 | 13F | Pflug Koory, LLC | 2.109 | 0,00 | 184 | -2,66 | ||||
| 2026-02-04 | 13F | Boyd Watterson Asset Management Llc/oh | 814 | 71 | ||||||
| 2026-02-17 | 13F | Lombard Odier Asset Management (USA) Corp | Call | 0 | -100,00 | 0 | ||||
| 2026-02-06 | 13F | Cullen/frost Bankers, Inc. | 77.802 | -30,29 | 6.781 | -32,01 | ||||
| 2026-02-12 | 13F | Jane Street Group, Llc | Put | 15.797.600 | 30,88 | 1.376.919 | 27,65 | |||
| 2026-02-12 | 13F | Jane Street Group, Llc | Call | 41.746.500 | 59,32 | 3.638.625 | 55,38 | |||
| 2026-02-12 | 13F | Jane Street Group, Llc | 10.766.253 | -7,62 | 938.387 | -9,91 | ||||
| 2026-02-02 | 13F | Benjamin Edwards Inc | Put | 0 | -100,00 | 0 | -100,00 | |||
| 2026-02-17 | 13F | LMR Partners LLP | Put | 2.522.200 | 278,03 | 219.835 | 268,68 | |||
| 2026-02-17 | 13F | Signature Equity Partners, LLC | 507 | 44 | ||||||
| 2026-02-17 | 13F | Hancock Whitney Corp | 30.476 | 455,12 | 2.656 | 442,04 | ||||
| 2026-02-17 | 13F | Glenview Capital Management, Llc | Put | 625.000 | 54.475 | |||||
| 2026-02-12 | 13F | Perseverance Asset Management International | 0 | -100,00 | 0 | |||||
| 2026-02-10 | 13F | Fortis Advisors, LLC | 2.511 | 219 | ||||||
| 2026-01-23 | 13F | Diversify Advisory Services, LLC | 76.675 | 4,09 | 6.732 | 1,85 | ||||
| 2026-02-17 | 13F | Core Wealth Partners LLC | 4.638 | -32,65 | 404 | -34,31 | ||||
| 2026-02-11 | 13F | Shared Vision Wealth Group LLC | 9.518 | 25,20 | 841 | 20,17 | ||||
| 2026-02-12 | 13F | Richard W. Paul & Associates, LLC | 129.681 | 4,30 | 11.303 | 1,72 | ||||
| 2026-01-29 | 13F | Riggs Asset Managment Co. Inc. | 52.952 | 45,25 | 4.615 | 41,69 | ||||
| 2026-02-02 | 13F | Advisors Preferred, LLC | 47.532 | 5.841,50 | 4.137 | 5.725,35 | ||||
| 2026-02-17 | 13F | Gallagher Fiduciary Advisors, LLC | 2.971 | 25,84 | 259 | 22,27 | ||||
| 2026-02-13 | 13F | Capstone Wealth Management Group, Llc | 55.007 | 448,15 | 4.794 | 435,04 | ||||
| 2026-02-12 | 13F | Summit Financial, LLC | 371.503 | -18,23 | 32.380 | -20,25 | ||||
| 2026-02-10 | 13F | Verus Capital Partners, Llc | 45.325 | 17,13 | 3.951 | 14,23 | ||||
| 2026-01-27 | 13F | Keeler & Nadler Financial Planning & Wealth Management | 0 | -100,00 | 0 | -100,00 | ||||
| 2026-02-04 | 13F | Community Bank, N.A. | 2.060 | 180 | ||||||
| 2025-11-14 | 13F | Mariner Investment Group Llc | Call | 0 | -100,00 | 0 | -100,00 | |||
| 2026-02-17 | 13F | Captrust Financial Advisors | 83.602 | -10,23 | 7.287 | -12,45 | ||||
| 2026-02-13 | 13F | GM Advisory Group, Inc. | 223.055 | -15,37 | 19.441 | -17,46 | ||||
| 2026-01-15 | 13F | Signature Wealth Management Group | 29.243 | 0,99 | 2.549 | -1,51 | ||||
| 2026-02-12 | 13F | Hikari Tsushin, Inc. | 0 | -100,00 | 0 | |||||
| 2026-01-07 | 13F | Sovereign Financial Group, Inc. | 2.315 | 1,09 | 202 | -1,47 | ||||
| 2026-02-11 | 13F | Strategy Asset Managers Llc | 2.737 | -5,49 | 239 | -7,75 | ||||
| 2025-10-09 | 13F | Ridgepath Capital Management LLC | 0 | -100,00 | 0 | -100,00 | ||||
| 2026-01-28 | 13F | WMG Financial Advisors, LLC | 2.574 | -36,99 | 224 | -38,63 | ||||
| 2026-02-11 | 13F | Wealthgarden F.s. Llc | 10.667 | -5,00 | 942 | -8,28 | ||||
| 2026-01-13 | 13F | Kelly Financial Services LLC | 9.260 | 153,70 | 807 | 147,55 | ||||
| 2026-02-13 | 13F | Volterra Technologies LP | 0 | -100,00 | 0 | |||||
| 2025-10-30 | 13F | Charter Oak Capital Management, LLC | 0 | -100,00 | 0 | |||||
| 2025-11-14 | 13F | DeepCurrents Investment Group LLC | Call | 0 | -100,00 | 0 | -100,00 | |||
| 2026-02-10 | 13F | Rock Creek Group, LP | 507.314 | 10,97 | 44.224 | 8,24 | ||||
| 2026-02-03 | 13F | Mma Asset Management Llc | 13.002 | 66,41 | 1.133 | 62,32 | ||||
| 2026-01-07 | 13F | Sagespring Wealth Partners, Llc | 81.301 | 4,59 | 7.086 | 2,00 | ||||
| 2026-01-28 | 13F | Nvest Wealth Strategies, Inc. | 27 | 2 | ||||||
| 2026-02-10 | 13F | Calton & Associates, Inc. | 3.427 | 299 | ||||||
| 2026-02-18 | 13F | Beacon Pointe Advisors, LLC | 37.258 | 434,47 | 3.247 | 421,19 |
Other Listings
| KZ:TLT_KZ | 85,63 $ |