Grundlæggende statistik
| Institutionelle aktier (lange) | 1.085.116.349 - 87,42% (ex 13D/G) - change of -117,87MM shares -9,30% MRQ |
| Institutionel værdi (lang) | $ 125.721.746 USD ($1000) |
Institutionelt ejerskab og aktionærer
Gilead Sciences, Inc. (US:GILD) har 2428 institutionelle ejere og aktionærer, der har indsendt 13D/G- eller 13F-formularer til Securities Exchange Commission (SEC). Disse institutioner har i alt 1,085,116,349 aktier. Største aktionærer omfatter BlackRock, Inc., Vanguard Group Inc, Fmr Llc, State Street Corp, Capital World Investors, Geode Capital Management, Llc, Price T Rowe Associates Inc /md/, Dodge & Cox, Capital Research Global Investors, and Morgan Stanley .
Gilead Sciences, Inc. (NasdaqGS:GILD) institutionel ejerskabsstruktur viser aktuelle positioner i virksomheden efter institutioner og fonde, samt seneste ændringer i positionsstørrelse. Større aktionærer kan omfatte individuelle investorer, investeringsforeninger, hedgefonde eller institutioner. Skema 13D angiver, at investoren besidder (eller besidder) mere end 5 % af virksomheden og har til hensigt (eller har til hensigt at) aktivt at forfølge en ændring i forretningsstrategi. Skema 13G indikerer en passiv investering på over 5%.
The share price as of March 25, 2026 is 138,24 / share. Previously, on March 27, 2025, the share price was 111,16 / share. This represents an increase of 24,36% over that period.

Fondens stemningsscore
Fund Sentiment Score (fka Ownership Accumulation Score) finder de aktier, der bliver mest købt af fonde. Det er resultatet af en sofistikeret, multi-faktor kvantitativ model, der identificerer virksomheder med de højeste niveauer af institutionel akkumulering. Scoringsmodellen bruger en kombination af den samlede stigning i oplyste ejere, ændringerne i porteføljeallokeringer i disse ejere og andre målinger. Tallet går fra 0 til 100, hvor højere tal indikerer et højere niveau af akkumulering for sine jævnaldrende, og 50 er gennemsnittet.
Opdateringsfrekvens: Dagligt
Se Ownership Explorer, som giver en liste over højest rangerende virksomheder.
AI+ Ask Fintel’s AI assistant about Gilead Sciences, Inc..
Select a question to share a public post with an AI-crafted answer.
Thinking of good questions…
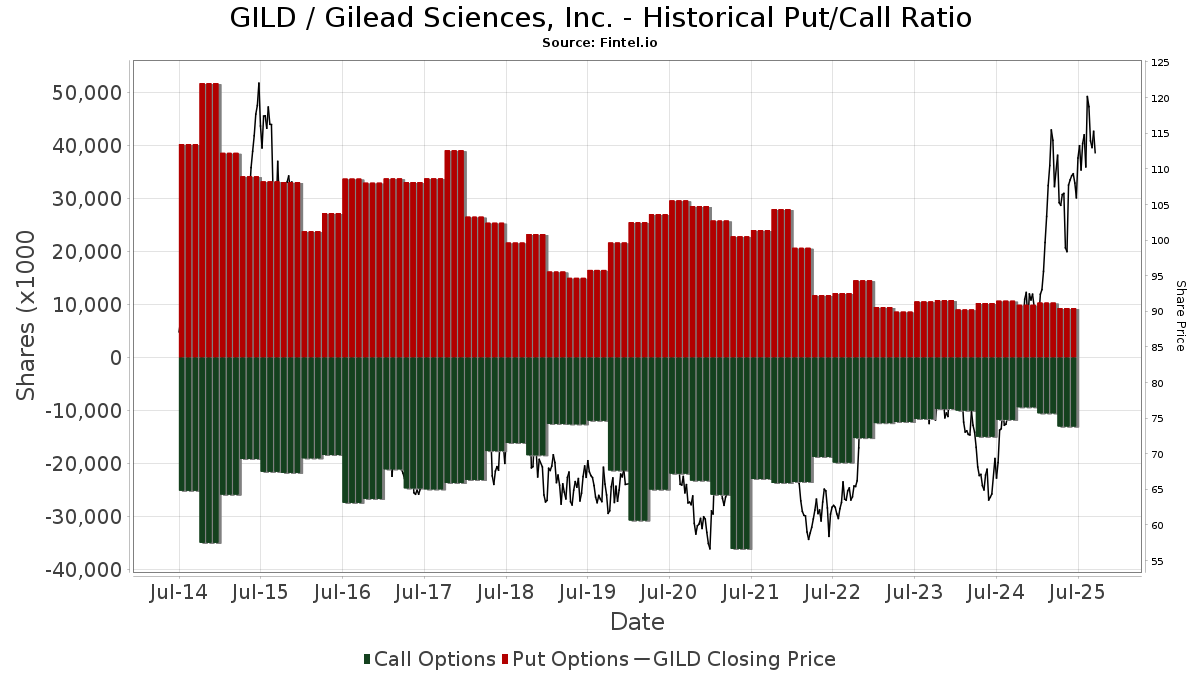
Institutionel Put/Call-forhold
Ud over at indberette standardaktie- og gældsudstedelser skal institutter med mere end 100 mill. aktiver under forvaltning også oplyse deres put- og call-optionsbeholdninger. Da salgsoptioner generelt indikerer negativ stemning, og købsoptioner indikerer positiv stemning, kan vi få en fornemmelse af den overordnede institutionelle stemning ved at plotte forholdet mellem put og kald. Diagrammet til højre viser det historiske put/call-forhold for dette instrument.
Brug af Put/Call Ratio som en indikator for investorernes stemning overvinder en af de vigtigste mangler ved at bruge totalt institutionelt ejerskab, som er, at en betydelig mængde af aktiver under forvaltning investeres passivt for at spore indekser. Passivt forvaltede fonde køber typisk ikke optioner, så indikatoren for put/call-forholdet følger mere nøje følelsen af aktivt forvaltede fonde.
13D/G-arkivering
Vi præsenterer 13D/G ansøgninger separat fra 13F ansøgninger på grund af den forskellige behandling af SEC. 13D/G-ansøgninger kan indgives af grupper af investorer (med én ledende), hvorimod 13F-ansøgninger ikke kan. Dette resulterer i situationer, hvor en investor kan indsende en 13D/G, der rapporterer én værdi for de samlede aktier (der repræsenterer alle de aktier, der ejes af investorgruppen), men derefter indsender en 13F, der rapporterer en anden værdi for de samlede aktier (der udelukkende repræsenterer deres egne) ejendomsret). Det betyder, at aktieejerskab af 13D/G-arkiver og 13F-arkiveringer ofte ikke er direkte sammenlignelige, så vi præsenterer dem separat.
Bemærk: Fra den 16. maj 2021 viser vi ikke længere ejere, der ikke har indsendt en 13D/G inden for det seneste år. Tidligere viste vi den fulde historie af 13D/G-arkiver. Generelt skal enheder, der er forpligtet til at indgive 13D/G-ansøgninger, indgive mindst årligt, før de indsender en afsluttende ansøgning. Dog forlader fonde nogle gange positioner uden at indsende en afsluttende ansøgning (dvs. de afvikler), så visning af den fulde historie resulterede nogle gange i forvirring om det nuværende ejerskab. For at undgå forvirring viser vi nu kun 'aktuelle' ejere - det vil sige - ejere, der har anmeldt inden for det seneste år.
Upgrade to unlock premium data.
| Fil dato | Form | Investor | Forrige Aktier |
Seneste Aktier |
Δ Aktier (Procent) |
Ejendomsret (Procent) |
Δ Ejerskab (Procent) |
|
|---|---|---|---|---|---|---|---|---|
| 2026-02-05 | FMR LLC | 39,678,492 | 65,539,476 | 65.18 | 5.30 | 76.02 | ||
| 2025-05-13 | Capital World Investors | 83,698,215 | 53,834,873 | -35.68 | 4.30 | -35.82 | ||
| 2025-04-24 | BlackRock, Inc. | 122,790,297 | 101,739,273 | -17.14 | 8.20 | -17.17 |
13F og NPORT arkivering
Detaljer om 13F-arkivering er gratis. Detaljer om NP-ansøgninger kræver et premium-medlemskab. Grønne rækker angiver nye positioner. Røde rækker angiver lukkede positioner. Klik på linket ikon for at se den fulde transaktionshistorik.
Opgrader
for at låse premium-data op og eksportere til Excel ![]() .
.
Important Note
In an effort to reduce load times for our mobile users, we are testing some ways to deliver lighter pages.
In this first test, we will deliver only the most recent 750 transactions (out of 2776 for this stock). If you are interested in loading *all* the transactions for this company, click the "load all" button below. This is just a test and if you don't like it, please let us know by submitting some gentle feedback via the link at the bottom of this page.
Load All| Fil dato | Kilde | Investor | Type | Gennemsnitlig pris (Øst) |
Aktier | Δ Aktier (%) |
Rapporteret Værdi ($1000) |
Δ Værdi (%) |
Port Alloc (%) |
|
|---|---|---|---|---|---|---|---|---|---|---|
| 2026-01-26 | 13F | Provenance Wealth Advisors, LLC | 2.614 | 0,00 | 321 | 10,34 | ||||
| 2026-01-16 | 13F | Walker Asset Management, LLC | 4.547 | 0,42 | 558 | 11,16 | ||||
| 2026-02-09 | 13F | Knights of Columbus Asset Advisors LLC | 57.539 | 2,52 | 7.062 | 13,37 | ||||
| 2026-02-10 | 13F | Core Wealth Advisors, Llc | 112 | 14 | ||||||
| 2025-10-15 | 13F | Mb, Levis & Associates, Llc | 0 | -100,00 | 0 | |||||
| 2026-02-11 | 13F | Fjarde Ap-fonden /fourth Swedish National Pension Fund | 295.063 | 36.216 | ||||||
| 2026-02-09 | 13F | Nia Impact Advisors, Llc | 54.354 | 6,47 | 6.671 | 17,74 | ||||
| 2026-02-17 | 13F | D. E. Shaw & Co., Inc. | Put | 27.000 | 0,00 | 3.314 | 10,54 | |||
| 2026-02-17 | 13F | D. E. Shaw & Co., Inc. | 192.705 | -53,43 | 23.653 | -48,50 | ||||
| 2026-02-04 | 13F | JSF Financial, LLC | 10.164 | 1.248 | ||||||
| 2026-02-17 | 13F | D. E. Shaw & Co., Inc. | Call | 80.700 | -25,90 | 9.905 | -18,05 | |||
| 2026-01-26 | 13F | Means Investment Co., Inc. | 4.853 | -17,56 | 596 | -8,88 | ||||
| 2026-02-12 | 13F | M&G Plc | 102.446 | 5,07 | 12.601 | 16,43 | ||||
| 2026-02-13 | 13F | Level Four Advisory Services, Llc | 29.013 | 7,81 | 3.561 | 19,22 | ||||
| 2026-01-29 | 13F | Bender Robert & Associates | 2.819 | 0,00 | 346 | 10,90 | ||||
| 2026-02-04 | 13F | HighPoint Advisor Group LLC | 23.106 | 12,53 | 2.836 | 24,44 | ||||
| 2026-02-13 | 13F | FORA Capital, LLC | 0 | -100,00 | 0 | |||||
| 2026-02-17 | 13F | Cahill Financial Advisors Inc | 3.679 | -0,59 | 452 | 10,00 | ||||
| 2025-11-14 | 13F | ISAM Funds (UK) Ltd | 0 | -100,00 | 0 | -100,00 | ||||
| 2026-02-17 | 13F | CHICAGO TRUST Co NA | 0 | -100,00 | 0 | |||||
| 2026-01-26 | 13F | Chicago Capital, LLC | 4.092 | 0,84 | 502 | 11,56 | ||||
| 2026-01-28 | 13F | United Asset Strategies, Inc. | 27.347 | 0,19 | 3.357 | 10,80 | ||||
| 2026-02-04 | 13F | Virginia Retirement Systems Et Al | 1.156.695 | -9,73 | 141.973 | -0,18 | ||||
| 2026-02-13 | 13F | Sienna Gestion | 53.402 | 0,00 | 6.545 | 21,11 | ||||
| 2026-02-18 | 13F | EP Wealth Advisors, Inc. | 28.291 | -3,30 | 3.472 | 7,06 | ||||
| 2026-02-12 | 13F | von Borstel & Associates, Inc. | 0 | -100,00 | 0 | |||||
| 2026-02-17 | 13F | Tcw Group Inc | 26.360 | 3.235 | ||||||
| 2026-02-12 | 13F | Raiffeisen Bank International AG | 198.947 | 2,43 | 24.506 | 12,03 | ||||
| 2026-02-09 | 13F | Thrive Capital Management, LLC | 33.977 | -8,36 | 4.170 | 1,34 | ||||
| 2026-01-20 | 13F | Perpetual Ltd | 28.498 | 117,94 | 3.498 | 141,01 | ||||
| 2026-02-11 | 13F | Picton Mahoney Asset Management | 67.053 | 40,79 | 8.230 | 164.500,00 | ||||
| 2026-01-29 | 13F | Obermeyer Wood Investment Counsel, Lllp | 2.954 | 0,37 | 363 | 11,04 | ||||
| 2026-02-03 | 13F | Merrithew & Thorsten Inc | 51 | 0 | ||||||
| 2026-02-10 | 13F | Norges Bank | 21.322.732 | 2.617.152 | ||||||
| 2026-01-26 | 13F | JNBA Financial Advisors | 4.273 | -3,33 | 524 | 6,94 | ||||
| 2026-02-13 | 13F | Laurion Capital Management LP | 0 | -100,00 | 0 | |||||
| 2026-02-18 | 13F | State of Tennessee, Treasury Department | 488.599 | 14,69 | 69.357 | 46,66 | ||||
| 2026-02-02 | 13F | Caisse Des Depots Et Consignations | 63.322 | 3,71 | 7.772 | 14,68 | ||||
| 2026-02-13 | 13F | Kilter Group LLC | 319 | 6,69 | 39 | 18,18 | ||||
| 2026-01-06 | 13F | Farmers Trust Co | 38.185 | 2,73 | 4.687 | 13,60 | ||||
| 2026-02-06 | 13F | ProShare Advisors LLC | 2.217.290 | 39,14 | 272.150 | 53,86 | ||||
| 2026-01-12 | 13F | Quantum Financial Advisors, LLC | 3.358 | 0,21 | 412 | 10,75 | ||||
| 2026-02-19 | 13F | Invesco Ltd. | 15.584.341 | 2,94 | 1.912.822 | 13,82 | ||||
| 2025-11-12 | 13F | K.J. Harrison & Partners Inc | 0 | -100,00 | 0 | -100,00 | ||||
| 2026-01-12 | 13F | Castleview Partners, Llc | 5.009 | 10,92 | 615 | 22,55 | ||||
| 2026-02-03 | 13F | Lumbard & Kellner, LLC | 1.960 | 0,00 | 241 | 10,60 | ||||
| 2026-02-17 | 13F | Schonfeld Strategic Advisors LLC | 0 | -100,00 | 0 | |||||
| 2026-02-17 | 13F | Nearwater Capital Markets, Ltd | 1.013.000 | 71,69 | 124.336 | 89,85 | ||||
| 2026-02-17 | 13F | Schonfeld Strategic Advisors LLC | Put | 0 | -100,00 | 0 | ||||
| 2026-02-06 | 13F | Twin Capital Management Inc | 27.991 | -1,22 | 3.436 | 9,22 | ||||
| 2026-01-20 | 13F | Toth Financial Advisory Corp | 61 | 15,09 | 7 | 40,00 | ||||
| 2026-02-13 | 13F | NLB Skladi, upravljanje premozenja, d.o.o. | 73.806 | 9.059 | ||||||
| 2026-02-04 | 13F | Asahi Life Asset Management Co., Ltd. | 2.290 | 281 | ||||||
| 2026-02-12 | 13F | Capital Counsel Llc/ny | 69.210 | 0,00 | 8.495 | 10,57 | ||||
| 2026-03-17 | 13F | Stance Capital Llc | 11.272 | -6,76 | 1.384 | 3,13 | ||||
| 2026-02-12 | 13F | BRYN MAWR TRUST Co | 12.553 | 0,14 | 1.541 | 10,71 | ||||
| 2026-02-05 | 13F | Mesirow Financial Investment Management, Inc. | 6.350 | -13,77 | 779 | -4,65 | ||||
| 2026-01-08 | 13F | Sanders Morris Harris Llc | 0 | -100,00 | 0 | -100,00 | ||||
| 2026-01-13 | 13F | Argentarii, LLC | 3.352 | 0,21 | 411 | 10,78 | ||||
| 2026-01-28 | 13F | Proathlete Wealth Management Llc | 18 | 2 | ||||||
| 2026-02-17 | 13F | Lombard Odier Asset Management (Europe) Ltd | 20.000 | 2.455 | ||||||
| 2026-02-12 | 13F | Intesa Sanpaolo Wealth Management | 2.921 | 359 | ||||||
| 2026-02-17 | 13F | Lazard Asset Management Llc | 300.787 | -10,87 | 36.919 | -1,44 | ||||
| 2026-01-22 | 13F | WealthBridge Investment Counsel Inc. | 64.330 | -0,16 | 8 | 0,00 | ||||
| 2026-02-02 | 13F | CENTRAL TRUST Co | 19.763 | 1,28 | 2.426 | 11,96 | ||||
| 2026-02-11 | 13F | Illinois Municipal Retirement Fund | 369.834 | 6,62 | 45.393 | 17,90 | ||||
| 2026-02-06 | 13F | Payden & Rygel | 91.280 | 0,00 | 11 | 10,00 | ||||
| 2026-01-28 | 13F | Consolidated Planning Corp | 1.949 | 0,00 | 239 | 10,65 | ||||
| 2026-02-10 | 13F | Principia Wealth Advisory, LLC | 75 | 13,64 | 9 | 28,57 | ||||
| 2025-10-29 | 13F | Interactive Financial Advisors | 0 | -100,00 | 0 | |||||
| 2025-11-14 | 13F | Eqis Capital Management, Inc. | 0 | -100,00 | 0 | -100,00 | ||||
| 2026-01-29 | 13F | State Of Michigan Retirement System | 324.795 | -3,22 | 39.865 | 7,02 | ||||
| 2026-02-09 | 13F | Syverson Strege & Co | 3.105 | 16,34 | 381 | 28,72 | ||||
| 2026-01-16 | 13F | Kendall Capital Management | 8.652 | -2,92 | 1.062 | 7,28 | ||||
| 2026-02-10 | 13F | Ellevest, Inc. | 5.826 | -9,22 | 715 | 0,42 | ||||
| 2026-02-17 | 13F | Schonfeld Strategic Advisors LLC | Call | 0 | -100,00 | 0 | ||||
| 2026-01-21 | 13F | Clayton Financial Group LLC | 183 | 22 | ||||||
| 2026-01-23 | 13F | Reuter James Wealth Management, Llc | 4.248 | -19,04 | 521 | -10,48 | ||||
| 2026-01-07 | 13F | Covea Finance | 0 | -100,00 | 0 | |||||
| 2026-02-03 | 13F | Crossmark Global Holdings, Inc. | 551.922 | 4,49 | 67.743 | 15,54 | ||||
| 2026-02-06 | 13F | Fi3 FINANCIAL ADVISORS, LLC | 2.549 | 11,90 | 313 | 23,81 | ||||
| 2025-10-09 | 13F | IVC Wealth Advisors LLC | 0 | -100,00 | 0 | |||||
| 2026-01-08 | 13F | Baker Tilly Financial, Llc | 2.852 | 13,44 | 350 | 25,45 | ||||
| 2026-01-13 | 13F | Avaii Wealth Management, Llc | 2.015 | 247 | ||||||
| 2026-02-13 | 13F | JustInvest LLC | 204.048 | 2,45 | 25.045 | 13,24 | ||||
| 2026-03-12 | 13F | Nalls Sherbakoff Group, Llc | 0 | -100,00 | 0 | |||||
| 2026-02-09 | 13F | Arnhold LLC | 22.952 | 0,00 | 2.817 | 10,60 | ||||
| 2026-01-14 | 13F | Southland Equity Partners LLC | 3.317 | 0,09 | 407 | 10,90 | ||||
| 2026-01-21 | 13F | Hudson Capital Management LLC | 52.036 | -1,65 | 6.387 | 8,75 | ||||
| 2026-01-28 | 13F | Bigelow Investment Advisors, LLC | 5.021 | 0,06 | 616 | 10,79 | ||||
| 2026-02-11 | 13F | Hughes Financial Services, LLC | 93 | 0,00 | 11 | 10,00 | ||||
| 2026-02-11 | 13F | Vermillion Wealth Management, Inc. | 723 | 623,00 | 89 | 700,00 | ||||
| 2026-02-12 | 13F | Longbow Finance SA | 44.467 | -52,09 | 5.458 | -47,03 | ||||
| 2026-02-04 | 13F | Liberty Wealth Management Llc | 1.837 | -6,18 | 225 | 3,69 | ||||
| 2026-02-12 | 13F | Andra AP-fonden | 482.800 | -19,20 | 59.259 | -10,65 | ||||
| 2026-02-12 | 13F | Loomis Sayles & Co L P | 61.489 | -33,27 | 7.547 | -26,21 | ||||
| 2026-02-05 | 13F | RiverFront Investment Group, LLC | 3.447 | -7,78 | 423 | 2,17 | ||||
| 2026-02-17 | 13F | Sagewood Asset Management LP | 9.903 | 1.215 | ||||||
| 2026-01-07 | 13F | Harbor Investment Advisory, Llc | 768 | 159,46 | 94 | 193,75 | ||||
| 2025-09-26 | NP | Tax-Managed Value Portfolio - Tax-Managed Value Portfolio | 75.441 | -22,37 | 8.471 | -18,18 | ||||
| 2026-02-10 | 13F | Westpac Banking Corp | 92.247 | 6,69 | 11.322 | 17,97 | ||||
| 2026-02-09 | 13F | Powell Investment Advisors, LLC | 7.040 | 0,00 | 864 | 10,63 | ||||
| 2025-11-14 | 13F | Haverford Trust Co | 0 | -100,00 | 0 | |||||
| 2026-02-13 | 13F | Colony Group, LLC | 520.653 | 33,73 | 63.756 | 47,72 | ||||
| 2026-01-26 | 13F | Abundance Wealth Counselors | 25.382 | -3,68 | 3.115 | 6,53 | ||||
| 2026-02-04 | 13F | Mascoma Wealth Management LLC | 1.012 | 1,50 | 124 | 12,73 | ||||
| 2025-09-29 | NP | COWZ - Pacer US Cash Cows 100 ETF | 3.453.259 | -10,78 | 387.766 | -5,96 | ||||
| 2026-02-06 | 13F | Redmont Wealth Advisors Llc | 73 | 0,00 | 9 | 0,00 | ||||
| 2026-02-13 | 13F | Capital Financial Group Inc\co\ /adv | 13.219 | 1.623 | ||||||
| 2026-02-17 | 13F | Raymond James Financial Inc | 2.734.917 | 50,62 | 336.007 | 66,71 | ||||
| 2026-01-13 | 13F | Parsons Capital Management Inc/ri | 5.845 | 717 | ||||||
| 2026-02-11 | 13F | Janney Montgomery Scott LLC | 189.735 | 13,54 | 23 | 27,78 | ||||
| 2026-02-23 | 13F | Wealth Preservation Advisors, LLC | 216 | 60,00 | 27 | 85,71 | ||||
| 2026-03-16 | 13F | Osbon Capital Management Llc | 90 | 11 | ||||||
| 2026-01-29 | 13F | Vanguard Group Inc | 121.097.336 | 1,78 | 14.863.487 | 12,54 | ||||
| 2026-02-17 | 13F | Coppell Advisory Solutions LLC | 19.475 | -2,83 | 2.399 | 6,25 | ||||
| 2026-02-28 | 13F | NCM Capital Management, LLC | 9.947 | -2,00 | 1.221 | 8,35 | ||||
| 2026-02-13 | 13F | Rafferty Asset Management, LLC | 283.202 | -10,06 | 34.760 | -0,55 | ||||
| 2026-02-13 | 13F | Charles Schwab Investment Management Inc | 8.006.790 | 0,96 | 982.753 | 11,64 | ||||
| 2025-11-14 | 13F | Wetherby Asset Management Inc | 44.133 | 2,73 | 4.899 | 2,83 | ||||
| 2025-09-29 | NP | LGDX - Intech S&P Large Cap Diversified Alpha ETF | 1.763 | 9,44 | 198 | 15,20 | ||||
| 2026-02-17 | 13F | Brevan Howard Capital Management LP | 114.639 | 468,73 | 14.071 | 528,97 | ||||
| 2026-02-13 | 13F | Resources Management Corp /ct/ /adv | 20.373 | -2,97 | 3 | 0,00 | ||||
| 2026-02-09 | 13F | Severin Investments, LLC | 4.459 | 6,98 | 547 | 18,40 | ||||
| 2026-02-13 | 13F | United Bank | 64.845 | -17,22 | 7.959 | -8,46 | ||||
| 2025-11-07 | 13F | Synovus Financial Corp | 21.094 | -0,06 | 2.342 | 0,04 | ||||
| 2026-01-20 | 13F | Coastal Investment Advisors, Inc. | 0 | -100,00 | 0 | -100,00 | ||||
| 2025-12-01 | 13F/A | Polar Asset Management Partners Inc. | 0 | -100,00 | 0 | -100,00 | ||||
| 2026-01-30 | 13F | R Squared Ltd | 0 | -100,00 | 0 | |||||
| 2026-01-28 | 13F | Mowery & Schoenfeld Wealth Management, LLC | 181 | 60,18 | 22 | 83,33 | ||||
| 2026-02-03 | 13F | Asset Planning,Inc | 824 | 0,00 | 101 | 10,99 | ||||
| 2026-02-05 | 13F | Tucker Asset Management Llc | 3.864 | -8,93 | 474 | 0,85 | ||||
| 2026-01-20 | 13F | Steel Peak Wealth Management LLC | 0 | -100,00 | 0 | |||||
| 2026-01-20 | 13F | Partners Wealth Management, Llc | 2.150 | 2,92 | 264 | 13,85 | ||||
| 2026-01-14 | 13F | Eastern Bank | 2.251 | 172,85 | 276 | 203,30 | ||||
| 2026-02-17 | 13F | Mercer Global Advisors Inc /adv | 325.035 | 9,85 | 37.316 | 13,62 | ||||
| 2026-01-29 | 13F | Quest 10 Wealth Builders, Inc. | 112 | -16,42 | 14 | -7,14 | ||||
| 2026-02-03 | 13F | Gateway Investment Advisers Llc | 122.139 | 2,36 | 14.991 | 13,19 | ||||
| 2026-02-11 | 13F | MidWestOne Financial Group, Inc. | 1.800 | 221 | ||||||
| 2026-02-09 | 13F | Allen Capital Group, LLC | 2.288 | 5,49 | 281 | 16,67 | ||||
| 2026-02-09 | 13F | MQS Management LLC | 3.189 | -3,28 | 391 | 7,12 | ||||
| 2026-02-10 | 13F | Crestmont Private Wealth LLC | 3.334 | 5,11 | 409 | 16,19 | ||||
| 2026-01-22 | 13F | True North Advisors, LLC | 0 | -100,00 | 0 | |||||
| 2025-09-26 | NP | SUNAMERICA SERIES TRUST - SA Schroders VCP Global Allocation Portfolio Class 3 | 1.561 | -17,71 | 175 | -13,37 | ||||
| 2026-02-12 | 13F | Commonwealth Equity Services, Llc | 263.538 | -14,88 | 32.347 | 95.035,29 | ||||
| 2025-09-26 | NP | AMOM - QRAFT AI-Enhanced U.S. Large Cap Momentum ETF | 0 | -100,00 | 0 | -100,00 | ||||
| 2025-09-26 | NP | BRNY - Burney U.S. Factor Rotation ETF | 27.295 | 215,22 | 3.065 | 232,32 | ||||
| 2026-01-27 | 13F | ZEGA Investments, LLC | 0 | -100,00 | 0 | -100,00 | ||||
| 2026-02-13 | 13F | Marshall Wace, Llp | Put | 100 | 12 | |||||
| 2026-02-13 | 13F | Marshall Wace, Llp | Call | 200 | 25 | |||||
| 2025-11-12 | 13F | Claro Advisors LLC | 0 | -100,00 | 0 | -100,00 | ||||
| 2026-02-13 | 13F | Marshall Wace, Llp | 793.385 | 97.380 | ||||||
| 2026-02-12 | 13F | Leigh Baldwin & Co., Llc | 4.766 | 0,04 | 585 | 10,80 | ||||
| 2025-11-14 | 13F | Binnacle Investments Inc | 785 | 11,82 | 87 | 12,99 | ||||
| 2026-02-10 | 13F | Bruce G. Allen Investments, LLC | 1.205 | -12,49 | 148 | -3,29 | ||||
| 2025-09-26 | NP | ULPIX - Ultrabull Profund Investor Class | 2.779 | 12,06 | 312 | 18,18 | ||||
| 2026-01-09 | 13F | Somerset Trust Co | 7.592 | 0,33 | 932 | 10,97 | ||||
| 2026-01-12 | 13F | Certified Advisory Corp | 7.008 | -31,32 | 860 | -24,03 | ||||
| 2026-02-11 | 13F | Waddell & Associates, Llc | 1.706 | 209 | ||||||
| 2026-02-17 | 13F | Parallax Volatility Advisers, L.P. | 351 | -97,72 | 43 | -97,48 | ||||
| 2026-02-17 | 13F | Parallax Volatility Advisers, L.P. | Put | 40.000 | 300,00 | 4.910 | 342,25 | |||
| 2026-02-17 | 13F | Parallax Volatility Advisers, L.P. | Call | 63.700 | -2,00 | 7.819 | 8,36 | |||
| 2026-01-28 | 13F | West Michigan Advisors, Llc | 26.705 | 18,52 | 3.278 | 31,03 | ||||
| 2025-09-29 | NP | HCMT - Direxion HCM Tactical Enhanced US ETF | 9.249 | 23,27 | 1.039 | 29,91 | ||||
| 2026-02-10 | 13F | Impact Partnership Wealth, LLC | 15.241 | -5,63 | 1.871 | 4,35 | ||||
| 2026-02-17 | 13F | EFG International AG | 6.907 | 848 | ||||||
| 2026-02-04 | 13F | Swiss Life Asset Management Ltd | 371.370 | -34,76 | 45.582 | -27,87 | ||||
| 2025-09-26 | NP | DIVD - Altrius Global Dividend ETF | 1.437 | 7,64 | 161 | 13,38 | ||||
| 2026-01-30 | 13F | Oakworth Capital, Inc. | 4.689 | -1,24 | 576 | 9,11 | ||||
| 2026-02-10 | 13F | Holderness Investments Co | 10.738 | -0,46 | 1.318 | 10,11 | ||||
| 2026-02-13 | 13F | SYM FINANCIAL Corp | 3.384 | 4,44 | 415 | 15,60 | ||||
| 2025-10-03 | 13F | Jackson Wealth Management, LLC | 0 | -100,00 | 0 | |||||
| 2026-01-13 | 13F | Mayflower Financial Advisors, LLC | 4.322 | 10,42 | 530 | 22,12 | ||||
| 2026-02-17 | 13F | Oxford Asset Management Llp | 2.716 | -72,79 | 333 | -69,95 | ||||
| 2025-11-17 | 13F | IMS Capital Management | 0 | -100,00 | 0 | |||||
| 2026-01-14 | 13F | Tradewinds Capital Management, LLC | 40 | 0,00 | 5 | 0,00 | ||||
| 2026-02-10 | 13F | Seven Springs Wealth Group, LLC | 2.827 | 0,00 | 347 | 10,54 | ||||
| 2026-02-13 | 13F | Acumen Wealth Advisors, LLC | 378 | 46 | ||||||
| 2026-02-04 | 13F | Pandora Wealth, Inc. | 23.000 | 0,00 | 2.823 | 10,58 | ||||
| 2026-01-16 | 13F | First Community Trust Na | 285 | 0,00 | 35 | 9,68 | ||||
| 2026-02-11 | 13F | XML Financial, LLC | 2.046 | 251 | ||||||
| 2026-01-27 | 13F | Regions Financial Corp | 10.470 | 11,48 | 1.285 | 23,32 | ||||
| 2025-11-04 | 13F | Gitterman Wealth Management, LLC | 0 | -100,00 | 0 | |||||
| 2026-01-23 | 13F | Sumitomo Mitsui Trust Holdings, Inc. | 3.269.117 | -1,81 | 401.251 | 8,57 | ||||
| 2026-02-13 | 13F | Sofos Investments, Inc. | 10 | 0,00 | 1 | 0,00 | ||||
| 2026-01-07 | 13F | New England Research & Management, Inc. | 11.700 | 1.436 | ||||||
| 2026-02-19 | 13F | Birchwood Financial Partners, Inc. | 2 | 0 | ||||||
| 2026-01-30 | 13F | Jennison Associates Llc | 889.187 | 500,22 | 109.139 | 563,74 | ||||
| 2026-02-05 | 13F | Cardinal Point Capital Management, ULC | 10.323 | -4,62 | 1.267 | 5,50 | ||||
| 2026-02-06 | 13F | Resona Asset Management Co.,Ltd. | 414.078 | -3,46 | 50.977 | 6,83 | ||||
| 2026-01-30 | 13F | Interchange Capital Partners, LLC | 4.160 | 33,72 | 511 | 47,83 | ||||
| 2026-02-17 | 13F | Cetera Investment Advisers | 407.586 | 4,46 | 50.027 | 15,51 | ||||
| 2026-02-17 | 13F | Jump Financial, LLC | 18.362 | -63,19 | 2.254 | -59,31 | ||||
| 2025-09-26 | NP | JHML - John Hancock Multifactor Large Cap ETF | 23.853 | 0,76 | 2.678 | 6,19 | ||||
| 2026-01-21 | 13F | Sowell Financial Services LLC | 14.373 | 63,33 | 1.764 | 80,74 | ||||
| 2026-02-04 | 13F | Tsfg, Llc | 1.298 | 0,00 | 0 | |||||
| 2026-02-13 | 13F | Ausdal Financial Partners, Inc. | 15.515 | -2,82 | 1.904 | 7,45 | ||||
| 2026-02-17 | 13F | Creative Planning | 329.361 | 8,68 | 40.426 | 20,17 | ||||
| 2026-02-02 | 13F | Danske Bank A/s | 1.153.108 | -3,80 | 141.532 | 6,38 | ||||
| 2025-10-30 | 13F | Traub Capital Management LLC | 0 | -100,00 | 0 | -100,00 | ||||
| 2026-02-17 | 13F | Berkshire Bank | 3.850 | -1,69 | 473 | 8,76 | ||||
| 2025-11-17 | 13F | PDT Partners, LLC | 0 | -100,00 | 0 | |||||
| 2025-10-30 | 13F | Mizuho Securities Co. Ltd. | 0 | -100,00 | 0 | |||||
| 2026-01-16 | 13F | RHS Financial, LLC | 4.482 | 4,79 | 550 | 16,03 | ||||
| 2025-09-26 | NP | FLCPX - Fidelity SAI U.S. Large Cap Index Fund This fund is a listed as child fund of Fmr Llc and if that institution has disclosed ownership in this security, then these positions will not be double counted when calculating total shares and total value | 325.653 | -12,83 | 36.568 | -8,12 | ||||
| 2026-01-30 | 13F | Us Bancorp \de\ | 859.071 | 1,08 | 105.443 | 11,77 | ||||
| 2026-02-13 | 13F | Ostrum Asset Management | 26.496 | -21,08 | 3.252 | -12,72 | ||||
| 2026-02-05 | 13F | Paulson Wealth Management Inc. | 3.887 | 1,75 | 477 | 12,50 | ||||
| 2026-02-17 | 13F | Susquehanna Fundamental Investments, Llc | 33.179 | -54,07 | 4.072 | -49,21 | ||||
| 2026-01-23 | 13F | Gemmer Asset Management LLC | 3.610 | -0,50 | 443 | 10,20 | ||||
| 2025-10-17 | 13F | FSC Wealth Advisors, LLC | 0 | -100,00 | 0 | |||||
| 2026-01-23 | 13F | Monarch Capital Management Inc/ | 43.527 | -1,55 | 5.342 | 8,86 | ||||
| 2026-02-06 | 13F | McKinley Carter Wealth Services, Inc. | 3.100 | 0,00 | 380 | 10,47 | ||||
| 2026-01-21 | 13F | Newbridge Financial Services Group, Inc. | 257 | 31,79 | 32 | 47,62 | ||||
| 2026-01-23 | 13F | Assetmark, Inc | 144.683 | -7,32 | 17.758 | 2,48 | ||||
| 2026-02-09 | 13F | Optimist Retirement Group LLC | 21.112 | 0,00 | 2.591 | 10,58 | ||||
| 2026-02-09 | 13F | Wellington Shields Capital Management, LLC | 517 | 0,39 | 63 | 10,53 | ||||
| 2026-01-15 | 13F | Jamison Private Wealth Management, Inc. | 31.727 | 0,87 | 3.894 | 11,54 | ||||
| 2026-03-16 | 13F | Bank of New Hampshire | 1.400 | 0,00 | 172 | 10,32 | ||||
| 2026-01-29 | 13F | TrimTabs Asset Management, LLC | 141.974 | 2,38 | 17.426 | 13,21 | ||||
| 2025-09-26 | NP | FLCOX - Fidelity Large Cap Value Index Fund This fund is a listed as child fund of Fmr Llc and if that institution has disclosed ownership in this security, then these positions will not be double counted when calculating total shares and total value | 374.964 | -31,74 | 42.105 | -28,05 | ||||
| 2026-02-13 | 13F | AlTi Global, Inc. | 0 | -100,00 | 0 | |||||
| 2026-02-17 | 13F | Advanced Portfolio Management, LLC | 0 | -100,00 | 0 | |||||
| 2026-02-02 | 13F | Ashton Thomas Securities, Llc | 2.049 | 13,08 | 251 | 25,50 | ||||
| 2026-01-27 | 13F | GHP Investment Advisors, Inc. | 12.642 | -0,21 | 1.552 | 10,31 | ||||
| 2025-11-14 | 13F | BlueCrest Capital Management Ltd | 0 | -100,00 | 0 | |||||
| 2026-01-13 | 13F | Stephens Consulting, LLC | 2.881 | 0,00 | 354 | 10,66 | ||||
| 2026-01-28 | 13F | Migdal Insurance & Financial Holdings Ltd. | 259.000 | 0,00 | 32 | 10,71 | ||||
| 2026-01-14 | 13F | Nova Wealth Management, Inc. | 73 | 0,00 | 9 | 0,00 | ||||
| 2026-02-12 | 13F | Keel Point, LLC | 7.472 | 24,06 | 917 | 37,28 | ||||
| 2026-02-12 | 13F | Continental Advisors Llc | 32.867 | -4,36 | 4.034 | 5,77 | ||||
| 2026-02-11 | 13F | Jpmorgan Chase & Co | Put | 560.100 | 105,09 | 68.747 | 126,78 | |||
| 2026-01-14 | 13F | Waycross Partners, Llc | 5.732 | 0,00 | 704 | 10,53 | ||||
| 2026-02-13 | 13F | Ariadne Wealth Management, LP | 6.679 | 8,50 | 1.014 | 31,56 | ||||
| 2026-01-20 | 13F | Savvy Advisors, Inc. | 8.806 | 57,53 | 1.081 | 74,19 | ||||
| 2026-02-13 | 13F | Wbi Investments, Inc. | 5.181 | -40,68 | 636 | -34,47 | ||||
| 2026-01-09 | 13F | IFS Advisors, LLC | 24 | 0,00 | 3 | 50,00 | ||||
| 2026-02-11 | 13F | Jpmorgan Chase & Co | 23.035.763 | 8,84 | 2.827.410 | 20,35 | ||||
| 2026-02-04 | 13F | Nwam Llc | 13.239 | -6,60 | 1.797 | 4,29 | ||||
| 2026-02-11 | 13F | Jpmorgan Chase & Co | Call | 276.000 | 12,88 | 33.876 | 24,82 | |||
| 2026-02-17 | 13F | Tudor Investment Corp Et Al | Call | 17.300 | -60,50 | 2.123 | -56,33 | |||
| 2026-02-20 | 13F | Sunbelt Securities, Inc. | 11.508 | 1,91 | 1.412 | 12,69 | ||||
| 2026-02-12 | 13F | IFC & Insurance Marketing, Inc. | 36 | 0 | ||||||
| 2026-02-13 | 13F | Northwest Bancshares, Inc. | 1.920 | 236 | ||||||
| 2026-02-14 | 13F | Frec Markets, Inc. | 6.157 | 756 | ||||||
| 2026-02-17 | 13F | Tudor Investment Corp Et Al | Put | 8.700 | -76,92 | 1.068 | -74,50 | |||
| 2026-02-13 | 13F | Kempen Capital Management N.v. | 267.702 | 1,21 | 32.858 | 11,91 | ||||
| 2026-02-11 | 13F | West Family Investments, Inc. | 12.362 | 0,00 | 1.517 | 10,57 | ||||
| 2026-01-14 | 13F | Wincap Financial Llc | 5.507 | 1,83 | 676 | 12,50 | ||||
| 2026-02-10 | 13F | Phillips Wealth Planners LLC | 3.908 | 71,55 | 505 | 95,35 | ||||
| 2026-02-13 | 13F | Banco Santander, S.A. | 261.844 | 96,88 | 32.139 | 117,71 | ||||
| 2026-01-23 | 13F | Whitener Capital Management, Inc. | 8.879 | 1,92 | 1.090 | 12,62 | ||||
| 2026-02-17 | 13F | BTG Pactual Asset Management US LLC | 2.691 | 330 | ||||||
| 2026-02-12 | 13F | Lansforsakringar Fondforvaltning AB (publ) | 692.315 | 16,46 | 84.975 | 28,78 | ||||
| 2025-09-26 | NP | UOPIX - Ultranasdaq-100 Profund Investor Class | 62.018 | 16,21 | 6.964 | 22,50 | ||||
| 2026-01-07 | 13F | Significant Wealth Partners LLC | 3.213 | -50,37 | 394 | -45,13 | ||||
| 2026-01-22 | 13F | Personal Cfo Solutions, Llc | 4.572 | 1,69 | 561 | 12,42 | ||||
| 2026-02-11 | 13F | Sunrise Financial Services, LLC | 27 | 3 | ||||||
| 2025-09-29 | NP | QYLG - Global X Nasdaq 100 Covered Call & Growth ETF This fund is a listed as child fund of Mirae Asset Global Investments Co., Ltd. and if that institution has disclosed ownership in this security, then these positions will not be double counted when calculating total shares and total value | 7.677 | -4,42 | 862 | 0,82 | ||||
| 2026-01-12 | 13F | Brucke Financial, Inc. | 3.222 | -8,54 | 396 | -6,40 | ||||
| 2026-01-14 | 13F | Bennett Associates Wealth Management | 1.728 | 212 | ||||||
| 2026-01-16 | 13F | Tema Etfs Llc | 58.114 | -5,41 | 7.133 | 4,59 | ||||
| 2026-02-04 | 13F | Paradigm Asset Management Co Llc | 900 | 0,00 | 110 | 11,11 | ||||
| 2026-01-15 | 13F | Fifth Third Wealth Advisors LLC | 16.859 | 24,56 | 2.069 | 37,75 | ||||
| 2026-02-11 | 13F | Fox Run Management, L.l.c. | 2.896 | -76,38 | 355 | -73,90 | ||||
| 2026-01-20 | 13F | Independence Bank of Kentucky | 709 | -5,47 | 87 | 4,82 | ||||
| 2026-02-17 | 13F | Laidlaw Wealth Management LLC | 1.908 | 234 | ||||||
| 2026-01-12 | 13F | Avanza Fonder AB | 130.929 | 3,06 | 16.070 | 13,96 | ||||
| 2026-02-10 | 13F | Moors & Cabot, Inc. | 20.407 | 4,86 | 2.505 | 15,93 | ||||
| 2026-01-23 | 13F | Steigerwald, Gordon & Koch Inc. | 1.582 | 7,40 | 194 | 19,02 | ||||
| 2026-02-09 | 13F | Frazier Financial Advisors, LLC | 32 | 3.100,00 | 4 | |||||
| 2026-01-23 | 13F/A | HF Advisory Group, LLC | 20.576 | 3,58 | 2.525 | 14,56 | ||||
| 2026-01-23 | 13F | FSM Wealth Advisors, LLC | 2.640 | 12,48 | 324 | 24,23 | ||||
| 2026-02-17 | 13F | Hollow Brook Wealth Management LLC | 4.434 | -7,04 | 544 | 2,84 | ||||
| 2026-01-20 | 13F | Trust Co Of Toledo Na /oh/ | 17.510 | 24,63 | 2.149 | 37,84 | ||||
| 2026-02-10 | 13F | Intellectus Partners, LLC | 10.647 | -2,36 | 1.307 | 7,93 | ||||
| 2026-02-03 | 13F | Providence First Trust Co | 6.574 | 807 | ||||||
| 2025-09-26 | NP | BKLC - BNY Mellon US Large Cap Core Equity ETF | 84.434 | 26,54 | 9.481 | 33,38 | ||||
| 2026-02-04 | 13F | Valeo Financial Advisors, LLC | 13.234 | 0,82 | 1.624 | 11,46 | ||||
| 2026-02-13 | 13F | Toroso Investments, LLC | 165.471 | -7,00 | 20.310 | 2,84 | ||||
| 2026-01-21 | 13F | Raleigh Capital Management Inc. | 8.640 | -14,96 | 1.060 | -5,94 | ||||
| 2026-02-13 | 13F | Neuberger Berman Group LLC | 1.359.444 | -14,15 | 166.880 | -5,12 | ||||
| 2026-02-10 | 13F | Peak Retirement Planning, Inc. | 16.607 | 8,48 | 2.038 | 19,95 | ||||
| 2026-01-14 | 13F | Bourne Lent Asset Management Inc | 3.480 | 0,00 | 427 | 10,62 | ||||
| 2026-02-05 | 13F | AlphaCore Capital LLC | 17.327 | 42,87 | 2.127 | 57,95 | ||||
| 2025-09-26 | NP | YOKE - Yoke Core ETF | 0 | -100,00 | 0 | -100,00 | ||||
| 2025-10-24 | 13F | Hemington Wealth Management | 998 | 9,31 | 0 | |||||
| 2026-02-10 | 13F | Argent Trust Co | 87.115 | -2,61 | 10.692 | 7,70 | ||||
| 2025-09-29 | NP | RSP - Invesco S&P 500 Equal Weight ETF This fund is a listed as child fund of Invesco Ltd. and if that institution has disclosed ownership in this security, then these positions will not be double counted when calculating total shares and total value | 1.292.730 | 4,85 | 145.161 | 10,51 | ||||
| 2026-02-04 | 13F | Kepler Cheuvreux (Suisse) SA | 82.609 | 10.139 | ||||||
| 2026-02-06 | 13F | Verde Capital Management | 10.136 | 2,48 | 1.244 | 13,40 | ||||
| 2026-02-17 | 13F | Northern Trust Corp | 14.057.956 | -1,81 | 1.725.474 | 8,58 | ||||
| 2026-02-17 | 13F | Ibex Wealth Advisors | 68.554 | 390,09 | 8.414 | 442,14 | ||||
| 2026-02-02 | 13F | Blalock Williams, Llc | 4.685 | -2,76 | 575 | 7,68 | ||||
| 2026-02-18 | 13F | Caitlin John, LLC | 447 | 29,57 | 55 | 42,11 | ||||
| 2026-01-23 | 13F | BSW Wealth Partners | 10.854 | -0,17 | 1.332 | 10,45 | ||||
| 2025-09-26 | NP | FITLX - Fidelity U.S. Sustainability Index Fund This fund is a listed as child fund of Fmr Llc and if that institution has disclosed ownership in this security, then these positions will not be double counted when calculating total shares and total value | 179.662 | 6,87 | 20.174 | 12,64 | ||||
| 2026-02-05 | 13F | Northwestern Mutual Investment Management Company, Llc | 39.643 | 0,24 | 4.866 | 10,85 | ||||
| 2026-01-26 | 13F | Quadrant Private Wealth Management, LLC | 2.754 | 338 | ||||||
| 2026-01-23 | 13F | Warburton Capital Management, LLC | 1.726 | 0 | ||||||
| 2026-02-12 | 13F | Oak Associates Ltd /oh/ | 86.776 | 1,88 | 10.651 | 118.233,33 | ||||
| 2026-02-17 | 13F | NewSquare Capital LLC | 43.082 | -28,04 | 5.288 | -20,44 | ||||
| 2026-01-29 | 13F | D.a. Davidson & Co. | 66.923 | 8,35 | 8.214 | 19,82 | ||||
| 2026-01-20 | 13F | Stratos Wealth Partners, LTD. | 96.146 | -2,35 | 11.801 | 7,98 | ||||
| 2026-02-10 | 13F | Peapack Gladstone Financial Corp | 9.183 | 45,35 | 1 | |||||
| 2026-01-26 | 13F | KBC Group NV | 3.244.626 | 9,58 | 398 | 21,34 | ||||
| 2026-01-20 | 13F | Signaturefd, Llc | 25.899 | 1,88 | 3.179 | 12,66 | ||||
| 2026-02-13 | 13F | Sei Investments Co | 1.092.715 | -12,72 | 134.119 | -3,50 | ||||
| 2026-01-12 | 13F | CVA Family Office, LLC | 2.394 | 0,21 | 294 | 10,57 | ||||
| 2026-02-13 | 13F | Adams Diversified Equity Fund, Inc. | 177.100 | 21.737 | ||||||
| 2026-01-27 | 13F | Novem Group | 2.224 | 3,97 | 273 | 14,77 | ||||
| 2026-02-05 | 13F | Beese Fulmer Investment Management, Inc. | 3.398 | 3,76 | 417 | 14,88 | ||||
| 2026-02-06 | 13F | IFP Advisors, Inc | 10.139 | -7,85 | 1.244 | 1,88 | ||||
| 2026-01-14 | 13F | Woodward Diversified Capital, Llc | 3.655 | 27,53 | 449 | 40,88 | ||||
| 2026-02-02 | 13F | Nkcfo Llc | 60.650 | -2,63 | 7 | 16,67 | ||||
| 2026-01-23 | 13F | Tectonic Advisors Llc | 97.332 | 3,90 | 11.947 | 14,89 | ||||
| 2026-01-08 | 13F | NorthCrest Asset Manangement, LLC | 122.727 | 1,24 | 14.519 | 2,56 | ||||
| 2026-01-23 | 13F | Bellevue Asset Management, Llc | 682 | 0,44 | 84 | 10,67 | ||||
| 2026-01-23 | 13F | Family Investment Center, Inc. | 2.587 | 16,95 | 318 | 29,39 | ||||
| 2026-02-17 | 13F | Snowden Capital Advisors LLC | 19.715 | 10,95 | 2.420 | 22,67 | ||||
| 2026-02-11 | 13F | Total Wealth Planning & Management, Inc. | 4.704 | -1,67 | 577 | 8,87 | ||||
| 2026-01-20 | 13F | Wealth Management Associates, Inc. | 2.585 | 12,39 | 317 | 24,31 | ||||
| 2025-09-29 | NP | QYLD - Global X NASDAQ 100 Covered Call ETF This fund is a listed as child fund of Mirae Asset Global Investments Co., Ltd. and if that institution has disclosed ownership in this security, then these positions will not be double counted when calculating total shares and total value | 604.728 | -19,80 | 67.905 | -15,47 | ||||
| 2026-02-17 | 13F | Man Group plc | 1.725.112 | -1,79 | 211.740 | 8,60 | ||||
| 2026-01-15 | 13F | Royal Fund Management, LLC | 9.181 | 36,97 | 1.127 | 51,55 | ||||
| 2026-02-17 | 13F | Integrated Advisors Network LLC | 7.826 | -11,46 | 961 | -2,14 | ||||
| 2025-09-26 | NP | FLCSX - Fidelity Large Cap Stock Fund This fund is a listed as child fund of Fmr Llc and if that institution has disclosed ownership in this security, then these positions will not be double counted when calculating total shares and total value | 35.084 | -0,05 | 3.940 | 5,35 | ||||
| 2026-01-21 | 13F | Tandem Investment Partners LLC | 2.130 | 261 | ||||||
| 2025-11-14 | 13F | ICONIQ Capital, LLC | 0 | -100,00 | 0 | -100,00 | ||||
| 2025-11-14 | 13F | Blue Capital, Inc. | 0 | -100,00 | 0 | |||||
| 2026-02-17 | 13F | Maryland State Retirement & Pension System | 62.091 | 0,49 | 7.621 | 11,13 | ||||
| 2026-01-23 | 13F | Twelve Points Wealth Management LLC | 4.088 | -24,84 | 495 | -17,91 | ||||
| 2026-02-10 | 13F | Mitsubishi UFJ Morgan Stanley Securities Co., Ltd. | 2.080 | 255 | ||||||
| 2026-01-23 | 13F | Inlight Wealth Management, LLC | 103 | 0,00 | 13 | 9,09 | ||||
| 2026-02-17 | 13F | Woodline Partners LP | 467.295 | 6,23 | 57.356 | 17,46 | ||||
| 2026-02-11 | 13F | Cookson Peirce & Co Inc | 11.275 | 12,24 | 1.384 | 24,15 | ||||
| 2026-02-17 | 13F | Atom Investors LP | 0 | -100,00 | 0 | -100,00 | ||||
| 2026-01-06 | 13F | Nelson, Van Denburg & Campbell Wealth Management Group, LLC | 8.116 | 2,92 | 935 | 12,53 | ||||
| 2026-01-23 | 13F | High Net Worth Advisory Group LLC | 3.936 | 0,00 | 483 | 10,78 | ||||
| 2026-02-17 | 13F | Fullerton Fund Management Co Ltd | 3.922 | 481 | ||||||
| 2026-01-09 | 13F | Dynamic Advisor Solutions LLC | 53.825 | -2,62 | 6.606 | 7,68 | ||||
| 2026-02-17 | 13F | Laird Norton Trust Company, Llc | 47.679 | 5.852 | ||||||
| 2026-02-04 | 13F | Advisor OS, LLC | 5.693 | 8,65 | 699 | 20,14 | ||||
| 2026-02-10 | 13F | Greenwich Wealth Management LLC | 6.511 | -3,90 | 1 | |||||
| 2026-02-05 | 13F | Center for Financial Planning, Inc. | 115 | 0,00 | 14 | 16,67 | ||||
| 2026-01-29 | 13F | Wealth Alliance Advisory Group, LLC | 2.277 | -4,41 | 279 | 5,68 | ||||
| 2026-01-15 | 13F | Saxony Capital Management, LLC | 1.680 | 206 | ||||||
| 2025-09-26 | NP | RTDAX - Multifactor U.S. Equity Fund Class A | 8.911 | 13,63 | 1.001 | 19,76 | ||||
| 2026-02-10 | 13F | Intech Investment Management Llc | 293.214 | 19,88 | 35.989 | 32,56 | ||||
| 2026-02-17 | 13F | Kemnay Advisory Services Inc. | 494 | 61 | ||||||
| 2025-09-26 | NP | LQAI - LG QRAFT AI-Powered U.S. Large Cap Core ETF | 0 | -100,00 | 0 | -100,00 | ||||
| 2026-01-15 | 13F | Westend Capital Management LLC | 2.271 | 0,00 | 279 | 10,32 | ||||
| 2025-10-24 | 13F | Opal Wealth Advisors, LLC | 0 | -100,00 | 0 | -100,00 | ||||
| 2025-09-26 | NP | FEKFX - Fidelity Equity-Income K6 Fund This fund is a listed as child fund of Fmr Llc and if that institution has disclosed ownership in this security, then these positions will not be double counted when calculating total shares and total value | 38.889 | 8,61 | 4.367 | 14,47 | ||||
| 2026-02-12 | 13F | Swiss National Bank | 3.400.200 | -5,17 | 417.341 | 4,86 | ||||
| 2026-02-05 | 13F | Bessemer Group Inc | 58.372 | 10,21 | 7 | 40,00 | ||||
| 2026-02-17 | 13F | Lakeshore Financial Planning, Inc. | 1.754 | 215 | ||||||
| 2026-02-05 | 13F | Atria Investments Llc | 87.963 | 17,19 | 10.797 | 29,59 | ||||
| 2026-02-10 | 13F | Commonwealth Of Pennsylvania Public School Empls Retrmt Sys | 288.589 | -3,15 | 35.421 | 7,10 | ||||
| 2026-01-15 | 13F | Moody Lynn & Lieberson, Llc | 97.302 | 46,20 | 11.943 | 61,66 | ||||
| 2026-02-10 | 13F | Axq Capital, Lp | 0 | -100,00 | 0 | |||||
| 2026-02-13 | 13F | 1248 Management, LLC | 444 | 0,00 | 54 | 10,20 | ||||
| 2025-11-14 | 13F | PineBridge Investments, L.P. | 180.844 | -12,95 | 20.074 | -12,84 | ||||
| 2026-01-29 | 13F | Dunhill Financial, LLC | 6 | 0 | ||||||
| 2025-11-14 | 13F | Credit Capital Investments LLC | 0 | -100,00 | 0 | |||||
| 2026-02-06 | 13F | HighTower Advisors, LLC | 1.661.355 | -0,86 | 203.915 | 9,62 | ||||
| 2026-02-10 | 13F | Basepoint Wealth LLC | 431 | 53 | ||||||
| 2026-02-13 | 13F | Seneschal Advisors, LLC | 110 | 0,00 | 14 | 8,33 | ||||
| 2026-01-28 | 13F | Oversea-Chinese Banking CORP Ltd | 2.484 | 305 | ||||||
| 2025-09-26 | NP | PCLVX - PACE Large Co Value Equity Investments Class P | 111.403 | -11,27 | 12.509 | -6,48 | ||||
| 2026-02-12 | 13F | Triumph Capital Management | 3.352 | 1,15 | 411 | 11,99 | ||||
| 2026-01-14 | 13F | Neumann Capital Management, LLC | 36.890 | -0,27 | 4.528 | 10,28 | ||||
| 2025-09-26 | NP | GGHCX - INVESCO Health Care Fund Class A | 256.393 | 14,52 | 28.790 | 20,70 | ||||
| 2026-02-13 | 13F | Alberta Investment Management Corp | 442.000 | 0,00 | 54.251 | 10,58 | ||||
| 2025-10-31 | 13F | ARGA Investment Management, LP | 0 | -100,00 | 0 | -100,00 | ||||
| 2026-01-28 | 13F | Morton Brown Family Wealth, LLC | 387 | 0,78 | 47 | 11,90 | ||||
| 2026-01-23 | 13F | Patton Fund Management, Inc. | 59.605 | 2.693,11 | 7.316 | 2.999,58 | ||||
| 2026-01-09 | 13F | S.E.E.D. Planning Group LLC | 2.000 | 0,00 | 245 | 10,36 | ||||
| 2026-02-05 | 13F | Navalign, LLC | 1.114 | 137 | ||||||
| 2026-01-26 | 13F | Austin Wealth Management, LLC | 2.014 | 2,13 | 243 | 1,67 | ||||
| 2026-02-12 | 13F | Rossby Financial, LCC | 926 | 12,24 | 114 | 24,18 | ||||
| 2026-01-16 | 13F | McLean Asset Management Corp | 1.797 | 0,73 | 223 | 9,90 | ||||
| 2026-02-10 | 13F | Godfrey Financial Associates, Inc. | 279 | 34 | ||||||
| 2025-09-29 | NP | KCGIX - Knights of Columbus Large Cap Growth Fund I Shares | 12.246 | 1.375 | ||||||
| 2026-01-27 | 13F | Forum Financial Management, LP | 16.780 | 0,08 | 2.060 | 10,64 | ||||
| 2026-01-29 | 13F | High Point Wealth Management, LLC | 3.165 | 388 | ||||||
| 2026-01-15 | 13F | Hofer & Associates. Inc | 1.903 | 234 | ||||||
| 2026-02-14 | 13F | American Trust | 2.526 | 32,53 | 310 | 46,92 | ||||
| 2025-09-29 | NP | QCLR - Global X NASDAQ 100 Collar 95-110 ETF This fund is a listed as child fund of Mirae Asset Global Investments Co., Ltd. and if that institution has disclosed ownership in this security, then these positions will not be double counted when calculating total shares and total value | 200 | 8,11 | 22 | 15,79 | ||||
| 2026-02-10 | 13F | DT Investment Partners, LLC | 2.040 | 5,15 | 250 | 16,28 | ||||
| 2026-02-13 | 13F | Kcm Investment Advisors Llc | 12.910 | 8,65 | 1.585 | 20,18 | ||||
| 2026-02-02 | 13F | Hussman Strategic Advisors, Inc. | 14.700 | -30,00 | 1.804 | -22,61 | ||||
| 2026-02-13 | 13F | Missouri Trust & Investment Co | 1.019 | 0,00 | 125 | 10,62 | ||||
| 2026-02-02 | 13F | Truist Financial Corp | 309.940 | -0,13 | 38.042 | 10,44 | ||||
| 2026-02-17 | 13F | California State Teachers Retirement System | 1.955.264 | -1,82 | 239.989 | 8,56 | ||||
| 2026-02-14 | 13F | Howe & Rusling Inc | 4.676 | 0,45 | 574 | 11,05 | ||||
| 2026-02-17 | 13F | Vestal Point Capital, LP | 50.000 | 6.137 | ||||||
| 2026-02-11 | 13F | CenterBook Partners LP | 6.940 | 852 | ||||||
| 2025-10-14 | 13F | S.A. Mason LLC | 0 | -100,00 | 0 | -100,00 | ||||
| 2026-02-12 | 13F | Xponance, Inc. | 237.491 | 5,56 | 29.150 | 16,73 | ||||
| 2026-01-12 | 13F | VisionPoint Advisory Group, LLC | 6.527 | 34,44 | 801 | 48,88 | ||||
| 2026-02-17 | 13F | Palisade Capital Management Llc/nj | 2.500 | -0,36 | 307 | 10,07 | ||||
| 2026-02-13 | 13F | Healthcare Of Ontario Pension Plan Trust Fund | 1.762.692 | 293,04 | 216.353 | 334,61 | ||||
| 2025-09-26 | NP | FHEQ - Fidelity Hedged Equity ETF | 29.899 | -26,43 | 3.357 | -22,45 | ||||
| 2026-02-13 | 13F | Mml Investors Services, Llc | 210.874 | 7,65 | 25.883 | 19,03 | ||||
| 2026-01-14 | 13F | First County Bank /CT/ | 17.353 | -2,19 | 2.130 | 8,13 | ||||
| 2026-02-12 | 13F | Te Ahumairangi Investment Management Ltd | 0 | -100,00 | 0 | |||||
| 2025-11-14 | 13F | Diadema Partners Lp | 0 | -100,00 | 0 | |||||
| 2026-01-23 | 13F | Gibbs Wealth Management | 4.208 | -9,97 | 510 | -1,74 | ||||
| 2026-01-09 | 13F | Montecito Bank & Trust | 5.564 | -0,25 | 683 | 10,18 | ||||
| 2026-01-21 | 13F | Canton Hathaway, LLC | 345 | 0,00 | 42 | 10,53 | ||||
| 2026-02-03 | 13F | RFG Advisory, LLC | 13.205 | 2,19 | 1.621 | 12,97 | ||||
| 2025-09-29 | NP | PEVC - Pacer PE/VC ETF | 13 | 1 | ||||||
| 2026-01-20 | 13F | Ethos Financial Group, LLC | 1.662 | -23,02 | 204 | -15,06 | ||||
| 2026-02-12 | 13F | McMillan Office, Inc. | 2.540 | 312 | ||||||
| 2026-02-17 | 13F | Jain Global LLC | 85.578 | 10.504 | ||||||
| 2026-01-26 | 13F | Main Street Group, LTD | 0 | -100,00 | 0 | -100,00 | ||||
| 2026-01-23 | 13F | Atala Financial Inc | 1.851 | -4,34 | 227 | 6,07 | ||||
| 2026-02-05 | 13F | John G Ullman & Associates Inc | 6.995 | 0,00 | 859 | 10,57 | ||||
| 2025-09-26 | NP | SUNAMERICA SERIES TRUST - SA JPMorgan Global Equities Portfolio Class 1 | 19.900 | 40,94 | 2.235 | 48,54 | ||||
| 2026-02-13 | 13F | Potomac Fund Management Inc /adv | 17.122 | -9,59 | 2.102 | -0,05 | ||||
| 2026-01-30 | 13F | Simplicity Wealth,LLC | 8.621 | 1,67 | 1.058 | 12,43 | ||||
| 2026-02-06 | 13F | Harmony Asset Management Llc | 3.887 | 0,93 | 477 | 11,71 | ||||
| 2026-01-22 | 13F | Charter Trust Co | 2.795 | -4,25 | 343 | 5,86 | ||||
| 2025-11-14 | 13F | Sagard Holdings Management Inc. | 111 | 0,00 | 12 | 0,00 | ||||
| 2026-02-10 | 13F | Shepherd Street Advisors LLC | 4.352 | 534 | ||||||
| 2026-02-12 | 13F | Advocate Investing Services LLC | 25 | 3 | ||||||
| 2026-01-20 | 13F | J2 Capital Management Inc | 3.677 | -2,57 | 451 | 7,89 | ||||
| 2026-02-13 | 13F | Chevy Chase Trust Holdings, Inc. | 634.824 | -0,65 | 77.918 | 9,86 | ||||
| 2026-02-17 | 13F | Credit Agricole S A | 911.872 | 28,95 | 111.923 | 42,59 | ||||
| 2026-01-23 | 13F | Sage Mountain Advisors LLC | 8.797 | 2,24 | 1.080 | 13,10 | ||||
| 2026-02-05 | 13F | Avantax Planning Partners, Inc. | 3.632 | 9,96 | 446 | 21,58 | ||||
| 2026-02-12 | 13F | StoneX Group Inc. | 4.173 | -2,95 | 512 | 7,34 | ||||
| 2025-09-26 | NP | AIM EQUITY FUNDS (INVESCO EQUITY FUNDS) - Invesco Oppenheimer Main Street Fund Class C | 374.427 | 0,00 | 42.044 | 5,40 | ||||
| 2026-02-17 | 13F | Cape Investment Advisory, Inc. | 638 | 1.257,45 | 77 | 1.420,00 | ||||
| 2026-01-26 | 13F | Paradigm Financial Partners, Llc | 7.429 | 1,42 | 912 | 12,05 | ||||
| 2026-01-22 | 13F | Financial Consulate, Inc | 236 | 85,83 | 29 | 100,00 | ||||
| 2025-09-26 | NP | FSUMX - Fidelity Series Sustainable U.S. Market Fund | 1.955 | 0,62 | 220 | 5,80 | ||||
| 2026-01-15 | 13F | Capital Advisors Inc/ok | 3.241 | 29,54 | 398 | 43,32 | ||||
| 2026-01-16 | 13F | Crewe Advisors LLC | 731 | 4,43 | 90 | 15,58 | ||||
| 2026-02-02 | 13F | Robertson Stephens Wealth Management, LLC | 51.045 | 1.515,35 | 6.265 | 1.690,00 | ||||
| 2026-02-23 | 13F | Mv Capital Management, Inc. | 7.568 | 0,09 | 929 | 10,61 | ||||
| 2025-09-26 | NP | NUDV - Nuveen ESG Dividend ETF | 4.581 | 11,84 | 514 | 17,89 | ||||
| 2026-02-17 | 13F | Css Llc/il | 3.509 | -56,46 | 431 | -51,90 | ||||
| 2026-02-11 | 13F | Dearborn Partners Llc | 72.570 | -4,33 | 8.907 | 5,80 | ||||
| 2026-02-11 | 13F | Commonwealth Retirement Investments LLC | 1.602 | -16,69 | 197 | -7,98 | ||||
| 2026-01-29 | 13F | Munich Reinsurance Co Stock Corp in Munich | 657.973 | 8,20 | 81.049 | 20,07 | ||||
| 2026-02-13 | 13F | Pinnacle Wealth Planning Services, Inc. | 7.803 | -1,97 | 958 | 8,38 | ||||
| 2026-02-06 | 13F | Saranac Partners Ltd | 0 | -100,00 | 0 | -100,00 | ||||
| 2026-02-17 | 13F | Evergreen Wealth Solutions, LLC | 2.085 | -1,56 | 256 | 8,51 | ||||
| 2025-11-10 | 13F | NWK Group, Inc. | 0 | -100,00 | 0 | |||||
| 2026-02-10 | 13F | CFS Investment Advisory Services, LLC | 11.604 | 1,42 | 1.424 | 2,96 | ||||
| 2026-02-03 | 13F | SBI Securities Co., Ltd. | 19.848 | -1,44 | 2.436 | 8,99 | ||||
| 2026-02-13 | 13F | Fairfield, Bush & Co. | 2.158 | -11,05 | 265 | -1,86 | ||||
| 2025-09-26 | NP | LSVGX - LSV Global Value Fund Institutional Class Shares | 8.000 | 0,00 | 898 | 5,40 | ||||
| 2026-01-12 | 13F | Kozak & Associates, Inc. | 3.000 | 0,00 | 363 | -2,42 | ||||
| 2026-02-12 | 13F | Wescott Financial Advisory Group, LLC | 3.668 | 3,44 | 450 | 14,50 | ||||
| 2026-01-29 | 13F | China Universal Asset Management Co., Ltd. | 175.928 | 9,17 | 21.593 | 20,71 | ||||
| 2025-09-26 | NP | TILVX - TIAA-CREF Large-Cap Value Index Fund Institutional Class | 362.439 | -30,93 | 40.698 | -27,20 | ||||
| 2026-01-08 | 13F | Adirondack Trust Co | 1.792 | -1,65 | 220 | 8,42 | ||||
| 2026-02-09 | 13F | Smithfield Trust Co | 1.260 | 0,00 | 0 | |||||
| 2026-02-26 | 13F | Anchor Investment Management, LLC | 300 | 0,00 | 37 | 9,09 | ||||
| 2026-02-09 | 13F | Atlantic Trust, LLC | 615 | -14,23 | 75 | -5,06 | ||||
| 2026-02-12 | 13F | Xxi Wealth, Llc | 7.012 | 861 | ||||||
| 2026-02-13 | 13F | TFB Advisors LLC | 2.791 | -1,24 | 343 | 2,40 | ||||
| 2026-02-02 | 13F | Citizens Business Bank | 7.641 | -0,60 | 938 | 9,85 | ||||
| 2026-02-12 | 13F | Insigneo Advisory Services, Llc | 7.023 | -2,47 | 862 | 7,76 | ||||
| 2026-01-22 | 13F | Red Tortoise LLC | 224 | 0,00 | 27 | 12,50 | ||||
| 2026-01-30 | 13F | State of New Jersey Common Pension Fund D | 423.967 | -2,54 | 52.038 | 7,77 | ||||
| 2026-02-11 | 13F | Los Angeles Capital Management Llc | 3.168.875 | -17,59 | 375.322 | -12,07 | ||||
| 2025-09-26 | NP | DAACX - Diversified Equity Fund | 4.448 | -34,15 | 499 | -23,93 | ||||
| 2026-01-21 | 13F | SJS Investment Consulting Inc. | 368 | -25,20 | 45 | -16,67 | ||||
| 2026-02-02 | 13F | Avidian Wealth Solutions, LLC | 11.054 | 4,74 | 1.357 | 15,80 | ||||
| 2026-02-10 | 13F | Lido Advisors, LLC | 123.364 | 1,77 | 14.515 | 7,87 | ||||
| 2026-02-06 | 13F | Covestor Ltd | 1.399 | -26,98 | 0 | |||||
| 2026-02-17 | 13F | Main Street Financial Solutions, LLC | 2.242 | -31,33 | 275 | -24,03 | ||||
| 2026-02-05 | 13F | Roberts Glore & Co Inc /il/ | 10.744 | -6,44 | 1.319 | 3,45 | ||||
| 2026-02-10 | 13F | Lido Advisors, LLC | Put | 3.300 | 0,00 | 405 | 10,66 | |||
| 2026-02-12 | 13F | Ankerstar Wealth, LLC | 18 | 2 | ||||||
| 2026-01-16 | 13F | Linden Thomas Advisory Services, LLC | 49.553 | 2,65 | 6.082 | 13,51 | ||||
| 2026-01-20 | 13F | Thurston, Springer, Miller, Herd & Titak, Inc. | 764 | 1.023,53 | 94 | 1.228,57 | ||||
| 2026-02-12 | 13F | Edgewood Management Llc | 27.837 | 0,00 | 3.417 | 10,59 | ||||
| 2026-02-10 | 13F | BlackDiamond Wealth Management Inc. | 1.730 | -23,52 | 262 | 4,38 | ||||
| 2026-01-27 | 13F | Keeler & Nadler Financial Planning & Wealth Management | 2.080 | 0,00 | 255 | 10,87 | ||||
| 2026-02-17 | 13F | Sherbrooke Park Advisers Llc | 0 | -100,00 | 0 | |||||
| 2026-02-13 | 13F | Bridgewater Associates, LP | 292.406 | -24,12 | 35.890 | -16,10 | ||||
| 2026-02-11 | 13F | Allianz Asset Management GmbH | 4.030.530 | -30,18 | 494.707 | -22,80 | ||||
| 2026-02-12 | 13F | Steward Partners Investment Advisory, Llc | 71.364 | 0,72 | 8.759 | 11,38 | ||||
| 2026-02-20 | 13F | Kovitz Investment Group Partners, LLC | 5.270 | -95,57 | 647 | -95,11 | ||||
| 2026-02-11 | 13F | Allianz Asset Management GmbH | Put | 67.600 | 11,55 | 8.297 | 23,36 | |||
| 2026-02-11 | 13F | Allianz Asset Management GmbH | Call | 47.300 | 11,56 | 5.806 | 23,35 | |||
| 2026-02-17 | 13F | Bank Of America Corp /de/ | Put | 0 | -100,00 | 0 | ||||
| 2026-01-27 | 13F | MASTERINVEST Kapitalanlage GmbH | 22.389 | 5,78 | 2.758 | 17,37 | ||||
| 2026-01-21 | 13F | MBL Wealth, LLC | 3.171 | 389 | ||||||
| 2026-01-27 | 13F | Lodestar Private Asset Management Llc | 2.493 | -13,17 | 306 | -3,77 | ||||
| 2026-01-27 | 13F | Human Investing LLC | 0 | -100,00 | 0 | |||||
| 2026-01-29 | 13F | Quent Capital, LLC | 3.818 | 6,38 | 469 | 17,59 | ||||
| 2026-02-06 | 13F | Larson Financial Group LLC | 9.401 | 13,09 | 1.154 | 25,05 | ||||
| 2026-01-08 | 13F | Occidental Asset Management, LLC | 41.776 | 1,60 | 5.128 | 12,34 | ||||
| 2026-02-13 | 13F | Quattro Advisors LLC | 209 | 26 | ||||||
| 2025-09-29 | NP | UPSD - Aptus Large Cap Upside ETF | 4.956 | 557 | ||||||
| 2026-02-06 | 13F | Vestmark Advisory Solutions, Inc. | 8.160 | 342,76 | 1.002 | 390,69 | ||||
| 2025-11-14 | 13F | Delos Wealth Advisors, LLC | 0 | -100,00 | 0 | -100,00 | ||||
| 2026-02-17 | 13F | Keebeck Wealth Management, LLC | 3.292 | 4,91 | 404 | 16,09 | ||||
| 2025-10-27 | 13F | Arcadia Investment Management Corp/mi | 0 | -100,00 | 0 | -100,00 | ||||
| 2026-02-03 | 13F | Cheviot Value Management, LLC | 728 | 0,69 | 102 | 18,82 | ||||
| 2025-09-29 | NP | KCVIX - Knights of Columbus Large Cap Value Fund I Shares | 40.820 | 46,44 | 4.584 | 54,36 | ||||
| 2026-01-28 | 13F | G&S Capital LLC | 22.876 | -2,61 | 2.808 | 7,67 | ||||
| 2026-02-11 | 13F | PBU - The Pension Fund of Early Childhood & Youth Educators | 95.333 | 22.107 | ||||||
| 2026-01-30 | 13F | Strategic Blueprint, LLC | 2.194 | -28,09 | 269 | -20,41 | ||||
| 2026-02-17 | 13F | Financial Avengers, Inc. | 1.319 | 0,00 | 146 | 0,00 | ||||
| 2026-02-09 | 13F | Kingsview Wealth Management, LLC | 16.463 | -0,30 | 2.021 | 10,26 | ||||
| 2025-11-14 | 13F | Round Rock Advisors, LLC | 0 | -100,00 | 0 | |||||
| 2026-01-22 | 13F | Maseco Llp | 27 | 3 | ||||||
| 2026-02-13 | 13F | Umb Bank N A/mo | 108.101 | -1,17 | 13.268 | 9,28 | ||||
| 2026-01-29 | 13F | Klingman & Associates, LLC | 2.526 | 9,11 | 310 | 21,09 | ||||
| 2026-02-03 | 13F | Sageworth Trust Co | 0 | -100,00 | 0 | |||||
| 2026-01-29 | 13F | LCM Capital Management Inc | 8.770 | -9,40 | 1.076 | 0,19 | ||||
| 2026-02-05 | 13F | Convergence Investment Partners, LLC | 43.686 | 2,87 | 5.362 | 13,75 | ||||
| 2026-02-10 | 13F | Connor, Clark & Lunn Investment Management Ltd. | 2.348 | -85,84 | 288 | -84,35 | ||||
| 2026-02-06 | 13F | First Business Financial Services, Inc. | 1.710 | -5,32 | 210 | 4,50 | ||||
| 2026-02-13 | 13F | Headlands Technologies LLC | 0 | -100,00 | 0 | |||||
| 2026-02-17 | 13F | Bank Of America Corp /de/ | Call | 0 | -100,00 | 0 | ||||
| 2026-02-17 | 13F | Qube Research & Technologies Ltd | Call | 71.400 | 20,81 | 8.764 | 33,58 | |||
| 2026-03-23 | 13F | J. Derek Lewis & Associates Inc. | 2.820 | 346 | ||||||
| 2025-10-28 | 13F | First National Corp /ma/ /adv | 0 | -100,00 | 0 | |||||
| 2026-02-04 | 13F | AGH Wealth Advisors, LLC | 2.011 | -6,51 | 247 | 3,36 | ||||
| 2026-02-17 | 13F | Qube Research & Technologies Ltd | 2.547.038 | -47,25 | 312.623 | -41,67 | ||||
| 2025-10-16 | 13F | Howard Capital Management Group, LLC | 0 | -100,00 | 0 | -100,00 | ||||
| 2026-01-26 | 13F | PDS Planning, Inc | 5.932 | 0,30 | 728 | 10,98 | ||||
| 2026-01-23 | 13F | Creative Capital Management Investments LLC | 3.916 | 0,31 | 481 | 10,85 | ||||
| 2025-11-21 | 13F/A | CIBC Bancorp USA Inc. | 219.986 | 24.418 | ||||||
| 2025-09-29 | NP | KCEVX - Knights of Columbus Long/Short Equity Fund Investor Shares | 28.959 | 95,88 | 3.252 | 106,41 | ||||
| 2026-02-13 | 13F | Cohen & Steers, Inc. | 1.200 | 0,00 | 0 | |||||
| 2025-09-26 | NP | USSCX - Science & Technology Fund Shares | 2.373 | 84,38 | 266 | 94,16 | ||||
| 2026-02-02 | 13F | Mutual Advisors, LLC | 22.172 | -3,51 | 2.721 | -1,91 | ||||
| 2026-01-29 | 13F | Calamos Advisors LLC | 225.569 | -3,89 | 27.686 | 6,28 | ||||
| 2026-02-11 | 13F | Arrowpoint Investment Partners (Singapore) Pte. Ltd. | 19.419 | 2.383 | ||||||
| 2026-02-12 | 13F | Voya Investment Management Llc | 2.747.594 | 34,00 | 337.240 | 48,17 | ||||
| 2026-01-15 | 13F | Bernard Wealth Management Corp. | 50 | 0,00 | 6 | 20,00 | ||||
| 2026-01-26 | 13F | Whittier Trust Co Of Nevada Inc | 34.139 | -1,65 | 4.143 | 5,93 | ||||
| 2026-02-11 | 13F | SlateStone Wealth, LLC | 1.789 | 0 | ||||||
| 2026-02-17 | 13F | J. Goldman & Co LP | Put | 40.000 | 0,00 | 4.910 | 10,56 | |||
| 2026-02-11 | 13F | Everett Harris & Co /ca/ | 1.902 | 0,00 | 233 | 10,43 | ||||
| 2026-02-13 | 13F | Wealth Alliance | 7.049 | -15,25 | 865 | -6,28 | ||||
| 2025-10-09 | 13F | Perkins Coie Trust Co | 0 | -100,00 | 0 | |||||
| 2026-01-13 | 13F | Trust Point Inc. | 3.114 | 2,23 | 382 | 13,02 | ||||
| 2026-01-21 | 13F | Western Financial Corp/CA | 3.947 | -2,74 | 484 | 7,56 | ||||
| 2026-02-17 | 13F | Ancora Advisors, LLC | 4.274 | 49,65 | 525 | 65,30 | ||||
| 2026-02-12 | 13F | Bahl & Gaynor Inc | 0 | -100,00 | 0 | |||||
| 2026-02-06 | 13F/A | Rathbone Brothers plc | 2.965 | 0,68 | 364 | 11,35 | ||||
| 2026-02-10 | 13F | Natixis Advisors, L.p. | 776.239 | 20,09 | 95 | 33,80 | ||||
| 2026-02-17 | 13F | Coastal Bridge Advisors, LLC | 69.616 | 63,73 | 8.545 | 81,06 | ||||
| 2026-02-17 | 13F | Alliancebernstein L.p. | 5.896.300 | 0,17 | 723.712 | 10,76 | ||||
| 2026-02-13 | 13F | Centerpoint Advisors, LLC | 56 | 0,00 | 0 | |||||
| 2026-02-02 | 13F | Sachetta, LLC | 712 | 0,00 | 87 | 10,13 | ||||
| 2026-02-17 | 13F | Two Sigma Advisers, Lp | 52.000 | 146,45 | 6.382 | 172,50 | ||||
| 2026-02-03 | 13F | Farmers & Merchants Investments Inc | 8.478 | -1,97 | 1.041 | 8,45 | ||||
| 2025-09-29 | NP | DUBS - Aptus Large Cap Enhanced Yield ETF | 5.082 | -2,08 | 571 | 3,26 | ||||
| 2026-01-27 | 13F | Benedict Financial Advisors Inc | 12.102 | -2,51 | 1.485 | 7,84 | ||||
| 2025-11-14 | 13F | Point72 (DIFC) Ltd | Put | 0 | -100,00 | 0 | -100,00 | |||
| 2025-09-26 | NP | REAYX - Equity Income Fund Class Y | 5.113 | -4,09 | 574 | 1,23 | ||||
| 2026-02-05 | 13F | May Hill Capital, LLC | 4.572 | 108,01 | 561 | 130,86 | ||||
| 2025-11-14 | 13F | Point72 (DIFC) Ltd | Call | 0 | -100,00 | 0 | -100,00 | |||
| 2025-09-26 | NP | FBCG - Fidelity Blue Chip Growth ETF This fund is a listed as child fund of Fmr Llc and if that institution has disclosed ownership in this security, then these positions will not be double counted when calculating total shares and total value | 211.237 | 17,83 | 23.720 | 24,19 | ||||
| 2026-02-17 | 13F | J. Goldman & Co LP | Call | 30.000 | -65,71 | 3.682 | -62,09 | |||
| 2026-02-11 | 13F | 111 Capital | 17.124 | 2.102 | ||||||
| 2026-01-22 | 13F | Foundation Resource Management Inc | 108.505 | -0,50 | 13.318 | 10,02 | ||||
| 2026-02-12 | 13F | Penserra Capital Management LLC | 105 | 2,94 | 0 | |||||
| 2026-01-13 | 13F | Harrington Investments, INC | 19.465 | -1,76 | 2.389 | 8,64 | ||||
| 2026-01-16 | 13F/A | Beacon Investment Advisory Services, Inc. | 111.531 | 10,34 | 13.689 | 22,01 | ||||
| 2026-02-18 | 13F | GWM Advisors LLC | 160.720 | 1,03 | 19.727 | 11,71 | ||||
| 2026-02-09 | 13F | Cary Street Partners Financial Llc | 6.887 | 24,76 | 845 | 38,07 | ||||
| 2026-02-17 | 13F | Hilltop Holdings Inc. | 29.028 | 14,71 | 3.563 | 26,85 | ||||
| 2026-01-29 | 13F | TKG Advisors, LLC | 46.526 | 1,67 | 5.711 | 12,42 | ||||
| 2026-02-17 | 13F | Evolve Private Wealth, Llc | 25.666 | 3.150 | ||||||
| 2025-09-26 | NP | PDAVX - PineBridge Dynamic Asset Allocation Fund Investor Servicing Shares | 1.001 | -12,19 | 112 | -7,44 | ||||
| 2026-02-03 | 13F | Koshinski Asset Management, Inc. | 6.068 | 6,21 | 745 | 17,35 | ||||
| 2026-01-16 | 13F | Trust Co Of Vermont | 11.985 | -0,95 | 1.471 | 9,53 | ||||
| 2026-01-28 | 13F | Davis Capital Management | 11 | 37,50 | 1 | |||||
| 2026-01-22 | 13F | Massachusetts Financial Services Co /ma/ | 4.223.304 | 3.763,78 | 518.368 | 4.172,73 | ||||
| 2026-01-15 | 13F | Columbus Macro, LLC | 22.698 | -5,29 | 2.786 | 4,70 | ||||
| 2026-01-15 | 13F | Cherry Creek Investment Advisors, Inc. | 8.704 | 3,39 | 1.068 | 14,35 | ||||
| 2026-02-11 | 13F | Mirae Asset Securities (usa) Inc. | 100.833 | 12.376 | ||||||
| 2025-09-26 | NP | FDMO - Fidelity Momentum Factor ETF This fund is a listed as child fund of Fmr Llc and if that institution has disclosed ownership in this security, then these positions will not be double counted when calculating total shares and total value | 41.673 | 97,74 | 4.679 | 191,71 | ||||
| 2025-09-29 | NP | QQQG - Pacer Nasdaq 100 Top 50 Cash Cows Growth Leaders ETF | 1.807 | 85,33 | 203 | 96,12 | ||||
| 2025-09-26 | NP | BKDV - BNY Mellon Dynamic Value ETF | 20.347 | -30,05 | 2.285 | -26,30 | ||||
| 2025-09-26 | NP | FYEE - Fidelity Yield Enhanced Equity ETF | 1.042 | 17,61 | 117 | 24,47 | ||||
| 2026-02-13 | 13F | Tradewinds, LLC. | 4.329 | -5,21 | 531 | 4,94 | ||||
| 2025-11-06 | 13F | Good Steward Wealth Advisors,LLC | 0 | -100,00 | 0 | -100,00 | ||||
| 2026-02-11 | 13F | Real Talk Capital, LLC | 2.442 | 300 | ||||||
| 2026-02-12 | 13F | Dimensional Fund Advisors Lp | 8.846.313 | -7,44 | 1.085.840 | 2,33 | ||||
| 2026-02-27 | 13F | Strategic Investment Solutions, Inc. /IL | 200 | 25 | ||||||
| 2025-09-26 | NP | RSEAX - U.S. Strategic Equity Fund Class A | 42.941 | 0,00 | 4.822 | 5,40 | ||||
| 2026-02-11 | 13F | Deseret Mutual Benefit Administrators | 19.279 | 2,49 | 2.366 | 13,31 | ||||
| 2025-11-14 | 13F | Texas Permanent School Fund | 0 | -100,00 | 0 | -100,00 | ||||
| 2026-01-12 | 13F | Byrne Asset Management LLC | 2.560 | 314 | 8,28 | |||||
| 2026-02-11 | 13F | DB&C Advisors, LLC | 12.783 | 1.569 | ||||||
| 2026-02-05 | 13F | Allworth Financial LP | 49.679 | 3,31 | 6.098 | 14,24 | ||||
| 2026-01-21 | 13F | Aaron Wealth Advisors LLC | 20.367 | 16,74 | 2.500 | 29,08 | ||||
| 2026-02-17 | 13F | Price T Rowe Associates Inc /md/ | 27.698.660 | 4,51 | 3.400 | 15,57 | ||||
| 2026-01-28 | 13F | DekaBank Deutsche Girozentrale | 2.040.494 | 0,00 | 147 | -35,53 | ||||
| 2026-01-29 | 13F | Impax Asset Management Group plc | 296.565 | 7,19 | 36.400 | 18,53 | ||||
| 2026-01-12 | 13F | Moody National Bank Trust Division | 12.499 | -28,72 | 1.534 | -21,17 | ||||
| 2026-02-05 | 13F | WealthPlan Investment Management, LLC | 13.494 | 316,74 | 1.656 | 361,28 | ||||
| 2026-02-06 | 13F | CWS Financial Advisors, LLC | 3.904 | 22,38 | 479 | 35,31 | ||||
| 2026-01-26 | 13F | Valmark Advisers, Inc. | 3.153 | -0,60 | 387 | 9,66 | ||||
| 2026-01-29 | 13F | Teachers Retirement System Of The State Of Kentucky | 627.087 | -0,00 | 77 | 10,14 | ||||
| 2026-02-05 | 13F | Amalgamated Bank | 240.266 | -10,35 | 29 | 0,00 | ||||
| 2026-02-23 | 13F | Beaird Harris Wealth Management, LLC | 42 | -14,29 | 5 | 0,00 | ||||
| 2026-02-11 | 13F | Rise Advisors, LLC | 0 | -100,00 | 0 | |||||
| 2026-02-13 | 13F | Royal London Asset Management Ltd | 552.137 | -0,68 | 67.769 | 9,82 | ||||
| 2026-02-13 | 13F | Financial Network Wealth Advisors LLC | 328 | -9,89 | 40 | 0,00 | ||||
| 2025-11-07 | 13F | Sierra Ocean, Llc | 0 | -100,00 | 0 | -100,00 | ||||
| 2026-02-17 | 13F | Quantinno Capital Management LP | 543.863 | 38,55 | 66.754 | 53,21 | ||||
| 2026-01-14 | 13F | ORG Wealth Partners, LLC | 2.714 | 1,31 | 333 | 12,12 | ||||
| 2026-02-11 | 13F | Argent Advisors, Inc. | 11.536 | -0,74 | 1.416 | 9,69 | ||||
| 2026-01-23 | 13F | Bridgewater Advisors Inc. | 6.158 | 1,05 | 795 | 5,72 | ||||
| 2026-02-03 | 13F | Alpha Cubed Investments, LLC | 6.619 | 1,15 | 812 | 11,85 | ||||
| 2026-01-05 | 13F | GAMMA Investing LLC | 30.955 | 12,90 | 3.799 | 24,84 | ||||
| 2026-01-28 | 13F | Columbia Asset Management | 3.085 | 0,00 | 379 | 10,53 | ||||
| 2026-02-06 | 13F | Keystone Financial Group | 4.382 | -1,13 | 538 | 8,70 | ||||
| 2025-11-13 | 13F | Texas Capital Bancshares Inc/tx | 1.130 | -67,76 | 125 | -67,78 | ||||
| 2026-02-04 | 13F | Long Road Investment Counsel, LLC | 23.950 | -1,84 | 2.940 | 8,53 | ||||
| 2026-02-12 | 13F | Grey Fox Wealth Advisors, LLC | 1.679 | -21,03 | 206 | -12,34 | ||||
| 2026-02-17 | 13F | Prosperity Consulting Group, LLC | 29.166 | 1,11 | 3.580 | 11,81 | ||||
| 2026-01-14 | 13F | Mirador Capital Partners LP | 14.057 | -0,47 | 1.725 | 10,08 | ||||
| 2026-02-03 | 13F | Morse Asset Management, Inc | 9.900 | 1.215 | ||||||
| 2026-02-05 | 13F | High Note Wealth, LLC | 50 | 614,29 | 6 | |||||
| 2026-02-13 | 13F | Arete Wealth Advisors, LLC | 10.568 | -5,84 | 1 | 0,00 | ||||
| 2026-01-22 | 13F | Venturi Wealth Management, LLC | 3.805 | -0,44 | 467 | 10,14 | ||||
| 2025-09-29 | NP | INVESCO ACTIVELY MANAGED EXCHANGE-TRADED FUND TRUST - Invesco QQQ Income Advantage ETF | 15.812 | 15,62 | 1.776 | 21,83 | ||||
| 2026-02-02 | 13F | SevenBridge Financial Group, LLC | 6.690 | -0,74 | 922 | 10,83 | ||||
| 2026-02-12 | 13F | Empire Financial Management Company, LLC | 3.000 | 15,38 | 368 | 27,78 | ||||
| 2026-02-17 | 13F | Blair William & Co/il | 368.930 | -2,23 | 45.283 | 8,11 | ||||
| 2026-01-21 | 13F | South Shore Capital Advisors | 2.526 | 310 | ||||||
| 2026-02-17 | 13F | Limestone Investment Advisors LP | Call | 0 | -100,00 | 0 | ||||
| 2025-11-17 | 13F/A | Proficio Capital Partners LLC | 0 | -100,00 | 0 | -100,00 | ||||
| 2026-02-13 | 13F | Pathstone Holdings, LLC | 114.310 | 2,70 | 14.030 | 13,57 | ||||
| 2026-01-05 | 13F | Jacobs & Co/ca | 4.262 | -6,33 | 1 | |||||
| 2025-09-26 | NP | FHOFX - Fidelity Series Large Cap Growth Index Fund This fund is a listed as child fund of Fmr Llc and if that institution has disclosed ownership in this security, then these positions will not be double counted when calculating total shares and total value | 22.690 | 2.548 | ||||||
| 2026-01-08 | 13F | True Wealth Design, LLC | 719 | -1,10 | 88 | 10,00 | ||||
| 2026-01-26 | 13F | Parcion Private Wealth LLC | 1.676 | -37,51 | 206 | -30,98 | ||||
| 2026-02-13 | 13F | PCM Encore, LLC | 6.911 | 848 | ||||||
| 2026-02-10 | 13F | Acorn Wealth Advisors, LLC | 2.282 | -4,24 | 280 | 6,06 | ||||
| 2026-02-17 | 13F | Ameriprise Financial Inc | 7.800.418 | 9,12 | 957.456 | 20,66 | ||||
| 2026-02-11 | 13F | Lyell Wealth Management, Lp | 7.276 | 3,94 | 893 | 14,93 | ||||
| 2026-01-14 | 13F | Wolff Wiese Magana Llc | 149 | 0,00 | 18 | 12,50 | ||||
| 2026-02-06 | 13F | Bare Financial Services, Inc | 98 | 2,08 | 12 | 20,00 | ||||
| 2026-02-11 | 13F | Investors Towarzystwo Funduszy Inwestycyjnych Spolka Akcyjna | 170 | 21 | ||||||
| 2025-11-12 | 13F | Tounjian Advisory Partners, Llc | 0 | -100,00 | 0 | |||||
| 2026-01-30 | 13F | Kohmann Bosshard Financial Services, LLC | 155 | 19 | ||||||
| 2025-09-26 | NP | WLDR - Affinity World Leaders Equity ETF | 6.595 | 23,97 | 741 | 30,74 | ||||
| 2026-01-12 | 13F | Abound Wealth Management | 178 | 3,49 | 22 | 10,53 | ||||
| 2026-01-22 | 13F | Carlton Hofferkamp & Jenks Wealth Management, LLC | 5.310 | -0,65 | 652 | 1,24 | ||||
| 2026-02-09 | 13F | Legal & General Group Plc | 10.317.613 | 1,05 | 1.266.384 | 11,74 | ||||
| 2026-02-11 | 13F | Cypress Capital Group | 48.586 | -0,04 | 5.963 | 10,53 | ||||
| 2026-02-17 | 13F | Private Advisor Group, LLC | 46.025 | 3,23 | 5.649 | 14,17 | ||||
| 2026-02-12 | 13F | Rowland & Co Investment Counsel/adv | 0 | -100,00 | 0 | |||||
| 2025-09-29 | NP | CATH - Global X S&P 500 Catholic Values ETF This fund is a listed as child fund of Mirae Asset Global Investments Co., Ltd. and if that institution has disclosed ownership in this security, then these positions will not be double counted when calculating total shares and total value | 58.226 | -10,01 | 6.538 | -5,15 | ||||
| 2026-02-09 | 13F/A | Swedbank AB | 2.505.240 | 1,75 | 307.493 | 12,52 | ||||
| 2025-10-14 | 13F | Prairiewood Capital, LLC | 0 | -100,00 | 0 | |||||
| 2026-02-17 | 13F | Boreal Capital Management LLC | 93 | 0,00 | 11 | 10,00 | ||||
| 2026-02-13 | 13F | L2 Asset Management, LLC | 70.920 | 16,80 | 8.705 | 29,16 | ||||
| 2026-01-16 | 13F | Standard Life Aberdeen plc | 1.185.676 | -12,04 | 145.530 | -3,98 | ||||
| 2026-02-04 | 13F | Fourth Dimension Wealth, LLC | 648 | 0,00 | 80 | 11,27 | ||||
| 2026-02-09 | 13F | Fidelis Capital Partners, LLC | 5.192 | 4,13 | 637 | 15,19 | ||||
| 2026-01-07 | 13F | Retirement Wealth Solutions LLC | 106 | 0,00 | 13 | 9,09 | ||||
| 2026-01-08 | 13F | Versant Capital Management, Inc | 4.417 | 4,30 | 542 | 15,32 | ||||
| 2026-02-18 | 13F | Braeburn Wealth Management LLC | 13.917 | 1.708 | ||||||
| 2026-01-14 | 13F | Wealthcare Advisory Partners LLC | 19.547 | 5,58 | 2.399 | 16,74 | ||||
| 2026-02-04 | 13F | Boston Private Wealth Llc | 29.779 | -19,70 | 3.655 | -11,20 | ||||
| 2026-02-17 | 13F | Driehaus Capital Management Llc | 5.033 | 618 | ||||||
| 2026-02-13 | 13F | Fortitude Advisory Group L.L.C. | 2.164 | 1,55 | 266 | 12,29 | ||||
| 2026-02-12 | 13F | Marex Group plc | 5.711 | 15,23 | 701 | 27,27 | ||||
| 2026-02-10 | 13F | Founders Financial Securities Llc | 8.304 | 4,07 | 1.019 | 15,14 | ||||
| 2026-02-05 | 13F | Rossmore Private Capital | 4.182 | 5,02 | 513 | 16,06 | ||||
| 2026-01-21 | 13F | Nexus Investment Management ULC | 257.824 | -0,46 | 31.645 | 10,07 | ||||
| 2026-01-27 | 13F | Meritage Portfolio Management | 49.853 | -0,48 | 6.119 | 10,04 | ||||
| 2026-01-30 | 13F | Seek First Inc. | 5.060 | -35,28 | 621 | -28,37 | ||||
| 2026-02-05 | 13F | Rossmore Private Capital | Put | 2.400 | 295 | |||||
| 2026-02-02 | 13F | JDM Financial Group LLC | 668 | 0,60 | 82 | 12,33 | ||||
| 2026-01-15 | 13F | Highline Wealth Partners Llc | 292 | -91,85 | 36 | -91,18 | ||||
| 2026-02-11 | 13F | J.Safra Asset Management Corp | 172 | 1.463,64 | 21 | 2.000,00 | ||||
| 2026-01-14 | 13F | ORG Partners LLC | 66.686 | 0,03 | 8.185 | 10,62 | ||||
| 2026-01-26 | 13F | Merit Financial Group, LLC | 53.558 | 11,41 | 6.574 | 23,18 | ||||
| 2026-02-03 | 13F | Encompass More Asset Management | 2.906 | -0,27 | 357 | 10,22 | ||||
| 2026-02-03 | 13F | Virtus Family Office LLC | 6.834 | 839 | ||||||
| 2026-02-10 | 13F | JTC Employer Solutions Trusteee Ltd | 840 | 0,00 | 0 | |||||
| 2026-02-12 | 13F | Tiemann Investment Advisors, Llc | 2.297 | 0,00 | 282 | 10,63 | ||||
| 2025-09-29 | NP | AIM INVESTMENT FUNDS (INVESCO INVESTMENT FUNDS) - Invesco Oppenheimer Fundamental Alternatives Fund Class R6 | 11.835 | -19,15 | 1.329 | -14,82 | ||||
| 2026-02-11 | 13F | Winton Capital Group Ltd | 9.943 | -85,10 | 1.220 | -83,53 | ||||
| 2025-10-24 | 13F | Aventus Investment Advisors, Inc. | 0 | -100,00 | 0 | -100,00 | ||||
| 2026-01-30 | 13F | Valued Wealth Advisors LLC | 711 | 12,50 | 87 | 24,29 | ||||
| 2026-01-13 | 13F | Capital Investment Advisors, LLC | 102.666 | -3,36 | 12.601 | 6,86 | ||||
| 2026-02-06 | 13F | Tortoise Investment Management, LLC | 0 | -100,00 | 0 | -100,00 | ||||
| 2026-01-30 | 13F | Bogart Wealth, LLC | 67.154 | -1,37 | 8.242 | 9,06 | ||||
| 2025-11-17 | 13F | Jacobs Levy Equity Management, Inc | 0 | -100,00 | 0 | -100,00 | ||||
| 2026-02-13 | 13F | Cozad Asset Management Inc | 4.012 | 0,00 | 492 | 10,56 | ||||
| 2025-11-12 | 13F | Group One Trading, L.p. | 0 | -100,00 | 0 | -100,00 | ||||
| 2026-01-26 | 13F | Asset Dedication, LLC | 13.431 | -14,50 | 1.648 | -5,45 | ||||
| 2026-02-05 | 13F | Noesis Capital Mangement Corp | 115.263 | 0,65 | 14.147 | 11,30 | ||||
| 2026-01-09 | 13F | Atlas Brown,Inc. | 3.508 | 0,09 | 431 | 10,54 | ||||
| 2026-01-26 | 13F | Consolidated Portfolio Review Corp | 0 | -100,00 | 0 | |||||
| 2026-02-13 | 13F | Barclays Plc | Put | 284.100 | 0,00 | 34.870 | 10,58 | |||
| 2025-09-26 | NP | USGRX - Growth & Income Fund Shares | 214.008 | -10,26 | 24.031 | -5,42 | ||||
| 2026-01-27 | 13F | TriaGen Wealth Management LLC | 11.440 | -0,35 | 1.404 | 10,20 | ||||
| 2026-02-10 | 13F | Jupiter Asset Management Ltd | 14.910 | 63,49 | 1.830 | 80,83 | ||||
| 2026-02-06 | 13F | Sierra Summit Advisors Llc | 24.153 | 2,35 | 2.965 | 13,17 | ||||
| 2026-02-11 | 13F | Capital International Sarl | 37.350 | -2,12 | 4.584 | 8,24 | ||||
| 2026-02-11 | 13F | CNB Bank | 2.088 | 2,86 | 256 | 13,78 | ||||
| 2026-02-12 | 13F | Elo Mutual Pension Insurance Co | 193.587 | 17,24 | 23.761 | 29,64 | ||||
| 2026-01-21 | 13F | Jackson Square Capital, Llc | 8.451 | 1.037 | ||||||
| 2026-02-11 | 13F | IMA Wealth, Inc. | 566 | 12,75 | 69 | 25,45 | ||||
| 2026-02-26 | 13F | TD Capital Management LLC | 650 | 0,15 | 80 | 9,72 | ||||
| 2026-02-13 | 13F | Barclays Plc | 9.115.483 | 76,21 | 1.118.834 | 94,84 | ||||
| 2026-02-03 | 13F | Heartland Bank & Trust Co | 6.578 | -1,70 | 807 | 8,76 | ||||
| 2026-02-13 | 13F | Barclays Plc | Call | 250.500 | 0,00 | 30.746 | 10,58 | |||
| 2026-02-17 | 13F | Rakuten Investment Management, Inc. | 230.184 | 251,96 | 28.752 | 1.427,74 | ||||
| 2026-02-06 | 13F | RD Lewis Holdings, Inc. | 1.671 | 0,00 | 239 | 16,02 | ||||
| 2026-02-17 | 13F | Wealth Watch Advisors, INC | 505 | -7,00 | 62 | 1,67 | ||||
| 2026-02-19 | 13F | Claris Financial LLC | 3.025 | 371 | ||||||
| 2025-09-26 | NP | QRFT - QRAFT AI-Enhanced U.S. Large Cap ETF | 923 | 160,00 | 104 | 178,38 | ||||
| 2026-01-20 | 13F | Investment Research & Advisory Group, Inc. | 406 | 0,50 | 53 | 12,77 | ||||
| 2026-01-20 | 13F | Corundum Trust Company, INC | 0 | -100,00 | 0 | |||||
| 2026-01-13 | 13F | Regatta Capital Group, Llc | 4.063 | 0,02 | 499 | 10,67 | ||||
| 2026-02-12 | 13F | Hudock, Inc. | 1.765 | 217 | ||||||
| 2026-02-12 | 13F | Mosley Wealth Management | 4.473 | -22,51 | 529 | -3,99 | ||||
| 2026-01-16 | 13F | Oregon Pacific Wealth Management, LLC | 0 | -100,00 | 0 | |||||
| 2026-02-12 | 13F | Fortress Private Ledger, Llc | 1.702 | 209 | ||||||
| 2026-02-17 | 13F | Masters Capital Management Llc | Call | 0 | -100,00 | 0 | ||||
| 2026-01-20 | 13F | October Effect Ltd | 7.015 | 0,00 | 861 | 10,67 | ||||
| 2026-02-10 | 13F | Sittner & Nelson, Llc | 8.200 | -1,56 | 1.250 | 35,28 | ||||
| 2026-02-04 | 13F | KLCM Advisors, Inc. | 1.708 | -8,07 | 210 | 1,46 | ||||
| 2026-02-10 | 13F | Bowen Hanes & Co Inc | 3.020 | 0 | ||||||
| 2026-02-11 | 13F | Nemes Rush Group LLC | 26.772 | 1,00 | 3.286 | 11,66 | ||||
| 2026-02-13 | 13F | Caitong International Asset Management Co., Ltd | 0 | -100,00 | 0 | |||||
| 2025-09-26 | NP | INVESCO ACTIVELY MANAGED EXCHANGE-TRADED FUND TRUST - Invesco Global Equity Net Zero ETF | 3.392 | 381 | ||||||
| 2025-09-26 | NP | TBG - TBG Dividend Focus ETF | 47.638 | 23,18 | 5.349 | 29,83 | ||||
| 2026-01-07 | 13F | IAM Advisory, LLC | 10.375 | 1.273 | ||||||
| 2026-02-13 | 13F | Gts Securities Llc | 14.181 | -44,44 | 1.741 | -38,58 | ||||
| 2026-01-21 | 13F | Crews Bank & Trust | 336 | 0,00 | 41 | 10,81 | ||||
| 2026-02-04 | 13F | Midwest Trust Co | 11.036 | 21,10 | 1.355 | 33,93 | ||||
| 2026-01-07 | 13F | Corsicana & Co. | 25 | 0,00 | 3 | 50,00 | ||||
| 2026-01-26 | 13F | Roman Butler Fullerton & Co | 2.308 | -24,82 | 303 | -16,80 | ||||
| 2026-02-04 | 13F | Summit Wealth Group Llc / Co | 0 | -100,00 | 0 | -100,00 | ||||
| 2026-01-30 | 13F | Activest Wealth Management | 304 | -0,98 | 37 | 8,82 | ||||
| 2025-09-29 | NP | QQWZ - Pacer Cash COWZ 100-Nasdaq 100 Rotator ETF | 657 | 74 | ||||||
| 2026-02-11 | 13F | Empowered Funds, LLC | 137.873 | -7,93 | 16.923 | 1,80 | ||||
| 2026-01-20 | 13F | Meridian Investment Counsel Inc. | 32.120 | 51,75 | 3.942 | 67,82 |