Grundlæggende statistik
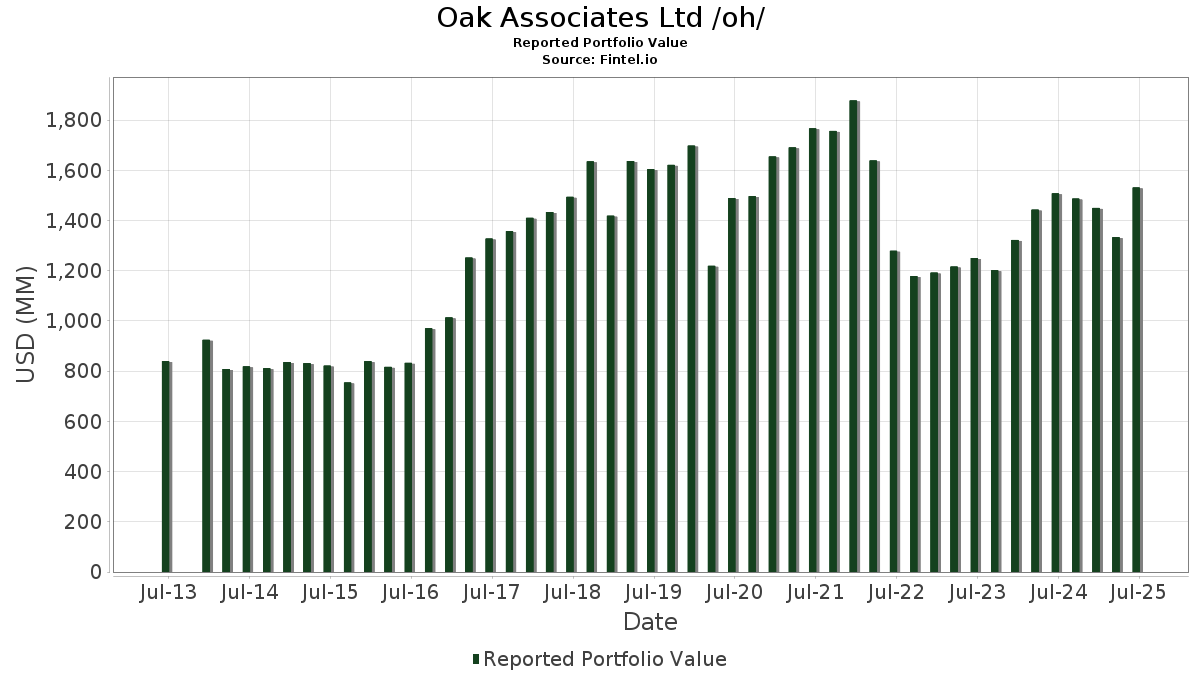
| Porteføljeværdi | $ 1.531.062.590 |
| Nuværende stillinger | 131 |
Seneste beholdninger, ydeevne, AUM (fra 13F, 13D)
Oak Associates Ltd /oh/ har afsløret 131 samlede besiddelser i deres seneste SEC-arkivering. Den seneste porteføljeværdi er beregnet til at være $ 1.531.062.590 USD. Faktiske aktiver under forvaltning (AUM) er denne værdi plus kontanter (som ikke er oplyst). Oak Associates Ltd /oh/s største beholdninger er Amazon.com, Inc. (US:AMZN) , Alphabet Inc. (US:GOOG) , KLA Corporation (US:KLAC) , Meta Platforms, Inc. (US:META) , and Microsoft Corporation (US:MSFT) . Oak Associates Ltd /oh/s nye stillinger omfatter Adobe Inc. (US:ADBE) , AppLovin Corporation (US:APP) , Palantir Technologies Inc. (US:PLTR) , iShares Trust - iShares 7-10 Year Treasury Bond ETF (US:IEF) , and Axos Financial, Inc. (US:AX) .
Top øger dette kvartal
Vi bruger ændringen i porteføljeallokeringen, fordi dette er den mest meningsfulde metrik. Ændringer kan skyldes handler eller ændringer i aktiekurser.
| Sikkerhed | Aktier (MM) |
Værdi (MM$) |
Portefølje % | ΔPortefølje % |
|---|---|---|---|---|
| 0,24 | 65,36 | 4,2689 | 1,9452 | |
| 0,30 | 64,74 | 4,2284 | 1,2793 | |
| 0,04 | 16,34 | 1,0674 | 1,0674 | |
| 0,09 | 80,72 | 5,2722 | 0,7541 | |
| 0,33 | 52,00 | 3,3960 | 0,7206 | |
| 0,14 | 71,58 | 4,6754 | 0,6892 | |
| 0,11 | 77,72 | 5,0761 | 0,5796 | |
| 0,03 | 14,88 | 0,9720 | 0,4694 | |
| 0,21 | 20,38 | 1,3314 | 0,4143 | |
| 0,06 | 5,61 | 0,3664 | 0,2321 |
Top falder i dette kvartal
Vi bruger ændringen i porteføljeallokeringen, fordi dette er den mest meningsfulde metrik. Ændringer kan skyldes handler eller ændringer i aktiekurser.
| Sikkerhed | Aktier (MM) |
Værdi (MM$) |
Portefølje % | ΔPortefølje % |
|---|---|---|---|---|
| 0,18 | 28,87 | 1,8854 | -1,6725 | |
| 0,53 | 116,82 | 7,6299 | -0,7995 | |
| 0,13 | 35,19 | 2,2981 | -0,5903 | |
| 0,03 | 7,52 | 0,4914 | -0,5173 | |
| 0,15 | 53,25 | 3,4778 | -0,4097 | |
| 0,47 | 83,12 | 5,4288 | -0,4018 | |
| 0,11 | 23,16 | 1,5128 | -0,3680 | |
| 0,08 | 6,26 | 0,4086 | -0,3376 | |
| 0,11 | 23,67 | 1,5463 | -0,2634 | |
| 0,14 | 10,90 | 0,7121 | -0,2098 |
13F og Fondsarkivering
Denne formular blev indsendt den 2025-08-12 for rapporteringsperioden 2025-06-30. Klik på linkikonet for at se den fulde transaktionshistorik.
Opgrader for at låse op for premium-data og eksportere til Excel ![]() .
.
| Sikkerhed | Type | Gennemsnitlig aktiekurs | Aktier (MM) |
Δ Aktier (%) |
Δ Aktier (%) |
Værdi ($MM) |
Portefølje (%) |
ΔPortefølje (%) |
|
|---|---|---|---|---|---|---|---|---|---|
| AMZN / Amazon.com, Inc. | 0,53 | -9,86 | 116,82 | 3,94 | 7,6299 | -0,7995 | |||
| GOOG / Alphabet Inc. | 0,47 | -5,83 | 83,12 | 6,92 | 5,4288 | -0,4018 | |||
| KLAC / KLA Corporation | 0,09 | 1,70 | 80,72 | 34,00 | 5,2722 | 0,7541 | |||
| META / Meta Platforms, Inc. | 0,11 | 1,23 | 77,72 | 29,63 | 5,0761 | 0,5796 | |||
| MSFT / Microsoft Corporation | 0,14 | 1,65 | 71,58 | 34,69 | 4,6754 | 0,6892 | |||
| AVGO / Broadcom Inc. | 0,24 | 28,14 | 65,36 | 110,96 | 4,2689 | 1,9452 | |||
| ORCL / Oracle Corporation | 0,30 | 5,29 | 64,74 | 64,65 | 4,2284 | 1,2793 | |||
| CSCO / Cisco Systems, Inc. | 0,93 | 1,24 | 64,45 | 13,83 | 4,2092 | -0,0372 | |||
| V / Visa Inc. | 0,15 | 1,40 | 53,25 | 2,73 | 3,4778 | -0,4097 | |||
| NVDA / NVIDIA Corporation | 0,33 | -0,01 | 52,00 | 45,76 | 3,3960 | 0,7206 | |||
| SCHW / The Charles Schwab Corporation | 0,49 | 0,23 | 44,36 | 16,82 | 2,8971 | 0,0492 | |||
| NXPI / NXP Semiconductors N.V. | 0,19 | 1,45 | 41,73 | 16,62 | 2,7258 | 0,0417 | |||
| GOOGL / Alphabet Inc. | 0,21 | 8,81 | 36,43 | 23,99 | 2,3792 | 0,1758 | |||
| JPM / JPMorgan Chase & Co. | 0,13 | -7,83 | 36,42 | 8,93 | 2,3790 | -0,1290 | |||
| AMGN / Amgen Inc. | 0,13 | 1,95 | 35,19 | -8,63 | 2,2981 | -0,5903 | |||
| SNPS / Synopsys, Inc. | 0,06 | 0,00 | 32,90 | 19,55 | 2,1489 | 0,0847 | |||
| QCOM / QUALCOMM Incorporated | 0,18 | -41,31 | 28,87 | -39,15 | 1,8854 | -1,6725 | |||
| EBAY / eBay Inc. | 0,32 | 0,00 | 23,90 | 9,94 | 1,5610 | -0,0695 | |||
| LOW / Lowe's Companies, Inc. | 0,11 | 3,14 | 23,67 | -1,88 | 1,5463 | -0,2634 | |||
| AAPL / Apple Inc. | 0,11 | 0,00 | 23,16 | -7,64 | 1,5128 | -0,3680 | |||
| NTAP / NetApp, Inc. | 0,20 | 0,00 | 20,89 | 21,30 | 1,3647 | 0,0727 | |||
| CB / Chubb Limited | 0,07 | 4,57 | 20,79 | 0,32 | 1,3581 | -0,1964 | |||
| APH / Amphenol Corporation | 0,21 | 10,73 | 20,38 | 66,71 | 1,3314 | 0,4143 | |||
| NVS / Novartis AG - Depositary Receipt (Common Stock) | 0,16 | 3,60 | 19,11 | 12,46 | 1,2478 | -0,0264 | |||
| MA / Mastercard Incorporated | 0,03 | -0,00 | 18,48 | 2,52 | 1,2069 | -0,1450 | |||
| LH / Labcorp Holdings Inc. | 0,07 | 4,39 | 17,42 | 17,74 | 1,1376 | 0,0281 | |||
| ADBE / Adobe Inc. | 0,04 | 16,34 | 1,0674 | 1,0674 | |||||
| CI / The Cigna Group | 0,05 | 4,68 | 16,08 | 5,18 | 1,0505 | -0,0964 | |||
| ACN / Accenture plc | 0,05 | 0,00 | 14,98 | -4,21 | 0,9785 | -0,1946 | |||
| LMT / Lockheed Martin Corporation | 0,03 | 114,21 | 14,88 | 122,09 | 0,9720 | 0,4694 | |||
| ALC / Alcon Inc. | 0,17 | 3,82 | 14,75 | -3,45 | 0,9633 | -0,1825 | |||
| AMD / Advanced Micro Devices, Inc. | 0,10 | 0,00 | 14,52 | 38,12 | 0,9483 | 0,1598 | |||
| MCK / McKesson Corporation | 0,02 | -3,29 | 12,94 | 5,31 | 0,8454 | -0,0765 | |||
| AKAM / Akamai Technologies, Inc. | 0,14 | -10,48 | 10,90 | -11,30 | 0,7121 | -0,2098 | |||
| PFE / Pfizer Inc. | 0,43 | 4,67 | 10,34 | 0,13 | 0,6756 | -0,0993 | |||
| CTSH / Cognizant Technology Solutions Corporation | 0,13 | 3,20 | 10,25 | 5,27 | 0,6694 | -0,0609 | |||
| GILD / Gilead Sciences, Inc. | 0,09 | 9,11 | 9,96 | 7,96 | 0,6504 | -0,0414 | |||
| DOX / Amdocs Limited | 0,11 | 0,00 | 9,93 | -0,28 | 0,6484 | -0,0983 | |||
| BK / The Bank of New York Mellon Corporation | 0,09 | -6,67 | 8,31 | 1,39 | 0,5429 | -0,0720 | |||
| ZBH / Zimmer Biomet Holdings, Inc. | 0,09 | 4,31 | 8,20 | -15,94 | 0,5358 | -0,1961 | |||
| STT / State Street Corporation | 0,07 | 9,86 | 7,78 | 30,49 | 0,5083 | 0,0610 | |||
| CHKP / Check Point Software Technologies Ltd. | 0,03 | -42,37 | 7,52 | -44,06 | 0,4914 | -0,5173 | |||
| ZS / Zscaler, Inc. | 0,02 | 20,96 | 6,62 | 91,41 | 0,4321 | 0,1728 | |||
| AIZ / Assurant, Inc. | 0,03 | 0,00 | 6,50 | -5,85 | 0,4249 | -0,0933 | |||
| GPN / Global Payments Inc. | 0,08 | -23,07 | 6,26 | -37,12 | 0,4086 | -0,3376 | |||
| CRM / Salesforce, Inc. | 0,02 | 32,72 | 6,22 | 34,88 | 0,4062 | 0,0603 | |||
| AIT / Applied Industrial Technologies, Inc. | 0,02 | -13,49 | 5,74 | -10,76 | 0,3750 | -0,1075 | |||
| LRCX / Lam Research Corporation | 0,06 | 133,94 | 5,61 | 213,23 | 0,3664 | 0,2321 | |||
| PAYX / Paychex, Inc. | 0,04 | 0,00 | 5,12 | -5,71 | 0,3342 | -0,0728 | |||
| ISRG / Intuitive Surgical, Inc. | 0,01 | -6,86 | 4,76 | 2,19 | 0,3109 | -0,0385 | |||
| CRUS / Cirrus Logic, Inc. | 0,04 | 0,55 | 4,58 | 5,19 | 0,2993 | -0,0275 | |||
| REGN / Regeneron Pharmaceuticals, Inc. | 0,01 | -16,68 | 4,30 | -31,03 | 0,2809 | -0,1868 | |||
| CAH / Cardinal Health, Inc. | 0,02 | -1,01 | 4,11 | 20,73 | 0,2682 | 0,0131 | |||
| FLUT / Flutter Entertainment plc | 0,01 | 13,99 | 4,03 | 47,04 | 0,2632 | 0,0576 | |||
| CRWD / CrowdStrike Holdings, Inc. | 0,01 | 0,00 | 3,91 | 44,46 | 0,2553 | 0,0524 | |||
| FFIV / F5, Inc. | 0,01 | 0,00 | 3,89 | 10,55 | 0,2540 | -0,0099 | |||
| EXEL / Exelixis, Inc. | 0,09 | 0,00 | 3,81 | 19,37 | 0,2491 | 0,0095 | |||
| AEIS / Advanced Energy Industries, Inc. | 0,03 | -4,13 | 3,59 | 33,28 | 0,2344 | 0,0324 | |||
| COR / Cencora, Inc. | 0,01 | -14,28 | 3,20 | -7,57 | 0,2090 | -0,0507 | |||
| MELI / MercadoLibre, Inc. | 0,00 | 0,00 | 3,14 | 33,96 | 0,2048 | 0,0293 | |||
| DGX / Quest Diagnostics Incorporated | 0,02 | 0,00 | 3,13 | 6,17 | 0,2046 | -0,0167 | |||
| VEEV / Veeva Systems Inc. | 0,01 | 0,00 | 2,94 | 24,33 | 0,1922 | 0,0147 | |||
| KLIC / Kulicke and Soffa Industries, Inc. | 0,08 | -6,88 | 2,81 | -2,29 | 0,1836 | -0,0322 | |||
| FTNT / Fortinet, Inc. | 0,03 | 0,00 | 2,75 | 9,84 | 0,1794 | -0,0082 | |||
| ESAB / ESAB Corporation | 0,02 | 1,06 | 2,55 | 4,59 | 0,1666 | -0,0163 | |||
| SHY / iShares Trust - iShares 1-3 Year Treasury Bond ETF | 0,03 | 11,08 | 2,52 | 11,30 | 0,1647 | -0,0053 | |||
| SIMO / Silicon Motion Technology Corporation - Depositary Receipt (Common Stock) | 0,03 | -3,20 | 2,48 | 43,92 | 0,1623 | 0,0328 | |||
| JAZZ / Jazz Pharmaceuticals plc | 0,02 | 0,00 | 2,34 | -14,55 | 0,1531 | -0,0526 | |||
| ENSG / The Ensign Group, Inc. | 0,02 | 0,00 | 2,33 | 19,21 | 0,1520 | 0,0056 | |||
| VRTX / Vertex Pharmaceuticals Incorporated | 0,00 | 0,00 | 2,12 | -8,17 | 0,1387 | -0,0348 | |||
| JKHY / Jack Henry & Associates, Inc. | 0,01 | 0,00 | 2,12 | -1,35 | 0,1387 | -0,0227 | |||
| UTHR / United Therapeutics Corporation | 0,01 | 0,00 | 2,12 | -6,78 | 0,1382 | -0,0321 | |||
| NTRS / Northern Trust Corporation | 0,02 | 0,06 | 2,02 | 28,64 | 0,1320 | 0,0141 | |||
| ELV / Elevance Health, Inc. | 0,00 | 0,00 | 1,88 | -10,61 | 0,1228 | -0,0349 | |||
| YOU / Clear Secure, Inc. | 0,07 | 0,65 | 1,85 | 7,80 | 0,1209 | -0,0079 | |||
| COHU / Cohu, Inc. | 0,10 | 14,79 | 1,84 | 50,16 | 0,1205 | 0,0283 | |||
| MOH / Molina Healthcare, Inc. | 0,01 | 0,00 | 1,84 | -9,56 | 0,1199 | -0,0323 | |||
| DIOD / Diodes Incorporated | 0,03 | 0,34 | 1,77 | 22,95 | 0,1158 | 0,0076 | |||
| RVTY / Revvity, Inc. | 0,02 | 0,00 | 1,76 | -8,59 | 0,1147 | -0,0294 | |||
| SYK / Stryker Corporation | 0,00 | -30,18 | 1,70 | -25,81 | 0,1112 | -0,0609 | |||
| CTRA / Coterra Energy Inc. | 0,07 | 0,00 | 1,65 | -12,19 | 0,1077 | -0,0331 | |||
| PCTY / Paylocity Holding Corporation | 0,01 | 0,00 | 1,62 | -3,23 | 0,1057 | -0,0198 | |||
| JNJ / Johnson & Johnson | 0,01 | 0,00 | 1,60 | -7,88 | 0,1046 | -0,0258 | |||
| MEDP / Medpace Holdings, Inc. | 0,00 | 0,00 | 1,40 | 3,01 | 0,0917 | -0,0105 | |||
| MDT / Medtronic plc | 0,02 | -0,46 | 1,40 | -3,44 | 0,0916 | -0,0173 | |||
| BBSI / Barrett Business Services, Inc. | 0,03 | 0,00 | 1,38 | 1,32 | 0,0903 | -0,0120 | |||
| MRK / Merck & Co., Inc. | 0,02 | 0,00 | 1,36 | -11,81 | 0,0888 | -0,0268 | |||
| INCY / Incyte Corporation | 0,02 | 0,00 | 1,30 | 12,51 | 0,0846 | -0,0018 | |||
| NHC / National HealthCare Corporation | 0,01 | 0,00 | 1,28 | 15,33 | 0,0836 | 0,0003 | |||
| PYPL / PayPal Holdings, Inc. | 0,02 | -0,07 | 1,18 | 13,80 | 0,0770 | -0,0007 | |||
| PBH / Prestige Consumer Healthcare Inc. | 0,01 | 0,95 | 1,16 | -6,29 | 0,0760 | -0,0171 | |||
| DVA / DaVita Inc. | 0,01 | 0,00 | 1,13 | -6,85 | 0,0737 | -0,0172 | |||
| APP / AppLovin Corporation | 0,00 | 1,05 | 0,0686 | 0,0686 | |||||
| KAI / Kadant Inc. | 0,00 | -19,95 | 1,02 | -24,59 | 0,0669 | -0,0350 | |||
| AB / AllianceBernstein Holding L.P. - Limited Partnership | 0,02 | 3,00 | 0,97 | 9,88 | 0,0632 | -0,0029 | |||
| PLTR / Palantir Technologies Inc. | 0,01 | 0,96 | 0,0624 | 0,0624 | |||||
| USB / U.S. Bancorp | 0,02 | 0,91 | 0,0591 | 0,0591 | |||||
| PANW / Palo Alto Networks, Inc. | 0,00 | 0,90 | 0,0591 | 0,0591 | |||||
| KFY / Korn Ferry | 0,01 | 0,00 | 0,90 | 8,08 | 0,0586 | -0,0036 | |||
| INSP / Inspire Medical Systems, Inc. | 0,01 | 0,00 | 0,88 | -18,52 | 0,0575 | -0,0235 | |||
| TSEM / Tower Semiconductor Ltd. | 0,02 | 1,76 | 0,88 | 23,76 | 0,0572 | 0,0041 | |||
| ABG / Asbury Automotive Group, Inc. | 0,00 | 0,00 | 0,86 | 8,15 | 0,0564 | -0,0036 | |||
| IEF / iShares Trust - iShares 7-10 Year Treasury Bond ETF | 0,01 | 0,82 | 0,0538 | 0,0538 | |||||
| VVX / V2X, Inc. | 0,02 | 0,00 | 0,81 | -0,97 | 0,0531 | -0,0085 | |||
| CNO / CNO Financial Group, Inc. | 0,02 | 0,00 | 0,80 | -7,41 | 0,0523 | -0,0125 | |||
| HIG / The Hartford Insurance Group, Inc. | 0,01 | -3,59 | 0,77 | -1,03 | 0,0500 | -0,0081 | |||
| RSG / Republic Services, Inc. | 0,00 | 31,21 | 0,75 | 33,63 | 0,0491 | 0,0069 | |||
| APAM / Artisan Partners Asset Management Inc. | 0,02 | 0,00 | 0,72 | 13,50 | 0,0472 | -0,0006 | |||
| CW / Curtiss-Wright Corporation | 0,00 | 0,00 | 0,70 | 54,19 | 0,0458 | 0,0116 | |||
| CSGS / CSG Systems International, Inc. | 0,01 | 0,00 | 0,65 | 8,11 | 0,0427 | -0,0027 | |||
| SIGI / Selective Insurance Group, Inc. | 0,01 | 0,00 | 0,65 | -5,27 | 0,0423 | -0,0090 | |||
| AX / Axos Financial, Inc. | 0,01 | 0,54 | 0,0355 | 0,0355 | |||||
| CSL / Carlisle Companies Incorporated | 0,00 | 0,00 | 0,52 | 9,62 | 0,0343 | -0,0016 | |||
| AMBA / Ambarella, Inc. | 0,01 | 0,52 | 0,0340 | 0,0340 | |||||
| INTA / Intapp, Inc. | 0,01 | 0,49 | 0,0320 | 0,0320 | |||||
| TDG / TransDigm Group Incorporated | 0,00 | 0,00 | 0,48 | 10,05 | 0,0315 | -0,0014 | |||
| CF / CF Industries Holdings, Inc. | 0,01 | 0,00 | 0,47 | 17,62 | 0,0310 | 0,0008 | |||
| IBM / International Business Machines Corporation | 0,00 | -73,15 | 0,46 | -68,21 | 0,0300 | -0,0783 | |||
| BWXT / BWX Technologies, Inc. | 0,00 | 0,00 | 0,43 | 46,44 | 0,0282 | 0,0060 | |||
| MUSA / Murphy USA Inc. | 0,00 | 0,00 | 0,42 | -13,51 | 0,0272 | -0,0089 | |||
| NDSN / Nordson Corporation | 0,00 | -81,19 | 0,40 | -80,02 | 0,0260 | -0,1231 | |||
| VIRT / Virtu Financial, Inc. | 0,01 | 0,00 | 0,36 | 17,53 | 0,0237 | 0,0005 | |||
| POOL / Pool Corporation | 0,00 | 0,00 | 0,30 | -8,26 | 0,0196 | -0,0050 | |||
| NEM / Newmont Corporation | 0,00 | 0,26 | 0,0167 | 0,0167 | |||||
| ENR / Energizer Holdings, Inc. | 0,01 | -37,79 | 0,23 | -58,12 | 0,0152 | -0,0264 | |||
| COST / Costco Wholesale Corporation | 0,00 | 0,23 | 0,0149 | 0,0149 | |||||
| CAT / Caterpillar Inc. | 0,00 | 0,22 | 0,0147 | 0,0147 | |||||
| XOM / Exxon Mobil Corporation | 0,00 | 0,21 | 0,0139 | 0,0139 | |||||
| VTRS / Viatris Inc. | 0,02 | -17,51 | 0,21 | -15,32 | 0,0137 | -0,0049 | |||
| WMT / Walmart Inc. | 0,00 | 0,21 | 0,0134 | 0,0134 | |||||
| PG / The Procter & Gamble Company | 0,00 | 0,20 | 0,0131 | 0,0131 | |||||
| KFRC / Kforce Inc. | 0,00 | -100,00 | 0,00 | 0,0000 | |||||
| THO / THOR Industries, Inc. | 0,00 | -100,00 | 0,00 | 0,0000 | |||||
| BIO / Bio-Rad Laboratories, Inc. | 0,00 | -100,00 | 0,00 | 0,0000 | |||||
| MCHP / Microchip Technology Incorporated | 0,00 | -100,00 | 0,00 | 0,0000 | |||||
| SAIC / Science Applications International Corporation | 0,00 | -100,00 | 0,00 | 0,0000 | |||||
| CAVA / CAVA Group, Inc. | 0,00 | -100,00 | 0,00 | 0,0000 | |||||
| ICFI / ICF International, Inc. | 0,00 | -100,00 | 0,00 | 0,0000 | |||||
| TMO / Thermo Fisher Scientific Inc. | 0,00 | -100,00 | 0,00 | 0,0000 | |||||
| HAL / Halliburton Company | 0,00 | -100,00 | 0,00 | -100,00 | -0,0920 |