Grundlæggende statistik
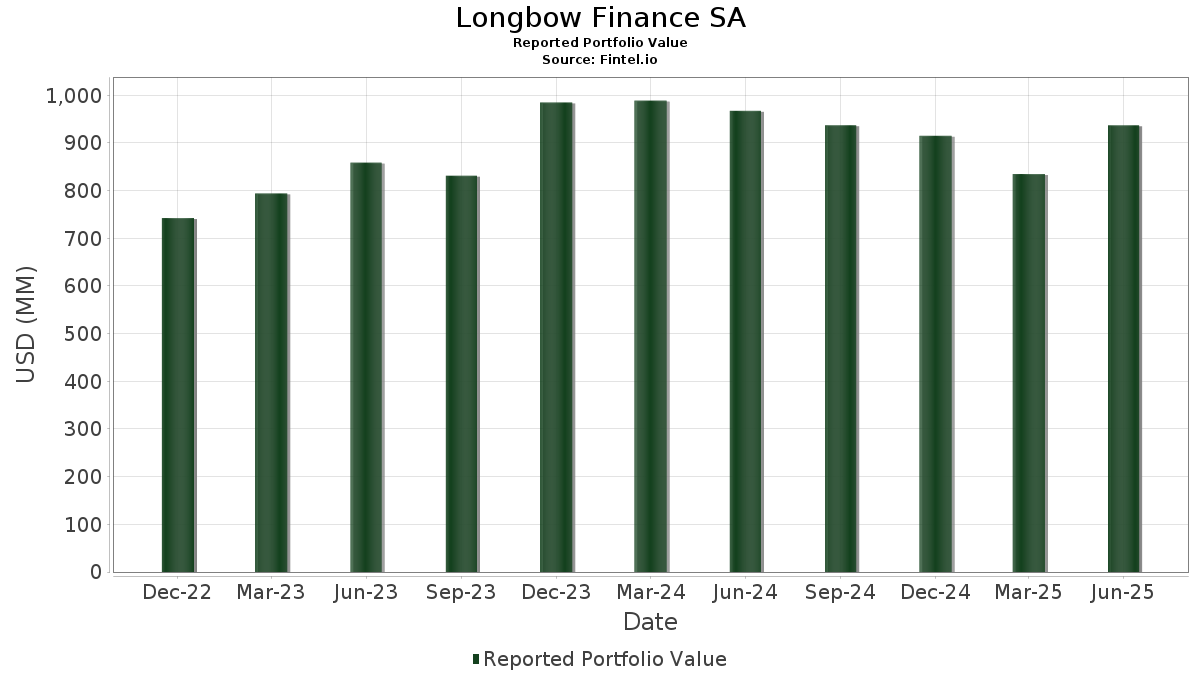
| Porteføljeværdi | $ 590.622.764 |
| Nuværende stillinger | 62 |
Seneste beholdninger, ydeevne, AUM (fra 13F, 13D)
Longbow Finance SA har afsløret 62 samlede besiddelser i deres seneste SEC-arkivering. Den seneste porteføljeværdi er beregnet til at være $ 590.622.764 USD. Faktiske aktiver under forvaltning (AUM) er denne værdi plus kontanter (som ikke er oplyst). Longbow Finance SAs største beholdninger er NVIDIA Corporation (US:NVDA) , Microsoft Corporation (US:MSFT) , Apple Inc. (US:AAPL) , Alphabet Inc. (US:GOOG) , and Amazon.com, Inc. (US:AMZN) . Longbow Finance SAs nye stillinger omfatter The Travelers Companies, Inc. (US:TRV) , O'Reilly Automotive, Inc. (US:ORLY) , Hilton Worldwide Holdings Inc. (US:HLT) , Foothills Exploration, Inc. (US:FTXP) , and United Rentals, Inc. (US:URI) .
Top øger dette kvartal
Vi bruger ændringen i porteføljeallokeringen, fordi dette er den mest meningsfulde metrik. Ændringer kan skyldes handler eller ændringer i aktiekurser.
| Sikkerhed | Aktier (MM) |
Værdi (MM$) |
Portefølje % | ΔPortefølje % |
|---|---|---|---|---|
| TRV / The Travelers Companies, Inc. | 0,03 | 8,18 | 1,3849 | 1,3849 |
| ORLY / O'Reilly Automotive, Inc. | 0,08 | 6,97 | 1,1809 | 1,1809 |
| HLT / Hilton Worldwide Holdings Inc. | 0,02 | 6,13 | 1,0373 | 1,0373 |
| FTXP / Foothills Exploration, Inc. | 0,01 | 6,10 | 1,0336 | 1,0336 |
| MNST / Monster Beverage Corporation | 0,08 | 6,03 | 1,0210 | 1,0210 |
| FLEX / Flex Ltd. | 0,13 | 7,72 | 1,3063 | 0,7618 |
| URI / United Rentals, Inc. | 0,01 | 4,30 | 0,7276 | 0,7276 |
| BRK.B / Berkshire Hathaway Inc. | 0,03 | 12,85 | 2,1755 | 0,6270 |
| LLY / Eli Lilly and Company | 0,01 | 7,98 | 1,3503 | 0,3476 |
| LBRX / LB Pharmaceuticals Inc | 0,08 | 1,83 | 0,3103 | 0,3103 |
Top falder i dette kvartal
Vi bruger ændringen i porteføljeallokeringen, fordi dette er den mest meningsfulde metrik. Ændringer kan skyldes handler eller ændringer i aktiekurser.
| Sikkerhed | Aktier (MM) |
Værdi (MM$) |
Portefølje % | ΔPortefølje % |
|---|---|---|---|---|
| NVDA / NVIDIA Corporation | 0,25 | 46,67 | -8,8699 | |
| MSFT / Microsoft Corporation | 0,08 | 38,95 | -7,3007 | |
| GOOG / Alphabet Inc. | 0,10 | 30,50 | -4,0468 | |
| AVGO / Broadcom Inc. | 0,07 | 24,12 | -3,7974 | |
| AMZN / Amazon.com, Inc. | 0,11 | 25,09 | -3,4230 | |
| JPM / JPMorgan Chase & Co. | 0,05 | 15,13 | -2,6900 | |
| XOM / Exxon Mobil Corporation | 0,18 | 21,48 | -2,5038 | |
| META / Meta Platforms, Inc. | 0,02 | 11,72 | 1,9840 | -2,0478 |
| ORCL / Oracle Corporation | 0,02 | 3,72 | -1,6809 | |
| WMT / Walmart Inc. | 0,09 | 9,90 | -1,4361 |
13F og Fondsarkivering
Denne formular blev indsendt den 2026-02-12 for rapporteringsperioden 2025-12-31. Klik på linkikonet for at se den fulde transaktionshistorik.
Opgrader for at låse op for premium-data og eksportere til Excel ![]() .
.
| Sikkerhed | Type | Gennemsnitlig aktiekurs | Aktier (MM) |
Δ Aktier (%) |
Værdi ($MM) |
ΔVærdi (%) |
Portefølje (%) |
ΔPortefølje (%) |
|
|---|---|---|---|---|---|---|---|---|---|
| NVDA / NVIDIA Corporation | 0,25 | -48,04 | 46,67 | -48,07 | -8,8699 | ||||
| MSFT / Microsoft Corporation | 0,08 | -43,61 | 38,95 | -47,35 | -7,3007 | ||||
| AAPL / Apple Inc. | 0,14 | -44,16 | 38,91 | -40,38 | 6,5884 | 0,1466 | |||
| GOOG / Alphabet Inc. | 0,10 | -42,27 | 30,50 | -25,62 | -4,0468 | ||||
| AMZN / Amazon.com, Inc. | 0,11 | -31,19 | 25,09 | -27,67 | -3,4230 | ||||
| AVGO / Broadcom Inc. | 0,07 | -40,24 | 24,12 | -37,31 | -3,7974 | ||||
| XOM / Exxon Mobil Corporation | 0,18 | -20,66 | 21,48 | -15,31 | -2,5038 | ||||
| JPM / JPMorgan Chase & Co. | 0,05 | -45,67 | 15,13 | -44,50 | -2,6900 | ||||
| ABBV / AbbVie Inc. | 0,06 | -38,16 | 13,97 | -38,98 | 2,3648 | 0,1060 | |||
| BRK.B / Berkshire Hathaway Inc. | 0,03 | -18,09 | 12,85 | -18,11 | 2,1755 | 0,6270 | |||
| META / Meta Platforms, Inc. | 0,02 | -68,09 | 11,72 | -71,32 | 1,9840 | -2,0478 | |||
| MCK / McKesson Corporation | 0,01 | 2,97 | 11,55 | 9,33 | -1,0430 | ||||
| WMT / Walmart Inc. | 0,09 | -37,03 | 9,90 | -31,94 | -1,4361 | ||||
| WFC / Wells Fargo & Company | 0,11 | -28,70 | 9,88 | -20,72 | -1,2303 | ||||
| CBOE / Cboe Global Markets, Inc. | 0,04 | -31,53 | 9,82 | -29,92 | -1,3834 | ||||
| PANW / Palo Alto Networks, Inc. | 0,05 | -22,09 | 9,18 | -29,52 | 1,5548 | 0,2688 | |||
| CDNS / Cadence Design Systems, Inc. | 0,03 | 9,08 | 0,0000 | ||||||
| C / Citigroup Inc. | 0,07 | -28,12 | 8,31 | -17,37 | -0,9923 | ||||
| HWM / Howmet Aerospace Inc. | 0,04 | 0,00 | 8,28 | 4,48 | -0,7824 | ||||
| TRV / The Travelers Companies, Inc. | 0,03 | 8,18 | 1,3849 | 1,3849 | |||||
| CAT / Caterpillar Inc. | 0,01 | -49,80 | 8,11 | -39,73 | 1,3728 | 0,0451 | |||
| STT / State Street Corporation | 0,06 | -33,17 | 8,04 | -25,68 | -1,0683 | ||||
| APH / Amphenol Corporation | 0,06 | 0,00 | 8,03 | 9,21 | -0,7255 | ||||
| LLY / Eli Lilly and Company | 0,01 | -44,27 | 7,98 | -21,51 | 1,3503 | 0,3476 | |||
| GSCE / GS Connect S&P GSCI Enhanced Commodity Total Return ETN | 0,01 | -46,61 | 7,96 | -41,06 | -1,3332 | ||||
| FLEX / Flex Ltd. | 0,13 | 34,17 | 7,72 | 39,87 | 1,3063 | 0,7618 | |||
| CEG / Constellation Energy Corporation | 0,02 | -31,86 | 7,65 | -26,85 | 1,2953 | 0,2631 | |||
| GE / General Electric Company | 0,02 | -36,41 | 7,29 | -34,88 | -1,1048 | ||||
| ORLY / O'Reilly Automotive, Inc. | 0,08 | 6,97 | 1,1809 | 1,1809 | |||||
| MA / Mastercard Incorporated | 0,01 | -49,38 | 6,65 | -49,20 | 1,1261 | -0,1659 | |||
| WELL / Welltower Inc. | 0,04 | -39,42 | 6,62 | -36,88 | -1,0355 | ||||
| WAB / Westinghouse Air Brake Technologies Corporation | 0,03 | -27,86 | 6,13 | -23,20 | -0,7880 | ||||
| HLT / Hilton Worldwide Holdings Inc. | 0,02 | 6,13 | 1,0373 | 1,0373 | |||||
| AXP / American Express Company | 0,02 | -50,35 | 6,11 | -44,69 | 1,0350 | -0,0559 | |||
| FTXP / Foothills Exploration, Inc. | 0,01 | 6,10 | 1,0336 | 1,0336 | |||||
| MNST / Monster Beverage Corporation | 0,08 | 6,03 | 1,0210 | 1,0210 | |||||
| BAC / Bank of America Corporation | 0,11 | -26,85 | 6,02 | -22,01 | 1,0195 | 0,2575 | |||
| TJX / The TJX Companies, Inc. | 0,04 | -51,44 | 5,79 | -48,39 | -1,1065 | ||||
| MCD / McDonald's Corporation | 0,02 | -32,56 | 5,74 | -32,18 | 0,9720 | 0,1367 | |||
| WMB / The Williams Companies, Inc. | 0,09 | -46,66 | 5,60 | -49,39 | 0,9476 | -0,1439 | |||
| KO / The Coca-Cola Company | 0,08 | -30,61 | 5,59 | -26,86 | -0,7543 | ||||
| GILD / Gilead Sciences, Inc. | 0,04 | -52,09 | 5,46 | -47,03 | -1,0168 | ||||
| PWR / Quanta Services, Inc. | 0,01 | -23,35 | 5,40 | -21,95 | -0,6822 | ||||
| COR / Cencora, Inc. | 0,02 | -53,25 | 5,33 | -49,47 | -1,0415 | ||||
| FCX / Freeport-McMoRan Inc. | 0,10 | -50,10 | 5,25 | -35,38 | -0,8020 | ||||
| LIT / Global X Funds - Global X Lithium & Battery Tech ETF | 0,08 | 0,00 | 5,20 | 14,42 | -0,4489 | ||||
| PLTR / Palantir Technologies Inc. | 0,03 | -21,14 | 5,20 | -23,16 | -0,6681 | ||||
| CRH / CRH plc | 0,04 | -44,74 | 5,19 | -42,49 | 0,8790 | -0,0119 | |||
| RL / Ralph Lauren Corporation | 0,01 | -45,38 | 4,91 | -38,40 | 0,8306 | 0,0446 | |||
| GEV / GE Vernova Inc. | 0,01 | -26,03 | 4,57 | -21,37 | 0,7739 | 0,2001 | |||
| BSX / Boston Scientific Corporation | 0,05 | -61,21 | 4,51 | -62,12 | -1,1742 | ||||
| SO / The Southern Company | 0,05 | -30,42 | 4,46 | -35,98 | -0,6877 | ||||
| RCL / Royal Caribbean Cruises Ltd. | 0,02 | -18,09 | 4,36 | -29,39 | -0,6097 | ||||
| AMD / Advanced Micro Devices, Inc. | 0,02 | -56,12 | 4,30 | -41,91 | -0,7303 | ||||
| URI / United Rentals, Inc. | 0,01 | 4,30 | 0,7276 | 0,7276 | |||||
| CSCO / Cisco Systems, Inc. | 0,05 | -29,69 | 4,19 | -20,85 | -0,5225 | ||||
| ORCL / Oracle Corporation | 0,02 | -68,46 | 3,72 | -78,15 | -1,6809 | ||||
| NFLX / Netflix, Inc. | 0,04 | 269,76 | 3,64 | -71,08 | 0,6155 | -0,6253 | |||
| AMAT / Applied Materials, Inc. | 0,01 | -75,43 | 2,74 | -69,16 | -0,8763 | ||||
| LBRX / LB Pharmaceuticals Inc | 0,08 | 1,83 | 0,3103 | 0,3103 | |||||
| INKT / MiNK Therapeutics, Inc. | 0,02 | 0,00 | 0,19 | -20,60 | -0,0230 | ||||
| PLUG / Plug Power Inc. | 0,02 | 0,00 | 0,04 | -14,58 | -0,0048 | ||||
| LIN / Linde plc | 0,00 | -100,00 | 0,00 | 0,0000 | |||||
| RBRK / Rubrik, Inc. | 0,00 | -100,00 | 0,00 | 0,0000 | |||||
| RSG / Republic Services, Inc. | 0,00 | -100,00 | 0,00 | 0,0000 | |||||
| HD / The Home Depot, Inc. | 0,00 | -100,00 | 0,00 | 0,0000 | |||||
| CYBR / CyberArk Software Ltd. | 0,00 | -100,00 | 0,00 | 0,0000 | |||||
| ADP / Automatic Data Processing, Inc. | 0,00 | -100,00 | 0,00 | 0,0000 | |||||
| TMUS / T-Mobile US, Inc. | 0,00 | -100,00 | 0,00 | 0,0000 | |||||
| V / Visa Inc. | 0,00 | -100,00 | 0,00 | 0,0000 | |||||
| KR / The Kroger Co. | 0,00 | -100,00 | 0,00 | 0,0000 | |||||
| AZO / AutoZone, Inc. | 0,00 | -100,00 | 0,00 | 0,0000 | |||||
| UBER / Uber Technologies, Inc. | 0,00 | -100,00 | 0,00 | 0,0000 | |||||
| BKNG / Booking Holdings Inc. | 0,00 | -100,00 | 0,00 | 0,0000 | |||||
| CAH / Cardinal Health, Inc. | 0,00 | -100,00 | 0,00 | 0,0000 | |||||
| AJG / Arthur J. Gallagher & Co. | 0,00 | -100,00 | 0,00 | 0,0000 | |||||
| USFD / US Foods Holding Corp. | 0,00 | -100,00 | 0,00 | 0,0000 |