Grundlæggende statistik
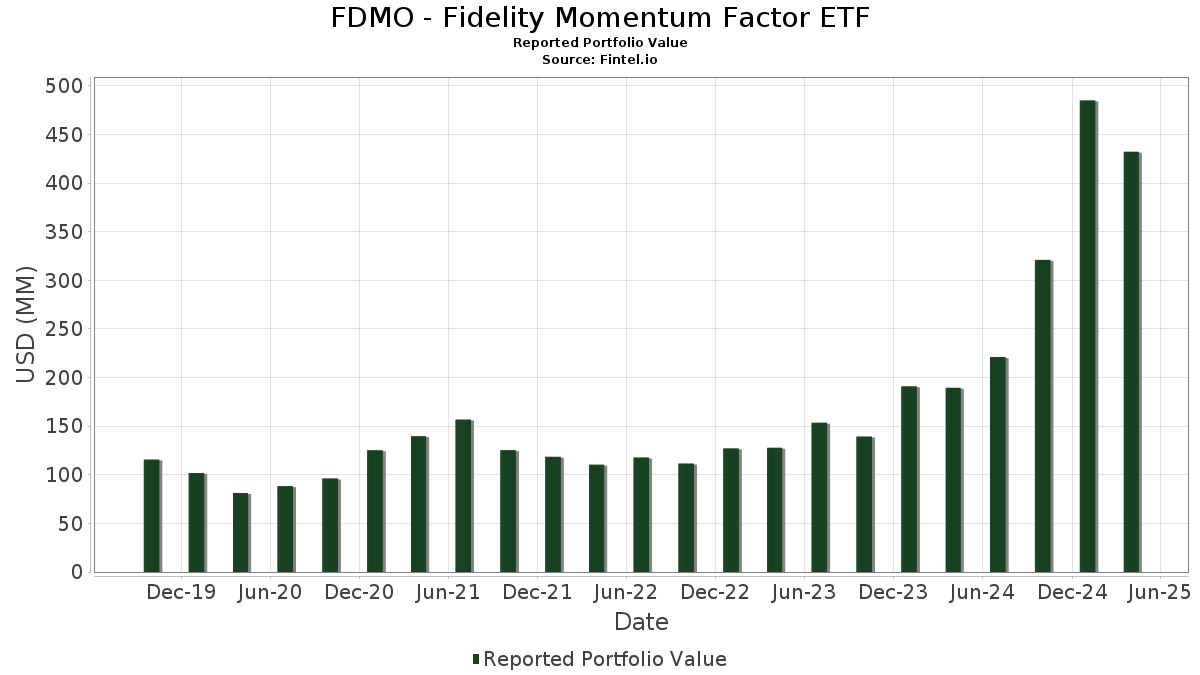
| Porteføljeværdi | $ 432.222.989 |
| Nuværende stillinger | 129 |
Seneste beholdninger, ydeevne, AUM (fra 13F, 13D)
FDMO - Fidelity Momentum Factor ETF har afsløret 129 samlede besiddelser i deres seneste SEC-arkivering. Den seneste porteføljeværdi er beregnet til at være $ 432.222.989 USD. Faktiske aktiver under forvaltning (AUM) er denne værdi plus kontanter (som ikke er oplyst). FDMO - Fidelity Momentum Factor ETFs største beholdninger er Apple Inc. (US:AAPL) , Microsoft Corporation (US:MSFT) , NVIDIA Corporation (US:NVDA) , Amazon.com, Inc. (US:AMZN) , and Alphabet Inc. (US:GOOGL) . FDMO - Fidelity Momentum Factor ETFs nye stillinger omfatter Strategy Inc (US:MSTR) , Corcept Therapeutics Incorporated (US:CORT) , InterDigital, Inc. (US:IDCC) , Doximity, Inc. (US:DOCS) , and Insmed Incorporated (US:INSM) .
Top øger dette kvartal
Vi bruger ændringen i porteføljeallokeringen, fordi dette er den mest meningsfulde metrik. Ændringer kan skyldes handler eller ændringer i aktiekurser.
| Sikkerhed | Aktier (MM) |
Værdi (MM$) |
Portefølje % | ΔPortefølje % |
|---|---|---|---|---|
| 9,20 | 9,20 | 2,1732 | 2,0646 | |
| 0,01 | 3,96 | 0,9357 | 0,9357 | |
| 0,05 | 3,44 | 0,8121 | 0,8121 | |
| 0,02 | 3,32 | 0,7842 | 0,7842 | |
| 0,06 | 3,21 | 0,7587 | 0,7587 | |
| 0,04 | 2,95 | 0,6978 | 0,6978 | |
| 0,06 | 2,94 | 0,6953 | 0,6953 | |
| 0,01 | 2,87 | 0,6778 | 0,6778 | |
| 0,06 | 2,76 | 0,6523 | 0,6523 | |
| 0,04 | 2,57 | 0,6070 | 0,6070 |
Top falder i dette kvartal
Vi bruger ændringen i porteføljeallokeringen, fordi dette er den mest meningsfulde metrik. Ændringer kan skyldes handler eller ændringer i aktiekurser.
| Sikkerhed | Aktier (MM) |
Værdi (MM$) |
Portefølje % | ΔPortefølje % |
|---|---|---|---|---|
| 0,01 | 2,65 | 0,6272 | -0,9167 | |
| 0,00 | 0,00 | -0,8018 | ||
| 0,05 | 2,70 | 0,6376 | -0,6419 | |
| 0,00 | 0,00 | -0,6241 | ||
| 0,00 | 0,00 | -0,5951 | ||
| 0,03 | 7,98 | 1,8849 | -0,5743 | |
| 0,00 | 0,00 | -0,5458 | ||
| 0,00 | 0,00 | -0,5253 | ||
| 0,00 | 0,00 | -0,5147 | ||
| 0,09 | 14,82 | 3,5014 | -0,5103 |
13F og Fondsarkivering
Denne formular blev indsendt den 2025-06-26 for rapporteringsperioden 2025-04-30. Klik på linkikonet for at se den fulde transaktionshistorik.
Opgrader for at låse op for premium-data og eksportere til Excel ![]() .
.
| Sikkerhed | Type | Gennemsnitlig aktiekurs | Aktier (MM) |
Δ Aktier (%) |
Δ Aktier (%) |
Værdi ($MM) |
Portefølje (%) |
ΔPortefølje (%) |
|
|---|---|---|---|---|---|---|---|---|---|
| AAPL / Apple Inc. | 0,14 | -2,08 | 29,21 | -11,83 | 6,9017 | 0,0650 | |||
| MSFT / Microsoft Corporation | 0,07 | -1,50 | 27,08 | -6,20 | 6,3983 | 0,4406 | |||
| NVDA / NVIDIA Corporation | 0,23 | -0,95 | 24,63 | -10,15 | 5,8191 | 0,1626 | |||
| AMZN / Amazon.com, Inc. | 0,09 | -0,84 | 15,77 | -23,06 | 3,7274 | -0,5038 | |||
| GOOGL / Alphabet Inc. | 0,09 | -2,06 | 14,82 | -23,77 | 3,5014 | -0,5103 | |||
| BRK.B / Berkshire Hathaway Inc. | 0,02 | -1,96 | 11,06 | 11,55 | 2,6128 | 0,5670 | |||
| META / Meta Platforms, Inc. | 0,02 | -2,88 | 10,69 | -22,64 | 2,5252 | -0,3256 | |||
| AVGO / Broadcom Inc. | 0,05 | -10,19 | 9,88 | -21,88 | 2,3347 | -0,2754 | |||
| LLY / Eli Lilly and Company | 0,01 | -1,17 | 9,28 | 9,55 | 2,1936 | 0,4446 | |||
| US31635A3032 / Fidelity Securities Lending Cash Central Fund | 9,20 | 1.647,31 | 9,20 | 1.648,48 | 2,1732 | 2,0646 | |||
| JPM / JPMorgan Chase & Co. | 0,03 | -7,36 | 8,09 | -15,22 | 1,9107 | -0,0577 | |||
| TSLA / Tesla, Inc. | 0,03 | -4,01 | 7,98 | -33,06 | 1,8849 | -0,5743 | |||
| UNH / UnitedHealth Group Incorporated | 0,01 | 111,48 | 5,58 | 79,91 | 1,3183 | -0,3343 | |||
| PLTR / Palantir Technologies Inc. | 0,05 | -49,72 | 5,48 | -27,80 | 1,2948 | -0,2716 | |||
| NFLX / Netflix, Inc. | 0,00 | -8,07 | 5,17 | 6,51 | 1,2221 | 0,2200 | |||
| XOM / Exxon Mobil Corporation | 0,05 | 6,46 | 4,89 | 5,28 | 1,1550 | 0,1967 | |||
| COST / Costco Wholesale Corporation | 0,00 | -4,67 | 4,49 | -3,23 | 1,0607 | 0,1032 | |||
| BAC / Bank of America Corporation | 0,11 | -6,99 | 4,45 | -19,89 | 1,0509 | -0,0948 | |||
| BSX / Boston Scientific Corporation | 0,04 | -15,39 | 4,41 | -14,97 | 1,0413 | -0,0282 | |||
| PGR / The Progressive Corporation | 0,02 | -2,05 | 4,37 | 11,99 | 1,0332 | 0,2273 | |||
| ISRG / Intuitive Surgical, Inc. | 0,01 | -10,19 | 4,33 | -19,00 | 1,0233 | -0,0801 | |||
| WMT / Walmart Inc. | 0,04 | -5,88 | 4,33 | -6,76 | 1,0230 | 0,0648 | |||
| ORCL / Oracle Corporation | 0,03 | 105,57 | 4,31 | 179,91 | 1,0172 | -0,0880 | |||
| PG / The Procter & Gamble Company | 0,02 | -1,68 | 4,02 | -3,72 | 0,9492 | 0,0883 | |||
| MSTR / Strategy Inc | 0,01 | 3,96 | 0,9357 | 0,9357 | |||||
| GS / The Goldman Sachs Group, Inc. | 0,01 | -13,57 | 3,68 | -26,10 | 0,8692 | -0,1581 | |||
| BKNG / Booking Holdings Inc. | 0,00 | 12,62 | 3,55 | 21,25 | 0,8386 | 0,2344 | |||
| GE / General Electric Company | 0,02 | -10,46 | 3,51 | -11,34 | 0,8296 | 0,0122 | |||
| AXP / American Express Company | 0,01 | -11,25 | 3,44 | -25,53 | 0,8122 | -0,1403 | |||
| CORT / Corcept Therapeutics Incorporated | 0,05 | 3,44 | 0,8121 | 0,8121 | |||||
| MS / Morgan Stanley | 0,03 | 126,52 | 3,39 | 185,76 | 0,8016 | 0,0242 | |||
| PM / Philip Morris International Inc. | 0,02 | -0,97 | 3,37 | 30,36 | 0,7954 | 0,2624 | |||
| KO / The Coca-Cola Company | 0,05 | -0,37 | 3,35 | 13,85 | 0,7906 | 0,1842 | |||
| MSI / Motorola Solutions, Inc. | 0,01 | -9,38 | 3,33 | -14,96 | 0,7872 | -0,0212 | |||
| IDCC / InterDigital, Inc. | 0,02 | 3,32 | 0,7842 | 0,7842 | |||||
| TJX / The TJX Companies, Inc. | 0,03 | 6,81 | 3,23 | 10,14 | 0,7621 | 0,1577 | |||
| DOCS / Doximity, Inc. | 0,06 | 3,21 | 0,7587 | 0,7587 | |||||
| RTX / RTX Corporation | 0,02 | -5,59 | 3,08 | -7,67 | 0,7285 | 0,0395 | |||
| PODD / Insulet Corporation | 0,01 | 223,76 | 3,00 | 301,74 | 0,7093 | -0,1368 | |||
| BK / The Bank of New York Mellon Corporation | 0,04 | -10,77 | 2,98 | -16,52 | 0,7036 | -0,0324 | |||
| INSM / Insmed Incorporated | 0,04 | 2,95 | 0,6978 | 0,6978 | |||||
| ACIW / ACI Worldwide, Inc. | 0,06 | 2,94 | 0,6953 | 0,6953 | |||||
| NTRA / Natera, Inc. | 0,02 | -30,30 | 2,91 | -40,56 | 0,6881 | -0,3226 | |||
| GDDY / GoDaddy Inc. | 0,02 | -22,93 | 2,89 | -31,75 | 0,6833 | -0,1910 | |||
| UTHR / United Therapeutics Corporation | 0,01 | 2,87 | 0,6778 | 0,6778 | |||||
| T / AT&T Inc. | 0,10 | -4,24 | 2,83 | 11,78 | 0,6681 | 0,1461 | |||
| ANET / Arista Networks Inc | 0,03 | -16,23 | 2,82 | -40,21 | 0,6668 | -0,3070 | |||
| DFS / Discover Financial Services | 0,02 | 119,04 | 2,79 | 245,78 | 0,6586 | -0,0283 | |||
| GLW / Corning Incorporated | 0,06 | 2,76 | 0,6523 | 0,6523 | |||||
| CAT / Caterpillar Inc. | 0,01 | 0,39 | 2,73 | -16,43 | 0,6455 | -0,0290 | |||
| ADP / Automatic Data Processing, Inc. | 0,01 | 49,15 | 2,71 | 103,84 | 0,6398 | -0,4023 | |||
| HOOD / Robinhood Markets, Inc. | 0,05 | -53,96 | 2,70 | -56,48 | 0,6376 | -0,6419 | |||
| APP / AppLovin Corporation | 0,01 | -51,31 | 2,65 | -64,52 | 0,6272 | -0,9167 | |||
| KKR / KKR & Co. Inc. | 0,02 | -8,06 | 2,61 | -37,12 | 0,6178 | -0,2402 | |||
| GEV / GE Vernova Inc. | 0,01 | 185,38 | 2,60 | 589,39 | 0,6141 | 0,4130 | |||
| TT / Trane Technologies plc | 0,01 | 0,00 | 2,58 | 5,66 | 0,6086 | 0,1056 | |||
| GMED / Globus Medical, Inc. | 0,04 | 2,57 | 0,6070 | 0,6070 | |||||
| QTWO / Q2 Holdings, Inc. | 0,03 | -13,51 | 2,57 | -27,98 | 0,6064 | -0,1290 | |||
| CTAS / Cintas Corporation | 0,01 | -0,91 | 2,43 | 4,62 | 0,5731 | 0,0945 | |||
| TOST / Toast, Inc. | 0,07 | 2,41 | 0,5702 | 0,5702 | |||||
| HWM / Howmet Aerospace Inc. | 0,02 | -20,66 | 2,35 | -13,12 | 0,5553 | -0,0031 | |||
| LIN / Linde plc | 0,01 | -1,43 | 2,35 | 0,17 | 0,5549 | 0,0709 | |||
| COIN / Coinbase Global, Inc. | 0,01 | -31,34 | 2,31 | -52,18 | 0,5449 | -0,4503 | |||
| GM / General Motors Company | 0,05 | 24,00 | 2,28 | 13,43 | 0,5390 | 0,1240 | |||
| SOFI / SoFi Technologies, Inc. | 0,18 | 2,26 | 0,5342 | 0,5342 | |||||
| MMM / 3M Company | 0,02 | 2,21 | 0,5217 | 0,5217 | |||||
| SYF / Synchrony Financial | 0,04 | -17,78 | 2,20 | -38,07 | 0,5209 | -0,2138 | |||
| JCI / Johnson Controls International plc | 0,03 | 2,16 | 0,5101 | 0,5101 | |||||
| CVNA / Carvana Co. | 0,01 | 17,90 | 2,13 | 16,37 | 0,5023 | 0,1254 | |||
| IBKR / Interactive Brokers Group, Inc. | 0,01 | 2,11 | 0,4993 | 0,4993 | |||||
| DUOL / Duolingo, Inc. | 0,01 | 8,02 | 2,09 | 86,43 | 0,4934 | -0,1036 | |||
| TMUS / T-Mobile US, Inc. | 0,01 | -5,26 | 2,06 | 0,44 | 0,4875 | 0,0635 | |||
| PWR / Quanta Services, Inc. | 0,01 | 2,06 | 0,4867 | 0,4867 | |||||
| RCL / Royal Caribbean Cruises Ltd. | 0,01 | -2,23 | 2,03 | -21,17 | 0,4804 | -0,0520 | |||
| CHWY / Chewy, Inc. | 0,05 | 748,64 | 1,98 | 299,80 | 0,4669 | 0,1094 | |||
| AXON / Axon Enterprise, Inc. | 0,00 | 1,94 | 0,4574 | 0,4574 | |||||
| MO / Altria Group, Inc. | 0,03 | -0,03 | 1,83 | 13,17 | 0,4326 | 0,0989 | |||
| WMB / The Williams Companies, Inc. | 0,03 | 19,65 | 1,72 | 26,49 | 0,4074 | 0,1260 | |||
| CMI / Cummins Inc. | 0,01 | 78,37 | 1,72 | 108,13 | 0,4053 | -0,1905 | |||
| EME / EMCOR Group, Inc. | 0,00 | -4,93 | 1,68 | -14,99 | 0,3966 | -0,0108 | |||
| MTZ / MasTec, Inc. | 0,01 | 145,23 | 1,67 | 250,84 | 0,3948 | 0,0089 | |||
| FIX / Comfort Systems USA, Inc. | 0,00 | -13,91 | 1,67 | -21,63 | 0,3946 | -0,0452 | |||
| LNG / Cheniere Energy, Inc. | 0,01 | 45,51 | 1,53 | 113,21 | 0,3623 | -0,0211 | |||
| VRT / Vertiv Holdings Co | 0,02 | -9,36 | 1,51 | -33,84 | 0,3571 | -0,1145 | |||
| KMI / Kinder Morgan, Inc. | 0,06 | 18,89 | 1,47 | 13,81 | 0,3468 | 0,0806 | |||
| EAT / Brinker International, Inc. | 0,01 | 1,46 | 0,3453 | 0,3453 | |||||
| SRE / Sempra | 0,02 | 504,83 | 1,40 | 201,94 | 0,3318 | 0,0270 | |||
| PEG / Public Service Enterprise Group Incorporated | 0,02 | 21,29 | 1,40 | 16,02 | 0,3306 | 0,0818 | |||
| WELL / Welltower Inc. | 0,01 | -5,85 | 1,38 | 5,25 | 0,3270 | 0,0557 | |||
| NRG / NRG Energy, Inc. | 0,01 | 6,22 | 1,38 | 13,64 | 0,3270 | 0,0757 | |||
| CEG / Constellation Energy Corporation | 0,01 | 1,20 | 1,38 | -24,66 | 0,3258 | -0,0517 | |||
| CAVA / CAVA Group, Inc. | 0,01 | 15,36 | 1,34 | -21,08 | 0,3169 | -0,0336 | |||
| NI / NiSource Inc. | 0,03 | 1,30 | 0,3081 | 0,3081 | |||||
| UAL / United Airlines Holdings, Inc. | 0,02 | 1,30 | 0,3062 | 0,3062 | |||||
| EQIX / Equinix, Inc. | 0,00 | 36,96 | 1,23 | 29,89 | 0,2917 | -0,0044 | |||
| TRGP / Targa Resources Corp. | 0,01 | 13,10 | 1,23 | -1,84 | 0,2904 | 0,0322 | |||
| SHW / The Sherwin-Williams Company | 0,00 | -1,87 | 1,22 | -3,25 | 0,2888 | 0,0279 | |||
| TPL / Texas Pacific Land Corporation | 0,00 | 17,62 | 1,22 | 16,84 | 0,2887 | 0,0729 | |||
| VST / Vistra Corp. | 0,01 | -8,24 | 1,21 | -29,25 | 0,2870 | -0,0671 | |||
| TLNE / Talen Energy Corporation | 0,01 | 1,12 | 0,2644 | 0,2644 | |||||
| DTM / DT Midstream, Inc. | 0,01 | 24,67 | 1,12 | 19,89 | 0,2637 | 0,0716 | |||
| CASY / Casey's General Stores, Inc. | 0,00 | 12,28 | 1,10 | 31,90 | 0,2609 | 0,0001 | |||
| FOXA / Fox Corporation | 0,02 | 1,10 | 0,2601 | 0,2601 | |||||
| ECL / Ecolab Inc. | 0,00 | -2,03 | 1,09 | -1,53 | 0,2586 | 0,0292 | |||
| BKR / Baker Hughes Company | 0,03 | 92,72 | 1,09 | 139,43 | 0,2570 | 0,0185 | |||
| K / Kellanova | 0,01 | 1,09 | 0,2564 | 0,2564 | |||||
| CRH / CRH plc | 0,01 | -4,22 | 1,07 | -7,70 | 0,2522 | 0,0135 | |||
| SFM / Sprouts Farmers Market, Inc. | 0,01 | -23,31 | 1,04 | -17,17 | 0,2463 | -0,0134 | |||
| DLR / Digital Realty Trust, Inc. | 0,01 | -1,21 | 0,98 | -3,24 | 0,2327 | 0,0227 | |||
| APD / Air Products and Chemicals, Inc. | 0,00 | 118,95 | 0,96 | 132,52 | 0,2265 | 0,0098 | |||
| VTR / Ventas, Inc. | 0,01 | 0,93 | 0,2188 | 0,2188 | |||||
| SPG / Simon Property Group, Inc. | 0,01 | -8,48 | 0,92 | -17,19 | 0,2175 | -0,0118 | |||
| AVB / AvalonBay Communities, Inc. | 0,00 | 42,65 | 0,80 | 35,19 | 0,1898 | 0,0048 | |||
| CBRE / CBRE Group, Inc. | 0,01 | -12,60 | 0,80 | -26,27 | 0,1885 | -0,0346 | |||
| EQR / Equity Residential | 0,01 | -8,26 | 0,78 | -8,69 | 0,1839 | 0,0079 | |||
| IRM / Iron Mountain Incorporated | 0,01 | 5,92 | 0,73 | -6,41 | 0,1725 | 0,0114 | |||
| TTD / The Trade Desk, Inc. | 0,01 | 3,01 | 0,69 | -53,43 | 0,1635 | -0,1433 | |||
| IP / International Paper Company | 0,01 | 0,68 | 0,1602 | 0,1602 | |||||
| CRS / Carpenter Technology Corporation | 0,00 | -21,20 | 0,66 | -20,12 | 0,1548 | -0,0145 | |||
| PKG / Packaging Corporation of America | 0,00 | 5,54 | 0,64 | -7,83 | 0,1503 | 0,0078 | |||
| SMURFIT WESTROCK PLC / EC (IE00028FXN24) | 0,01 | -5,02 | 0,61 | -24,88 | 0,1436 | -0,0232 | |||
| JLL / Jones Lang LaSalle Incorporated | 0,00 | -11,35 | 0,56 | -28,64 | 0,1330 | -0,0300 | |||
| VNO / Vornado Realty Trust | 0,02 | -10,16 | 0,54 | -26,69 | 0,1279 | -0,0246 | |||
| SLG / SL Green Realty Corp. | 0,01 | 4,64 | 0,50 | -18,21 | 0,1189 | -0,0082 | |||
| FRPT / Freshpet, Inc. | 0,01 | -12,67 | 0,47 | -59,90 | 0,1108 | -0,1302 | |||
| LPX / Louisiana-Pacific Corporation | 0,01 | -16,00 | 0,46 | -38,08 | 0,1082 | -0,0443 | |||
| US31635A1051 / Fidelity Cash Central Fund | 0,26 | 45,06 | 0,26 | 45,30 | 0,0622 | 0,0247 | |||
| UST BILLS 0% 05/29/2025 / DBT (US912797NN35) | 0,02 | 0,0042 | 0,0042 | ||||||
| SN / SharkNinja, Inc. | 0,00 | -100,00 | 0,00 | -100,00 | -0,4105 | ||||
| MLI / Mueller Industries, Inc. | 0,00 | -100,00 | 0,00 | -100,00 | -0,3707 | ||||
| MPWR / Monolithic Power Systems, Inc. | 0,00 | -100,00 | 0,00 | -100,00 | -0,5951 | ||||
| RNA / Avidity Biosciences, Inc. | 0,00 | -100,00 | 0,00 | -100,00 | -0,5253 | ||||
| TDG / TransDigm Group Incorporated | 0,00 | -100,00 | 0,00 | -100,00 | -0,5147 | ||||
| TRU / TransUnion | 0,00 | -100,00 | 0,00 | -100,00 | -0,3958 | ||||
| RVMD / Revolution Medicines, Inc. | 0,00 | -100,00 | 0,00 | -100,00 | -0,5458 | ||||
| EVR / Evercore Inc. | 0,00 | -100,00 | 0,00 | -100,00 | -0,6241 | ||||
| DY / Dycom Industries, Inc. | 0,00 | -100,00 | 0,00 | -100,00 | -0,4108 | ||||
| GKOS / Glaukos Corporation | 0,00 | -100,00 | 0,00 | -100,00 | -0,8018 | ||||
| SP500 MIC EMIN FUTJUN25 HWAM5 / DE (N/A) | -0,00 | -0,0007 | -0,0007 |