Grundlæggende statistik
| Institutionelle ejere | 596 total, 558 long only, 2 short only, 36 long/short - change of -12,65% MRQ |
| Gennemsnitlig porteføljeallokering | 0.2720 % - change of -23,38% MRQ |
| Institutionelle aktier (lange) | 901.390.607 (ex 13D/G) - change of -29,23MM shares -3,14% MRQ |
| Institutionel værdi (lang) | $ 11.231.021 USD ($1000) |
Institutionelt ejerskab og aktionærer
Vale S.A. - Depositary Receipt (Common Stock) (US:VALE) har 596 institutionelle ejere og aktionærer, der har indsendt 13D/G- eller 13F-formularer til Securities Exchange Commission (SEC). Disse institutioner har i alt 901,390,607 aktier. Største aktionærer omfatter Capital World Investors, BlackRock, Inc., GQG Partners LLC, Fmr Llc, Arrowstreet Capital, Limited Partnership, AIM INVESTMENT FUNDS (INVESCO INVESTMENT FUNDS) - Invesco Oppenheimer Developing Markets Fund Class R6, Capital International Investors, Lazard Asset Management Llc, Fisher Asset Management, LLC, and FEMSX - Fidelity Series Emerging Markets Opportunities Fund .
Vale S.A. - Depositary Receipt (Common Stock) (NYSE:VALE) institutionel ejerskabsstruktur viser aktuelle positioner i virksomheden efter institutioner og fonde, samt seneste ændringer i positionsstørrelse. Større aktionærer kan omfatte individuelle investorer, investeringsforeninger, hedgefonde eller institutioner. Skema 13D angiver, at investoren besidder (eller besidder) mere end 5 % af virksomheden og har til hensigt (eller har til hensigt at) aktivt at forfølge en ændring i forretningsstrategi. Skema 13G indikerer en passiv investering på over 5%.
The share price as of March 24, 2026 is 14,87 / share. Previously, on March 25, 2025, the share price was 10,09 / share. This represents an increase of 47,37% over that period.

Fondens stemningsscore
Fund Sentiment Score (fka Ownership Accumulation Score) finder de aktier, der bliver mest købt af fonde. Det er resultatet af en sofistikeret, multi-faktor kvantitativ model, der identificerer virksomheder med de højeste niveauer af institutionel akkumulering. Scoringsmodellen bruger en kombination af den samlede stigning i oplyste ejere, ændringerne i porteføljeallokeringer i disse ejere og andre målinger. Tallet går fra 0 til 100, hvor højere tal indikerer et højere niveau af akkumulering for sine jævnaldrende, og 50 er gennemsnittet.
Opdateringsfrekvens: Dagligt
Se Ownership Explorer, som giver en liste over højest rangerende virksomheder.
AI+ Ask Fintel’s AI assistant about Vale S.A. - Depositary Receipt (Common Stock).
Select a question to share a public post with an AI-crafted answer.
Thinking of good questions…
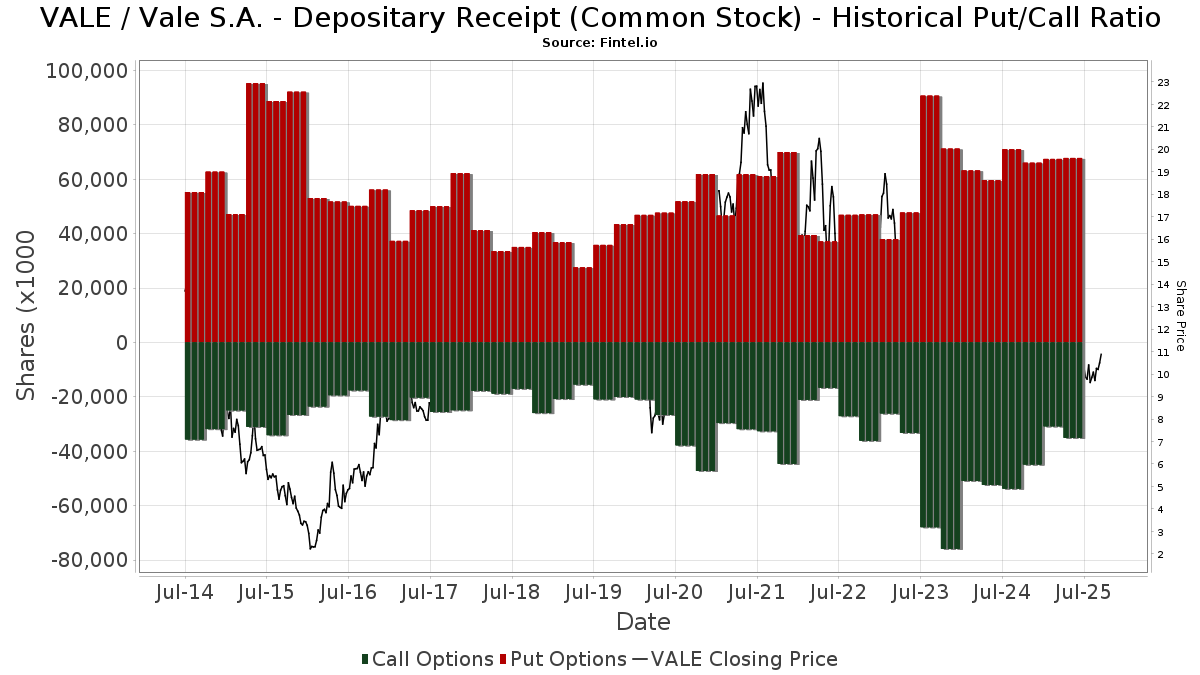
Institutionel Put/Call-forhold
Ud over at indberette standardaktie- og gældsudstedelser skal institutter med mere end 100 mill. aktiver under forvaltning også oplyse deres put- og call-optionsbeholdninger. Da salgsoptioner generelt indikerer negativ stemning, og købsoptioner indikerer positiv stemning, kan vi få en fornemmelse af den overordnede institutionelle stemning ved at plotte forholdet mellem put og kald. Diagrammet til højre viser det historiske put/call-forhold for dette instrument.
Brug af Put/Call Ratio som en indikator for investorernes stemning overvinder en af de vigtigste mangler ved at bruge totalt institutionelt ejerskab, som er, at en betydelig mængde af aktiver under forvaltning investeres passivt for at spore indekser. Passivt forvaltede fonde køber typisk ikke optioner, så indikatoren for put/call-forholdet følger mere nøje følelsen af aktivt forvaltede fonde.
13F og NPORT arkivering
Detaljer om 13F-arkivering er gratis. Detaljer om NP-ansøgninger kræver et premium-medlemskab. Grønne rækker angiver nye positioner. Røde rækker angiver lukkede positioner. Klik på linket ikon for at se den fulde transaktionshistorik.
Opgrader
for at låse premium-data op og eksportere til Excel ![]() .
.
Important Note
In an effort to reduce load times for our mobile users, we are testing some ways to deliver lighter pages.
In this first test, we will deliver only the most recent 750 transactions (out of 796 for this stock). If you are interested in loading *all* the transactions for this company, click the "load all" button below. This is just a test and if you don't like it, please let us know by submitting some gentle feedback via the link at the bottom of this page.
Load All| Fil dato | Kilde | Investor | Type | Gennemsnitlig pris (Øst) |
Aktier | Δ Aktier (%) |
Rapporteret Værdi ($1000) |
Δ Værdi (%) |
Port Alloc (%) |
|
|---|---|---|---|---|---|---|---|---|---|---|
| 2026-02-13 | 13F | Walleye Trading LLC | Put | 1.725.000 | 13,49 | 22.477 | 36,17 | |||
| 2026-02-13 | 13F | Walleye Trading LLC | Call | 1.440.200 | 10,38 | 18.766 | 32,43 | |||
| 2026-02-13 | 13F | Walleye Trading LLC | 245.728 | -6,75 | 3.202 | 11,88 | ||||
| 2026-01-15 | 13F | Founders Capital Management | 3.800 | 0,00 | 50 | 19,51 | ||||
| 2026-02-04 | 13F | D'Orazio & Associates, Inc. | 62.503 | 11,99 | 814 | 34,32 | ||||
| 2026-02-17 | 13F | Private Advisor Group, LLC | 39.125 | -0,48 | 510 | 19,48 | ||||
| 2026-02-17 | 13F | Pine Valley Investments Ltd Liability Co | Call | 8.178 | ||||||
| 2025-09-26 | NP | DILAX - Davis International Fund Class A | 266.390 | 0,00 | 2.539 | 2,34 | ||||
| 2026-01-30 | 13F | R Squared Ltd | 54.967 | 3,94 | 716 | 24,74 | ||||
| 2026-02-12 | 13F | Jane Street Group, Llc | Call | 442.700 | -77,12 | 5.768 | -72,55 | |||
| 2026-02-12 | 13F | Jane Street Group, Llc | Put | 1.165.700 | 21,21 | 15.189 | 45,43 | |||
| 2026-02-12 | 13F | Jane Street Group, Llc | 3.412.312 | 383,13 | 44.462 | 479,69 | ||||
| 2026-02-17 | 13F | Tower Research Capital LLC (TRC) | 293 | -89,41 | 4 | -90,00 | ||||
| 2026-01-26 | 13F | Mountain Hill Investment Partners Corp. | 3.500 | -68,18 | 46 | -62,18 | ||||
| 2026-02-02 | 13F | Ping Capital Management, Inc. | 35.100 | -73,57 | 457 | -68,31 | ||||
| 2026-01-14 | 13F | Generali Investments CEE, investicni spolecnost, a.s. | 24.600 | -41,57 | 321 | -29,98 | ||||
| 2026-02-12 | 13F | DRW Securities, LLC | 53.642 | -73,30 | 699 | -67,89 | ||||
| 2026-02-13 | 13F | MAI Capital Management | 24.698 | 5,16 | 322 | 25,88 | ||||
| 2026-02-17 | 13F | Amundi | 1.598.530 | 10,88 | 20.829 | 27,97 | ||||
| 2026-01-20 | 13F | Signaturefd, Llc | 32.614 | 1,93 | 425 | 22,19 | ||||
| 2026-02-09 | 13F | SLT Holdings LLC | 18.250 | 238 | ||||||
| 2026-02-13 | 13F | Van Eck Associates Corp | 3.400.270 | 13,50 | 44 | 37,50 | ||||
| 2025-11-12 | 13F | HAP Trading, LLC | Call | 44.600 | 8 | |||||
| 2026-02-17 | 13F | Engineers Gate Manager LP | 228.272 | 2.974 | ||||||
| 2026-02-11 | 13F | Vise Technologies, Inc. | 32.091 | 45,82 | 418 | 74,90 | ||||
| 2026-02-10 | 13F | Verus Capital Partners, Llc | 132.123 | 13,78 | 1.722 | 36,48 | ||||
| 2026-02-10 | 13F | Sivia Capital Partners, LLC | 12.733 | -0,26 | 166 | 19,57 | ||||
| 2025-11-14 | 13F | Ion Asset Management Ltd. | 81.800 | 888 | ||||||
| 2026-01-26 | 13F | Merit Financial Group, LLC | 23.832 | 12,77 | 311 | 35,37 | ||||
| 2026-02-03 | 13F | Maxi Investments CY Ltd | 0 | -100,00 | 0 | |||||
| 2026-02-04 | 13F | Community Bank, N.A. | 600 | 0,00 | 8 | 16,67 | ||||
| 2026-02-09 | 13F | Huntington National Bank | 8.121 | 72,31 | 106 | 105,88 | ||||
| 2026-02-02 | 13F | Chung Wu Investment Group, LLC | 3.500 | 0,00 | 46 | 18,42 | ||||
| 2026-02-17 | 13F | Orbis Allan Gray Ltd | 18.242.181 | 34,39 | 237.696 | 61,25 | ||||
| 2026-02-10 | 13F | Cravens & Co Advisors, LLC | 20.202 | -0,44 | 285 | 29,55 | ||||
| 2025-09-25 | NP | DFEM - Dimensional Emerging Markets Core Equity 2 ETF | 1.720.718 | 7,91 | 16.398 | 10,47 | ||||
| 2026-02-13 | 13F | Walleye Capital LLC | Call | 31.300 | 104,58 | 408 | 145,18 | |||
| 2026-02-13 | 13F | Walleye Capital LLC | Put | 129.400 | 16.075,00 | 1.686 | 20.975,00 | |||
| 2026-02-13 | 13F | Walleye Capital LLC | 211.023 | -87,38 | 2.750 | -84,87 | ||||
| 2026-02-13 | 13F | Sei Investments Co | 1.317.933 | 100,56 | 17.173 | 140,64 | ||||
| 2026-02-06 | 13F | Larson Financial Group LLC | 10.215 | 390,63 | 133 | 504,55 | ||||
| 2025-09-26 | NP | Global Macro Portfolio - Global Macro Portfolio | 371.000 | 17,39 | 3.536 | 20,16 | ||||
| 2026-02-17 | 13F | Janus Henderson Group Plc | 1.115.499 | -0,70 | 14.533 | 19,10 | ||||
| 2026-01-29 | 13F | Kestra Private Wealth Services, Llc | 15.760 | 0,03 | 205 | 19,88 | ||||
| 2026-02-11 | 13F | MidWestOne Financial Group, Inc. | 133.267 | -26,43 | 1.736 | -11,74 | ||||
| 2026-02-13 | 13F | Lord, Abbett & Co. Llc | 2.100.000 | 27 | ||||||
| 2026-02-02 | 13F | Principal Financial Group Inc | 379.340 | 6,79 | 4.943 | 28,13 | ||||
| 2026-02-17 | 13F | Oaktree Capital Management Lp | 2.023.706 | -0,49 | 26.369 | 19,39 | ||||
| 2026-01-27 | 13F | Ninety One UK Ltd | 7.715.768 | 1,09 | 100.536 | 21,28 | ||||
| 2026-02-17 | 13F | LMR Partners LLP | Call | 51.700 | -55,66 | 674 | -46,84 | |||
| 2026-02-13 | 13F | Rhumbline Advisers | 123.785 | -31,22 | 1.613 | -17,50 | ||||
| 2026-02-17 | 13F | LMR Partners LLP | Put | 91.900 | 0,00 | 1.197 | 19,94 | |||
| 2025-11-14 | 13F | Capstone Investment Advisors, Llc | 37.993 | 413 | ||||||
| 2026-02-17 | 13F | Citadel Advisors Llc | Call | 3.835.400 | -50,18 | 49.975 | -40,23 | |||
| 2026-02-17 | 13F | Citadel Advisors Llc | 5.921.812 | 54,30 | 77.161 | 85,13 | ||||
| 2026-02-17 | 13F | Citadel Advisors Llc | Put | 1.771.300 | -20,93 | 23.080 | -5,13 | |||
| 2026-01-23 | 13F | Octavia Wealth Advisors, LLC | 17.175 | 48,64 | 228 | 81,60 | ||||
| 2026-02-05 | 13F | Bessemer Group Inc | 24.929 | 0,00 | 0 | |||||
| 2026-02-10 | 13F/A | Northwestern Mutual Wealth Management Co | 93.642 | -3,79 | 1.220 | 15,53 | ||||
| 2026-02-12 | 13F | Scotia Capital Inc. | 199.954 | 0,29 | 2.605 | 20,32 | ||||
| 2026-02-17 | 13F | Two Sigma Advisers, Lp | 2.461.400 | 32.072 | ||||||
| 2025-11-14 | 13F | Northwest Bancshares, Inc. | 0 | -100,00 | 0 | |||||
| 2026-02-17 | 13F | Aster Capital Management (DIFC) Ltd | 0 | -100,00 | 0 | |||||
| 2026-01-29 | 13F | Aprio Wealth Management, LLC | 54.823 | 29,25 | 714 | 55,22 | ||||
| 2026-02-02 | 13F | Truist Financial Corp | 8.109.148 | 16.205,37 | 105.662 | 19.467,04 | ||||
| 2026-01-08 | 13F | True Wealth Design, LLC | 469 | 0,00 | 6 | 20,00 | ||||
| 2026-02-13 | 13F | Boston Partners | 65.338 | 851 | ||||||
| 2026-01-23 | 13F | U.S. Capital Wealth Advisors, LLC | 25.284 | -2,38 | 329 | 17,08 | ||||
| 2025-09-29 | NP | Calamos Global Total Return Fund | 5.250 | 0,00 | 50 | 4,17 | ||||
| 2026-01-21 | 13F | Stone House Investment Management, LLC | 100 | 0,00 | 1 | 0,00 | ||||
| 2026-01-27 | 13F | Wealth Enhancement Trust Services, Inc. | 3.000 | 39 | ||||||
| 2026-01-28 | 13F | CAPROCK Group, Inc. | 270.326 | 22,06 | 3.584 | 52,34 | ||||
| 2026-02-13 | 13F | Kestra Advisory Services, LLC | 0 | -100,00 | 0 | |||||
| 2026-02-11 | 13F | Group One Trading, L.p. | Put | 3.481.200 | -3,93 | 45.360 | 15,26 | |||
| 2026-02-11 | 13F | Group One Trading, L.p. | 98.717 | 1.286 | ||||||
| 2026-02-06 | 13F | Windmill Hill Asset Management Ltd | 61.344 | 0,00 | 799 | 19,97 | ||||
| 2026-02-17 | 13F | Grantham, Mayo, Van Otterloo & Co. LLC | 317.300 | 4.134 | ||||||
| 2026-01-16 | 13F | Perigon Wealth Management, LLC | 96.063 | 40,54 | 1.252 | 68,60 | ||||
| 2026-02-17 | 13F | Millennium Management Llc | Call | 310.300 | -9,90 | 4.043 | 8,10 | |||
| 2026-02-19 | 13F | Invesco Ltd. | 17.158.851 | -40,75 | 223.580 | -28,92 | ||||
| 2026-02-17 | 13F | Mercer Global Advisors Inc /adv | 87.097 | -8,87 | 1.135 | 9,35 | ||||
| 2026-01-05 | 13F | Union Bancaire Privee, UBP SA | 16.000 | 16,74 | 193 | 37,86 | ||||
| 2026-02-17 | 13F | Millennium Management Llc | 8.360.116 | 9,03 | 108.932 | 30,81 | ||||
| 2026-02-17 | 13F | Millennium Management Llc | Put | 283.900 | -1,83 | 3.699 | 17,80 | |||
| 2026-02-10 | 13F | Capital Innovations LLC | 0 | -100,00 | 0 | |||||
| 2026-01-21 | 13F | Flagship Harbor Advisors, Llc | 3.597 | -73,17 | 47 | -68,28 | ||||
| 2026-02-17 | 13F | EFG International AG | 4.000 | 52 | ||||||
| 2026-02-13 | 13F | Oceanic Investment Management LTD | 21.026 | 274 | ||||||
| 2026-02-02 | 13F | Qrg Capital Management, Inc. | 81.702 | 55,38 | 1.065 | 86,34 | ||||
| 2026-02-13 | 13F | Islay Capital Management, Llc | 1.000 | 0,00 | 13 | 30,00 | ||||
| 2026-02-17 | 13F | MIRAE ASSET GLOBAL ETFS HOLDINGS Ltd. | 43.705 | 17,34 | 569 | 40,84 | ||||
| 2025-09-25 | NP | Alpine Total Dynamic Dividend Fund | 0 | -100,00 | 0 | -100,00 | ||||
| 2026-01-30 | 13F | Pekin Hardy Strauss, Inc. | 78.689 | 5,65 | 1.025 | 26,86 | ||||
| 2026-01-29 | 13F | Matthews International Capital Management Llc | 132.432 | 1.726 | ||||||
| 2026-01-20 | 13F | Stratos Wealth Advisors, LLC | 0 | -100,00 | 0 | |||||
| 2026-02-09 | 13F | Cary Street Partner Investment Advisory Llc | 3.267 | 18,89 | 43 | 44,83 | ||||
| 2026-01-07 | 13F | Sagespring Wealth Partners, Llc | 15.693 | 18,62 | 204 | 42,66 | ||||
| 2026-02-17 | 13F | Public Employees Retirement System Of Ohio | 958.883 | -3,93 | 12.494 | 15,27 | ||||
| 2026-03-06 | 13F | Hsbc Holdings Plc | 2.216.984 | 6,39 | 28.890 | 27,71 | ||||
| 2026-02-02 | 13F | Legacy Edge Advisors, LLC | 13.500 | 176 | ||||||
| 2026-01-30 | 13F | ARGA Investment Management, LP | 182.364 | 0,00 | 2.376 | 20,00 | ||||
| 2026-02-09 | 13F | Hantz Financial Services, Inc. | 179.919 | 53,73 | 2 | 100,00 | ||||
| 2026-02-13 | 13F | Itau Unibanco Holding S.A. | 10.122.584 | 69,64 | 132.707 | 104,79 | ||||
| 2026-02-13 | 13F | Pinpoint Asset Management (Singapore) Pte. Ltd. | 18.087 | 236 | ||||||
| 2026-01-26 | 13F | Means Investment Co., Inc. | Call | 0 | -100,00 | 0 | ||||
| 2026-02-06 | 13F | Gsa Capital Partners Llp | 124.869 | 54,26 | 2 | |||||
| 2026-02-05 | 13F | Everstar Asset Management, LLC | 30.000 | 0,00 | 391 | 20,00 | ||||
| 2025-11-14 | 13F | Wetherby Asset Management Inc | 39.664 | -3,05 | 431 | 8,31 | ||||
| 2025-09-25 | NP | JEMA - JPMorgan Emerging Markets Equity Core ETF | 145.141 | -3,21 | 1.383 | -0,93 | ||||
| 2025-09-25 | NP | Thrivent Core Funds - Thrivent Core Emerging Markets Equity Fund | 370.949 | 4,33 | 3.535 | 6,80 | ||||
| 2026-02-11 | 13F | Capital World Investors | 89.322.261 | 58,21 | 1.163.896 | 89,84 | ||||
| 2026-02-17 | 13F | Balyasny Asset Management Llc | Call | 226.000 | -5,24 | 2.948 | 13,78 | |||
| 2025-09-26 | NP | FSSGX - Fidelity SAI Sustainable Emerging Markets Equity Fund | 0 | -100,00 | 0 | -100,00 | ||||
| 2026-02-17 | 13F | Tudor Investment Corp Et Al | Call | 0 | -100,00 | 0 | -100,00 | |||
| 2026-02-17 | 13F | Balyasny Asset Management Llc | Put | 493.400 | 12,65 | 6.431 | 35,22 | |||
| 2026-02-17 | 13F | Old West Investment Management, LLC | 92.080 | 1.200 | ||||||
| 2026-02-02 | 13F | Oppenheimer & Co Inc | 0 | -100,00 | 0 | |||||
| 2026-02-19 | 13F | CI Private Wealth, LLC | 12.842 | -82,13 | 167 | -78,59 | ||||
| 2026-01-28 | 13F | Kingswood Wealth Advisors, Llc | 10.593 | 138 | ||||||
| 2026-02-17 | 13F | Lighthouse Investment Partners, LLC | 370.459 | 21,15 | 4.827 | 45,39 | ||||
| 2025-11-04 | 13F | Winnow Wealth Llc | 0 | -100,00 | 0 | |||||
| 2026-01-20 | 13F | SOA Wealth Advisors, LLC. | 170 | 0,00 | 2 | 100,00 | ||||
| 2026-01-26 | 13F | Heritage Wealth Management, Inc. | 11.000 | 0,00 | 143 | 20,17 | ||||
| 2026-01-09 | 13F | Diversified Trust Co | 36.152 | -2,38 | 471 | 17,16 | ||||
| 2026-02-03 | 13F | Mitsubishi UFJ Kokusai Asset Management Co., Ltd. | 0 | -100,00 | 0 | -100,00 | ||||
| 2026-02-17 | 13F/A | Cantor Fitzgerald, L. P. | 0 | -100,00 | 0 | -100,00 | ||||
| 2026-02-19 | 13F | Atomi Financial Group, Inc. | 96.652 | 26,62 | 1.259 | 52,05 | ||||
| 2026-01-22 | 13F | Intergy Private Wealth, LLC | 13.851 | 20,13 | 180 | 44,00 | ||||
| 2026-02-10 | 13F | Goldman Sachs Group Inc | Call | 1.769.500 | -59,50 | 23.057 | -51,41 | |||
| 2026-02-10 | 13F | Goldman Sachs Group Inc | Put | 13.493.500 | 7,90 | 175.820 | 29,46 | |||
| 2026-01-20 | 13F | Perpetual Ltd | 141.560 | -2,35 | 1.845 | 17,15 | ||||
| 2026-02-10 | 13F | Goldman Sachs Group Inc | 13.587.443 | 8,35 | 177.044 | 29,99 | ||||
| 2026-01-26 | 13F | Private Trust Co Na | 40 | 0,00 | 1 | |||||
| 2026-01-05 | 13F | Commons Capital, Llc | 141.750 | 0,00 | 1.847 | 20,01 | ||||
| 2026-02-13 | 13F | Nfj Investment Group, Llc | 55 | 0,00 | 1 | |||||
| 2026-02-12 | 13F | Rossby Financial, LCC | 297 | 0,00 | 4 | 0,00 | ||||
| 2026-02-17 | 13F | Voloridge Investment Management, Llc | 2.959.832 | 9.173,53 | 38.567 | 11.046,24 | ||||
| 2026-02-03 | 13F | We Are One Seven, LLC | 39.080 | -14,13 | 509 | 3,04 | ||||
| 2026-02-09 | 13F | Morningstar Investment Management LLC | 0 | -100,00 | 0 | |||||
| 2026-02-12 | 13F | Barings Llc | 878.365 | 10,81 | 11.445 | 32,96 | ||||
| 2026-02-26 | 13F | Anchor Investment Management, LLC | 250 | 0,00 | 3 | 50,00 | ||||
| 2026-02-12 | 13F | Brinker Capital Investments, LLC | 58.297 | 22,42 | 760 | 46,81 | ||||
| 2026-02-09 | 13F | Strategic Financial Concepts, LLC | 13.700 | 179 | ||||||
| 2026-01-21 | 13F | Greenleaf Trust | 28.207 | 0,00 | 368 | 19,93 | ||||
| 2026-02-11 | 13F | USCF Advisers LLC | 100 | 0,00 | 1 | 0,00 | ||||
| 2026-02-14 | 13F | Frec Markets, Inc. | 14.447 | 188 | ||||||
| 2026-02-10 | 13F | Baker Avenue Asset Management, LP | 10.200 | 0,00 | 133 | 20,00 | ||||
| 2026-01-07 | 13F | Hilltop National Bank | 370 | -35,09 | 5 | -33,33 | ||||
| 2026-02-12 | 13F | Keynote Financial Services Llc | 36.594 | -3,43 | 477 | 15,82 | ||||
| 2026-02-13 | 13F | Marnell Management LLC | 25.800 | 336 | ||||||
| 2026-02-17 | 13F | Aqr Capital Management Llc | 9.530.954 | 826,73 | 124.188 | 1.012,00 | ||||
| 2026-02-11 | 13F | Jpmorgan Chase & Co | 4.545.946 | 2,15 | 59.234 | 22,55 | ||||
| 2026-02-11 | 13F | Jpmorgan Chase & Co | Put | 8.850.000 | 36,15 | 115.316 | 63,36 | |||
| 2026-02-17 | 13F | XTX Topco Ltd | 467.887 | 521,93 | 6.097 | 646,14 | ||||
| 2025-11-12 | 13F | Creekmur Asset Management LLC | 12 | 0,00 | 0 | |||||
| 2026-02-17 | 13F | Roehl & Yi Investment Advisors, LLC | 12.447 | 162 | ||||||
| 2026-02-03 | 13F | Kassira Wealth Management LLC | 40.458 | -3,65 | 527 | 15,57 | ||||
| 2026-02-02 | 13F | Nkcfo Llc | 237.750 | 3 | ||||||
| 2026-02-17 | 13F | Rwc Asset Advisors (us) Llc | 6.523.762 | 8,98 | 85.005 | 30,75 | ||||
| 2025-11-12 | 13F | Ameliora Wealth Management Ltd. | 0 | -100,00 | 0 | |||||
| 2026-02-13 | 13F | Mml Investors Services, Llc | 260.439 | 4,05 | 3.394 | 24,83 | ||||
| 2025-09-26 | NP | PCEMX - PACE International Emerging Markets Equity Investments Class P | 115.775 | -30,64 | 1.103 | -51,73 | ||||
| 2026-02-12 | 13F | Campbell & CO Investment Adviser LLC | 0 | -100,00 | 0 | |||||
| 2026-02-17 | 13F | Ninepoint Partners LP | 228 | 3 | ||||||
| 2026-02-04 | 13F | BCJ Capital Management, LLC | 484.111 | 6.308 | ||||||
| 2026-02-09 | 13F | MTM Investment Management, LLC | 12 | 0,00 | 0 | |||||
| 2026-02-13 | 13F | Focused Alpha, Llc | 18.917 | 246 | ||||||
| 2026-02-13 | 13F | Vontobel Holding Ltd. | 144.207 | 218,26 | 1.879 | 281,91 | ||||
| 2026-01-15 | 13F | Nisa Investment Advisors, Llc | 1.270 | 5,83 | 17 | 30,77 | ||||
| 2026-02-17 | 13F | Ancora Advisors, LLC | 480 | 6 | ||||||
| 2026-02-13 | 13F | Arrowstreet Capital, Limited Partnership | 41.596.000 | 2.239,57 | 541.996 | 2.707,10 | ||||
| 2026-02-10 | 13F | Daiwa Securities Group Inc. | 136.194 | -11,67 | 2 | 0,00 | ||||
| 2026-02-13 | 13F | NLB Skladi, upravljanje premozenja, d.o.o. | 494.796 | 6.447 | ||||||
| 2026-01-08 | 13F | Tuttle Tactical Management LLC | 30.627 | 399 | ||||||
| 2026-02-13 | 13F | Pine Valley Investments Ltd Liability Co | 0 | -100,00 | 0 | |||||
| 2026-02-13 | 13F | First Trust Advisors Lp | 231.454 | 30,01 | 3.016 | 55,98 | ||||
| 2026-01-20 | 13F | Ascent Group, LLC | 63.229 | 4,16 | 824 | 24,89 | ||||
| 2026-02-12 | 13F | Commonwealth Equity Services, Llc | 184.462 | 8,38 | 2.404 | 240.200,00 | ||||
| 2026-02-23 | 13F | Wealth Preservation Advisors, LLC | 150 | 2 | ||||||
| 2026-02-17 | 13F | ION Fund Management Ltd | Call | 2.307.100 | 30.062 | |||||
| 2026-02-17 | 13F | Susquehanna International Group, Llp | Put | 14.617.300 | 19,55 | 190.463 | 43,44 | |||
| 2026-02-17 | 13F | Susquehanna International Group, Llp | Call | 7.156.200 | 0,09 | 93.245 | 20,09 | |||
| 2026-02-17 | 13F | Susquehanna International Group, Llp | 4.015.527 | -36,25 | 52.322 | -23,52 | ||||
| 2026-01-28 | 13F | Old National Bancorp /in/ | 17.254 | 23,37 | 225 | 48,34 | ||||
| 2026-02-11 | 13F | Capital International Investors | 27.642.423 | -40,19 | 360.298 | -28,19 | ||||
| 2026-03-04 | 13F | Rehmann Capital Advisory Group | 16.509 | 49,65 | 215 | 80,67 | ||||
| 2025-11-14 | 13F | Compass Rose Asset Management, LP | 0 | -100,00 | 0 | -100,00 | ||||
| 2026-02-12 | 13F | Intesa Sanpaolo Wealth Management | 24.000 | 313 | ||||||
| 2026-02-13 | 13F | Natixis | 207.198 | 273,31 | 2.700 | 348,34 | ||||
| 2026-02-17 | 13F | Turim 21 Investimentos Ltda. | 3.131.646 | 0,00 | 40.805 | 19,98 | ||||
| 2025-09-26 | NP | MSTFX - Morningstar International Equity Fund | 101.925 | 13,65 | 971 | 16,43 | ||||
| 2025-09-25 | NP | DFEV - Dimensional Emerging Markets Value ETF | 855.296 | 0,00 | 8.151 | 2,36 | ||||
| 2026-02-13 | 13F | SRS Capital Advisors, Inc. | 4.372 | 1.167,25 | 57 | 1.766,67 | ||||
| 2026-01-23 | 13F | Assetmark, Inc | 289.337 | 10,95 | 3.770 | 33,12 | ||||
| 2025-11-05 | 13F | Flynn Zito Capital Management, Llc | 0 | -100,00 | 0 | |||||
| 2026-02-18 | 13F | Vident Advisory, LLC | 164.189 | 0,11 | 2.139 | 20,10 | ||||
| 2025-09-25 | NP | EMGAX - Wells Fargo Emerging Markets Equity Fund Class A | 1.590.978 | 0,00 | 15.162 | 2,36 | ||||
| 2026-01-30 | 13F | Mizuho Securities Co. Ltd. | 0 | -100,00 | 0 | |||||
| 2026-02-13 | 13F | Causeway Capital Management Llc | 904.000 | 11.779 | ||||||
| 2026-01-26 | 13F | Moran Wealth Management, LLC | 79.095 | 26,92 | 1.031 | 52,37 | ||||
| 2026-01-14 | 13F | LVW Advisors, LLC | 27.938 | 364 | ||||||
| 2025-11-14 | 13F | Dynamo Administracao de Recursos Ltda. | 4.633 | -41,08 | 50 | -34,21 | ||||
| 2026-02-17 | 13F | one8zero8, LLC | 43.500 | 8,75 | 567 | 30,41 | ||||
| 2025-11-14 | 13F | Atom Investors LP | 0 | -100,00 | 0 | |||||
| 2026-02-03 | 13F | Gateway Investment Advisers Llc | 20.927 | 2,73 | 273 | 23,08 | ||||
| 2026-02-17 | 13F | Tudor Investment Corp Et Al | 196.150 | 2.556 | ||||||
| 2026-02-17 | 13F | Tudor Investment Corp Et Al | Put | 110.400 | 1.439 | |||||
| 2026-02-13 | 13F | Arkadios Wealth Advisors | 76.316 | -6,15 | 994 | 12,57 | ||||
| 2025-09-25 | NP | SEMVX - Hartford Schroders Emerging Markets Equity Fund Class A | 0 | -100,00 | 0 | -100,00 | ||||
| 2025-10-07 | 13F | Sonora Investment Management Group, LLC | 12.850 | 140 | ||||||
| 2026-02-12 | 13F | CIBC Private Wealth Group, LLC | 2.001 | -13,00 | 26 | 8,33 | ||||
| 2026-02-04 | 13F | Oxbow Advisors, LLC | 546.782 | 10,02 | 7.125 | 32,00 | ||||
| 2026-01-23 | 13F | Freestone Capital Holdings, LLC | 16.496 | 0,34 | 215 | 20,22 | ||||
| 2026-01-26 | 13F | Cwm, Llc | 3.190 | -0,22 | 0 | |||||
| 2025-11-14 | 13F | Two Sigma Securities, Llc | 0 | -100,00 | 0 | |||||
| 2026-02-04 | 13F | Ameritas Advisory Services, LLC | 0 | -100,00 | 0 | |||||
| 2026-01-20 | 13F | Thurston, Springer, Miller, Herd & Titak, Inc. | 98 | 1 | ||||||
| 2026-02-09 | 13F | Frazier Financial Advisors, LLC | 499 | 237,16 | 7 | 500,00 | ||||
| 2026-02-09 | 13F | Arista Wealth Management, LLC | 0 | -100,00 | 0 | |||||
| 2026-02-11 | 13F | Vermillion Wealth Management, Inc. | 2 | 0 | ||||||
| 2026-02-13 | 13F | Banco Santander, S.A. | 263.854 | -53,73 | 3.438 | -44,48 | ||||
| 2026-02-13 | 13F | Macquarie Group Ltd | 0 | -100,00 | 0 | |||||
| 2026-02-12 | 13F | Marex Group plc | 166.735 | 9,55 | 2.173 | 31,48 | ||||
| 2026-03-12 | 13F/A | Peak6 Llc | Put | 774.800 | 167,17 | 10.096 | 220,58 | |||
| 2026-03-12 | 13F/A | Peak6 Llc | Call | 607.900 | 143,16 | 7.921 | 191,71 | |||
| 2026-02-11 | 13F | Metis Global Partners, LLC | 296.177 | -8,21 | 3.859 | 10,13 | ||||
| 2026-02-17 | 13F | Warren Averett Asset Management, LLC | 14.477 | 12,43 | 189 | 35,25 | ||||
| 2026-03-12 | 13F/A | Peak6 Llc | 105.098 | 1.369 | ||||||
| 2025-11-03 | 13F | Stonehage Fleming Financial Services Holdings Ltd | 0 | -100,00 | 0 | |||||
| 2026-02-17 | 13F | Schonfeld Strategic Advisors LLC | 0 | -100,00 | 0 | |||||
| 2026-02-13 | 13F | Level Four Advisory Services, Llc | 164.710 | -2,75 | 2.146 | 16,69 | ||||
| 2026-02-12 | 13F | Bank Of Montreal /can/ | 1.721.116 | 229,21 | 22.547 | 297,15 | ||||
| 2025-09-26 | NP | EPDPX - EuroPac International Dividend Income Fund Class A | 40.000 | 0,00 | 381 | 2,42 | ||||
| 2026-02-13 | 13F | Squarepoint Ops LLC | Call | 801.900 | -78,29 | 10.449 | -73,95 | |||
| 2026-01-29 | 13F | UBS Group AG | Put | 6.143.378 | 42,05 | 80.048 | 70,43 | |||
| 2026-02-13 | 13F | Squarepoint Ops LLC | Put | 4.744.100 | 30,54 | 61.816 | 56,63 | |||
| 2026-01-29 | 13F | UBS Group AG | Call | 8.602.409 | -14,49 | 112.089 | 2,60 | |||
| 2026-02-13 | 13F | Squarepoint Ops LLC | 449.599 | 2.191,53 | 5.858 | 2.650,23 | ||||
| 2026-01-29 | 13F | UBS Group AG | 4.630.332 | -50,64 | 60.333 | -40,77 | ||||
| 2026-02-17 | 13F | Hood River Capital Management LLC | 1.300 | 17 | ||||||
| 2026-02-17 | 13F | D. E. Shaw & Co., Inc. | Put | 429.300 | -35,15 | 5.594 | -22,20 | |||
| 2026-02-17 | 13F | D. E. Shaw & Co., Inc. | Call | 985.000 | -68,04 | 12.835 | -61,65 | |||
| 2025-11-13 | 13F | Beaird Harris Wealth Management, LLC | 0 | -100,00 | 0 | |||||
| 2026-02-02 | 13F | Benjamin Edwards Inc | 11.051 | 5,35 | 144 | 26,55 | ||||
| 2026-01-29 | 13F | Rakuten Securities, Inc. | 8.283 | -29,74 | 108 | -16,41 | ||||
| 2025-09-25 | NP | TWAAX - Thrivent International Allocation Fund Class A | 48.742 | 6,05 | 465 | 8,67 | ||||
| 2026-02-13 | 13F | Ieq Capital, Llc | 59.380 | 35,97 | 774 | 63,08 | ||||
| 2026-02-17 | 13F | Balyasny Asset Management Llc | 0 | -100,00 | 0 | |||||
| 2026-02-18 | 13F | Caitlin John, LLC | 4.310 | 85,38 | 56 | 124,00 | ||||
| 2026-02-17 | 13F | Northern Trust Corp | 4.864.383 | 5,94 | 63.383 | 27,10 | ||||
| 2026-02-12 | 13F | Nuveen, LLC | 3.280.249 | -6,81 | 42.742 | 11,82 | ||||
| 2026-02-17 | 13F | DV Trading LLC | 262 | 3 | ||||||
| 2025-09-29 | NP | CVY - Invesco Zacks Multi-Asset Income ETF This fund is a listed as child fund of Invesco Ltd. and if that institution has disclosed ownership in this security, then these positions will not be double counted when calculating total shares and total value | 104.798 | 13,95 | 999 | 0,10 | ||||
| 2026-01-21 | 13F | Prime Capital Investment Advisors, LLC | 0 | -100,00 | 0 | |||||
| 2025-09-25 | NP | NEWFX - NEW WORLD FUND INC Class A | 13.432.672 | 9,51 | 128.013 | 12,10 | ||||
| 2026-03-16 | 13F | Bank of New Hampshire | 1.155 | 0,00 | 15 | 25,00 | ||||
| 2026-02-11 | 13F | West Family Investments, Inc. | 10.014 | 0,00 | 130 | 20,37 | ||||
| 2025-10-17 | 13F | Westend Capital Management LLC | 0 | -100,00 | 0 | -100,00 | ||||
| 2025-11-14 | 13F | Capula Management Ltd | Call | 0 | -100,00 | 0 | ||||
| 2026-02-17 | 13F | SageView Advisory Group, LLC | 100 | 1 | ||||||
| 2026-02-17 | 13F | Delaware Management Holdings, Inc. | 1.570.579 | 20.465 | ||||||
| 2026-02-17 | 13F | TCG Advisory Services, LLC | 51.779 | 675 | ||||||
| 2026-02-20 | 13F | White Knight Strategic Wealth Advisors, LLC | 0 | -100,00 | 0 | |||||
| 2026-01-27 | 13F | Journey Advisory Group, LLC | 407.902 | 0,30 | 5.315 | 20,34 | ||||
| 2026-01-26 | 13F | Abbington Investment Group | 176.989 | 19,83 | 2.306 | 43,77 | ||||
| 2026-02-10 | 13F | Acadian Asset Management Llc | 5.095.487 | 9.375,22 | 66 | |||||
| 2026-02-12 | 13F | Dimensional Fund Advisors Lp | 7.183.913 | -11,49 | 93.616 | 6,22 | ||||
| 2026-02-17 | 13F | SummitTX Capital, L.P. | 685.874 | -26,18 | 8.937 | -11,44 | ||||
| 2026-02-09 | 13F | Hartland & Co., LLC | 700 | 9 | ||||||
| 2026-02-05 | 13F | Cornerstone Wealth Management, LLC | 16.849 | 0,00 | 220 | 20,33 | ||||
| 2026-02-10 | 13F | IFG Advisory, LLC | 34.221 | 446 | ||||||
| 2026-01-27 | 13F | WealthCollab, LLC | 364 | 0,00 | 5 | 33,33 | ||||
| 2026-01-16 | 13F | Ronald Blue Trust, Inc. | 15.182 | -5,89 | 198 | 12,57 | ||||
| 2026-02-13 | 13F | American Century Companies Inc | 5.901.094 | 13,84 | 76.891 | 36,59 | ||||
| 2026-02-17 | 13F | Liontrust Investment Partners LLP | 160.000 | 220,00 | 2.085 | 283,79 | ||||
| 2026-02-17 | 13F | Quantinno Capital Management LP | 230.757 | 73,74 | 3.007 | 108,46 | ||||
| 2026-02-11 | 13F | Capital International Ltd /ca/ | 280.267 | -4,85 | 3.652 | 14,17 | ||||
| 2025-11-14 | 13F | Cubist Systematic Strategies, LLC | Call | 522.700 | -1,91 | 5.677 | 9,70 | |||
| 2025-11-14 | 13F | Cubist Systematic Strategies, LLC | Put | 438.900 | 10,03 | 4.766 | 23,06 | |||
| 2026-02-17 | 13F | Advisory Services Network, LLC | 39.636 | 17,41 | 516 | 40,98 | ||||
| 2025-11-12 | 13F | Laffer Investments | 0 | -100,00 | 0 | -100,00 | ||||
| 2026-02-04 | 13F | HighPoint Advisor Group LLC | 25.980 | -10,76 | 339 | 6,96 | ||||
| 2025-11-14 | 13F | Dauntless Investment Group, LLC | 0 | -100,00 | 0 | -100,00 | ||||
| 2026-02-09 | 13F | Fisher Asset Management, LLC | 21.597.376 | -0,67 | 281.414 | 19,18 | ||||
| 2026-01-21 | 13F | Crews Bank & Trust | 0 | -100,00 | 0 | |||||
| 2025-09-25 | NP | DFAE - Dimensional Emerging Core Equity Market ETF | 1.651.800 | 5,43 | 15.742 | 7,92 | ||||
| 2026-01-30 | 13F | Us Bancorp \de\ | 46.940 | -68,48 | 612 | -62,21 | ||||
| 2026-02-12 | 13F | Summit Financial, LLC | 88.721 | -2,65 | 1.249 | 26,19 | ||||
| 2026-02-17 | 13F | Alliancebernstein L.p. | 159.317 | 101,26 | 2.076 | 141,56 | ||||
| 2026-02-03 | 13F | NewEdge Wealth, LLC | 25.091 | 18,66 | 327 | 25,38 | ||||
| 2026-02-09 | 13F | Legal & General Group Plc | 1.694 | 0,00 | 22 | 22,22 | ||||
| 2026-02-17 | 13F | Snowden Capital Advisors LLC | 29.711 | 51,58 | 392 | 84,43 | ||||
| 2026-02-03 | 13F | Strengthening Families & Communities, LLC | 0 | -100,00 | 0 | |||||
| 2026-02-12 | 13F | Quadrant Capital Group Llc | 66.870 | 1,29 | 871 | 21,65 | ||||
| 2025-09-26 | NP | RAZAX - Multi-Asset Growth Strategy Fund Class A | 0 | -100,00 | 0 | -100,00 | ||||
| 2026-02-12 | 13F/A | Pinebridge Investments Llc | 356.252 | 4.642 | ||||||
| 2025-11-14 | 13F | PineBridge Investments, L.P. | 238.098 | -8,17 | 2.586 | 2,70 | ||||
| 2026-02-17 | 13F | Driehaus Capital Management Llc | 5.780.150 | -29,39 | 75.315 | -15,29 | ||||
| 2026-02-11 | 13F | Capital Group Investment Management Pte. Ltd. | 68.030 | -9,49 | 886 | 8,58 | ||||
| 2026-01-23 | 13F | Robeco Institutional Asset Management B.V. | 20.809.302 | 77,77 | 271.145 | 113,30 | ||||
| 2026-02-17 | 13F | Hartree Partners, LP | 30.000 | 391 | ||||||
| 2025-10-29 | 13F | J.Safra Asset Management Corp | 0 | -100,00 | 0 | -100,00 | ||||
| 2026-02-13 | 13F | Virtus ETF Advisers LLC | 28.456 | 371 | ||||||
| 2026-01-29 | 13F | Nbc Securities, Inc. | 0 | -100,00 | 0 | |||||
| 2025-11-14 | 13F | Sompo Japan Nipponkoa Asset Management Co.,ltd. | 0 | -100,00 | 0 | |||||
| 2025-09-26 | NP | John Hancock Tax-advantaged Dividend Income Fund | 600.000 | 0,00 | 5.718 | 2,36 | ||||
| 2026-02-17 | 13F | Mirabella Financial Services Llp | 181.158 | 2.360 | ||||||
| 2025-10-07 | 13F | Proathlete Wealth Management Llc | 0 | -100,00 | 0 | |||||
| 2026-01-27 | 13F | TD Waterhouse Canada Inc. | 57.020 | 2.326,38 | 742 | 2.868,00 | ||||
| 2026-02-17 | 13F | Qube Research & Technologies Ltd | Put | 18.400 | 0,00 | 240 | 20,10 | |||
| 2026-02-17 | 13F | Old Mission Capital Llc | 30.703 | 400 | ||||||
| 2026-02-13 | 13F | Eschler Asset Management LLP | 35.000 | 456 | ||||||
| 2026-02-13 | 13F | GQG Partners LLC | 65.132.572 | 42,41 | 848.677 | 70,87 | ||||
| 2026-02-17 | 13F | Qube Research & Technologies Ltd | Call | 116.000 | -27,55 | 1.511 | -13,06 | |||
| 2026-02-17 | 13F | Fmr Llc | 54.962.420 | -0,47 | 716.160 | 19,42 | ||||
| 2025-09-25 | NP | ADAVX - Aberdeen Dynamic Dividend Fund Class A | 0 | -100,00 | 0 | -100,00 | ||||
| 2026-02-12 | 13F | Insigneo Advisory Services, Llc | 112.326 | -12,91 | 1.464 | 4,50 | ||||
| 2026-02-11 | 13F | Fox Run Management, L.l.c. | 53.664 | -32,45 | 699 | -18,91 | ||||
| 2026-02-03 | 13F | Sequoia Financial Advisors, LLC | 41.921 | 46,17 | 546 | 75,56 | ||||
| 2026-01-27 | 13F | Zurcher Kantonalbank (Zurich Cantonalbank) | 114.855 | 339,69 | 1.497 | 428,62 | ||||
| 2026-02-24 | 13F | Bell Investment Advisors, Inc | 422 | 0,00 | 5 | 25,00 | ||||
| 2025-09-26 | NP | UUPIX - Ultraemerging Markets Profund Investor Class | 17.503 | 18,71 | 167 | 21,17 | ||||
| 2026-01-27 | 13F | Belpointe Asset Management LLC | 69.513 | 906 | ||||||
| 2026-01-23 | 13F | Ritholtz Wealth Management | 407.634 | 10,61 | 5.311 | 32,71 | ||||
| 2026-02-11 | 13F | CenterBook Partners LP | 108.732 | 30,34 | 1.417 | 56,46 | ||||
| 2026-02-11 | 13F | RWC Asset Management LLP | 2.500.707 | 28,15 | 32.584 | 53,76 | ||||
| 2025-11-06 | 13F | Midwest Trust Co | 0 | -100,00 | 0 | |||||
| 2026-02-03 | 13F | International Assets Investment Management, Llc | 12.888 | -17,48 | 168 | 9,15 | ||||
| 2026-01-21 | 13F | Yousif Capital Management, Llc | 40.389 | 0,00 | 603 | 37,67 | ||||
| 2026-02-17 | 13F | SIH Partners, LLLP | 0 | -100,00 | 0 | |||||
| 2026-01-21 | 13F | Naviter Wealth, LLC | 47.670 | -7,52 | 632 | 12,88 | ||||
| 2026-02-06 | 13F | Leonteq Securities AG | 463.376 | 11,09 | 6.038 | 33,30 | ||||
| 2026-02-17 | 13F | Raymond James Financial Inc | 1.994.495 | 22,25 | 25.988 | 46,68 | ||||
| 2025-09-26 | NP | FHKFX - Fidelity Series Emerging Markets Fund This fund is a listed as child fund of Fmr Llc and if that institution has disclosed ownership in this security, then these positions will not be double counted when calculating total shares and total value | 2.891.207 | -54,59 | 27.553 | -53,52 | ||||
| 2026-02-11 | 13F | J.w. Cole Advisors, Inc. | 10.969 | 1,12 | 106 | -10,26 | ||||
| 2026-01-21 | 13F | Kawa Capital Management, Inc | 520.000 | -49,02 | 7.051 | -36,35 | ||||
| 2025-11-12 | 13F | Contrarius Group Holdings Ltd | 0 | -100,00 | 0 | |||||
| 2026-01-27 | 13F | Bayforest Capital Ltd | 114 | 1 | ||||||
| 2026-02-17 | 13F | Wiley Bros.-aintree Capital, Llc | 23.206 | 13,14 | 302 | 36,04 | ||||
| 2026-01-09 | 13F | Assenagon Asset Management S.A. | 102.362 | -94,64 | 1.334 | -93,58 | ||||
| 2026-02-13 | 13F | SPX Equities Gestao de Recursos Ltda | 395.018 | -96,43 | 5.147 | -95,72 | ||||
| 2026-02-17 | 13F | Nomura Holdings Inc | Call | 3.274.800 | 0,00 | 42.671 | 19,98 | |||
| 2026-02-17 | 13F | Nomura Holdings Inc | Put | 120.000 | 0,00 | 1.564 | 19,95 | |||
| 2026-02-13 | 13F | Financial Sense Advisors, Inc. | Call | 0 | -100,00 | 0 | -100,00 | |||
| 2025-09-25 | NP | PGNAX - PGIM Jennison Natural Resources Fund Class A | 872.825 | 20,16 | 8.318 | 23,01 | ||||
| 2025-11-04 | 13F | Syntax Research, Inc. | 0 | -100,00 | 0 | -100,00 | ||||
| 2026-02-12 | 13F | BRYN MAWR TRUST Co | 10.500 | 0,00 | 137 | 19,30 | ||||
| 2026-02-13 | 13F | Golden State Wealth Management, LLC | 0 | -100,00 | 0 | -100,00 | ||||
| 2025-11-04 | 13F | High Note Wealth, LLC | 0 | -100,00 | 0 | |||||
| 2026-02-17 | 13F | PharVision Advisers, LLC | 26.023 | 112,24 | 339 | 154,89 | ||||
| 2026-02-23 | 13F | Walser Wealth Management Company, A Ltd Liability Co | 21.456 | 280 | ||||||
| 2026-02-17 | 13F | Clear Street Markets Llc | 394.700 | 1.677,93 | 5.143 | 2.033,61 | ||||
| 2026-02-11 | 13F | Investors Towarzystwo Funduszy Inwestycyjnych Spolka Akcyjna | 2.055 | 27 | ||||||
| 2026-02-17 | 13F | Clear Street Markets Llc | Put | 309.000 | 4.026 | |||||
| 2026-02-12 | 13F | Advocate Investing Services LLC | 31.665 | 413 | ||||||
| 2025-11-14 | 13F | Wolverine Trading, Llc | 15.784 | 170 | ||||||
| 2025-11-14 | 13F | Wolverine Trading, Llc | Call | 157.800 | 1.696 | |||||
| 2025-11-14 | 13F | Wolverine Trading, Llc | Put | 568.100 | 6.107 | |||||
| 2025-09-26 | NP | UBPIX - Ultralatin America Profund Investor Class | 71.711 | 0,30 | 683 | 2,71 | ||||
| 2026-02-10 | 13F | Nomura Asset Management Co Ltd | 108.359 | 11,23 | 1.412 | 33,36 | ||||
| 2026-03-11 | 13F | Larry Mathis Financial Planning, LLC | 20.030 | 261 | ||||||
| 2025-09-25 | NP | CAIBX - CAPITAL INCOME BUILDER Class A | 6.898.935 | 0,00 | 65.747 | 2,36 | ||||
| 2026-01-30 | 13F | Jennison Associates Llc | 1.603.391 | 54,95 | 20.892 | 85,92 | ||||
| 2026-02-17 | 13F | Graham Capital Management, L.P. | 17.513 | -53,99 | 228 | -44,79 | ||||
| 2026-02-06 | 13F | HighTower Advisors, LLC | 388.889 | 8,96 | 5.067 | 30,76 | ||||
| 2026-03-03 | 13F/A | Caitong International Asset Management Co., Ltd | 0 | -100,00 | 0 | |||||
| 2026-01-12 | 13F | Foster Group, Inc. | 10.382 | 135 | ||||||
| 2026-02-06 | 13F | EverSource Wealth Advisors, LLC | 9.167 | -4,58 | 119 | 14,42 | ||||
| 2026-02-06 | 13F | IFP Advisors, Inc | 1.251 | -74,73 | 16 | -69,81 | ||||
| 2026-02-17 | 13F | LaSalle St. Investment Advisors, LLC | 78.620 | 41,58 | 1 | |||||
| 2026-02-17 | 13F | Shay Capital LLC | Call | 0 | -100,00 | 0 | -100,00 | |||
| 2026-02-12 | 13F | Steward Partners Investment Advisory, Llc | 21.997 | 18,28 | 287 | 42,29 | ||||
| 2025-11-14 | 13F | Strategic Wealth Partners, Ltd. | 314 | -98,00 | 3 | -98,03 | ||||
| 2025-11-13 | 13F | Eisler Capital Management Ltd. | Put | 800.000 | 0,00 | 8.616 | 11,03 | |||
| 2025-11-13 | 13F | Eisler Capital Management Ltd. | Call | 600.000 | 0,00 | 6.462 | 11,03 | |||
| 2026-02-13 | 13F | State Street Corp | 10.598.523 | -2,43 | 140.690 | 19,26 | ||||
| 2026-02-13 | 13F | Financial Sense Advisors, Inc. | 397.116 | 205,59 | 5.174 | 266,69 | ||||
| 2025-10-31 | 13F | Whittier Trust Co Of Nevada Inc | 0 | -100,00 | 0 | -100,00 | ||||
| 2025-11-14 | 13F | American Trust Investment Advisors, LLC | 0 | -100,00 | 0 | |||||
| 2025-09-26 | NP | John Hancock Premium Dividend Fund | 480.000 | 0,00 | 4.574 | 2,37 | ||||
| 2026-02-17 | 13F | Optiver Holding B.V. | Put | 10.374.400 | -5,83 | 135.178 | 12,99 | |||
| 2026-02-17 | 13F | Dynamo Internacional Gestao De Recursos Ltda. | 0 | -100,00 | 0 | |||||
| 2026-02-17 | 13F | Optiver Holding B.V. | 2.387.454 | 31.109 | ||||||
| 2026-02-11 | 13F | Capital International Inc /ca/ | 180.335 | -69,69 | 2.350 | -63,64 | ||||
| 2026-02-03 | 13F | Crossmark Global Holdings, Inc. | 127.601 | 0,23 | 1.663 | 20,26 | ||||
| 2026-01-21 | 13F | First United Bank Trust/ | 0 | -100,00 | 0 | |||||
| 2026-01-27 | 13F | Fortis Capital Advisors, LLC | 69.513 | 906 | ||||||
| 2026-02-13 | 13F | Clear Street Group Inc. | 31.581 | 412 | ||||||
| 2026-02-17 | 13F | Rexford Capital Inc | 12.612 | 0,00 | 164 | 20,59 | ||||
| 2026-02-02 | 13F | Strs Ohio | 9.967 | -14,87 | 130 | 1,57 | ||||
| 2026-02-13 | 13F | Gen-Wealth Partners Inc | 300 | -80,00 | 4 | -81,25 | ||||
| 2025-09-26 | NP | FDCAX - Fidelity Capital Appreciation Fund This fund is a listed as child fund of Fmr Llc and if that institution has disclosed ownership in this security, then these positions will not be double counted when calculating total shares and total value | 0 | -100,00 | 0 | -100,00 | ||||
| 2026-02-17 | 13F | Nomura Holdings Inc | 0 | -100,00 | 0 | |||||
| 2026-02-11 | 13F | X-Square Capital, LLC | 158.535 | -1,26 | 2 | 100,00 | ||||
| 2026-02-13 | 13F | Wells Fargo & Company/mn | 2.362.919 | 31,02 | 30.789 | 57,20 | ||||
| 2026-02-17 | 13F | Trexquant Investment LP | 2.306.104 | 638,96 | 30.049 | 786,63 | ||||
| 2026-02-13 | 13F | Motiv8 Investments LLC | 139 | 0 | ||||||
| 2026-02-12 | 13F | BlackRock, Inc. | 70.171.344 | 10,05 | 914.333 | 32,04 | ||||
| 2025-09-26 | NP | RMYAX - Multi-Strategy Income Fund Class A | 7.561 | 2,70 | 72 | 5,88 | ||||
| 2026-02-17 | 13F | Himension Fund | 918.117 | 463,51 | 11.963 | 576,26 | ||||
| 2026-02-13 | 13F | Gould Asset Management Llc /ca/ | 22.410 | 0,00 | 292 | 20,16 | ||||
| 2026-02-17 | 13F | Massar Capital Management, LP | 40.000 | 0,00 | 521 | 20,05 | ||||
| 2026-02-13 | 13F | Cohen & Steers, Inc. | 280.946 | -39,76 | 4 | -40,00 | ||||
| 2026-02-03 | 13F | Manning & Napier Advisors Llc | 315.414 | -3,39 | 4.132 | 16,53 | ||||
| 2026-02-17 | 13F | FIL Ltd | 31.025 | 0,00 | 404 | 20,24 | ||||
| 2026-01-27 | 13F | Waterfront Wealth Inc. | 78.951 | 1,61 | 1.275 | 42,62 | ||||
| 2026-02-17 | 13F | Quadrature Capital Ltd | 1.063.995 | 73,13 | 13.864 | 107,62 | ||||
| 2026-02-02 | 13F | Davis Selected Advisers | 2.931.198 | 0,00 | 38.194 | 19,98 | ||||
| 2026-02-20 | 13F | Larch Capital Partners Llc | 1.374.389 | 18.229 | ||||||
| 2026-02-11 | 13F | Stirlingshire Investments, Inc. | 15.939 | 218 | ||||||
| 2026-02-17 | 13F | Murchinson Ltd. | 0 | -100,00 | 0 | |||||
| 2026-02-17 | 13F | Guggenheim Capital Llc | 117.544 | 13,93 | 1.532 | 36,70 | ||||
| 2026-02-13 | 13F | Morgan Stanley | 12.563.174 | -12,10 | 163.698 | 5,47 | ||||
| 2026-02-10 | 13F | NS Partners Ltd | 702.500 | -13,79 | 9.154 | 3,44 | ||||
| 2026-01-13 | 13F | Kathmere Capital Management, LLC | 135.416 | 14,12 | 1.764 | 36,96 | ||||
| 2026-02-13 | 13F | JustInvest LLC | 46.836 | 7,24 | 610 | 28,69 | ||||
| 2026-02-12 | 13F | Qtron Investments LLC | 0 | -100,00 | 0 | |||||
| 2026-02-06 | 13F | Radnor Capital Management, LLC | 36.484 | -0,41 | 475 | 19,65 | ||||
| 2026-02-11 | 13F | LPL Financial LLC | 1.019.350 | 10,66 | 13.282 | 32,78 | ||||
| 2026-02-13 | 13F | Recurrent Investment Advisors LLC | 187.430 | 43,73 | 2.442 | 72,46 | ||||
| 2026-01-26 | 13F | Pursuit Wealth Management LLC | 56.658 | 738 | ||||||
| 2026-02-17 | 13F | Masters Capital Management Llc | 0 | -100,00 | 0 | |||||
| 2026-02-10 | 13F | Root Financial Partners, LLC | 18 | 0,00 | 0 | |||||
| 2025-10-08 | 13F/A | New York State Common Retirement Fund | 0 | -100,00 | 0 | -100,00 | ||||
| 2026-02-12 | 13F | Renaissance Technologies Llc | 11.040.637 | 50,06 | 143.860 | 80,04 | ||||
| 2026-02-10 | 13F | Texas Yale Capital Corp. | 12.900 | 24,04 | 168 | 50,00 | ||||
| 2026-01-21 | 13F | Aaron Wealth Advisors LLC | 21.429 | 279 | ||||||
| 2026-02-13 | 13F | Bridgewater Associates, LP | 6.024.497 | -17,92 | 78.499 | -1,52 | ||||
| 2026-02-17 | 13F | Mpwm Advisory Solutions, Llc | 173 | 0,00 | 2 | 100,00 | ||||
| 2026-02-17 | 13F | Lazard Asset Management Llc | 22.480.635 | 0,93 | 292.923 | 21,10 | ||||
| 2025-10-31 | 13F | Whittier Trust Co | 0 | -100,00 | 0 | -100,00 | ||||
| 2026-02-13 | 13F | Inspire Advisors, LLC | 20.025 | -5,70 | 261 | 13,04 | ||||
| 2026-02-11 | 13F | Parallel Advisors, LLC | 17.252 | -0,56 | 225 | 19,15 | ||||
| 2026-02-17 | 13F | Captrust Financial Advisors | 29.086 | 44,84 | 379 | 73,39 | ||||
| 2026-02-12 | 13F | CoreCommodity Management, LLC | 22.903 | 0,00 | 298 | 20,16 | ||||
| 2026-02-17 | 13F | Moore Capital Management, Lp | 271.000 | 3.531 | ||||||
| 2026-01-20 | 13F | AdvisorNet Financial, Inc | 19.632 | 0,00 | 256 | 19,72 | ||||
| 2025-10-17 | 13F | Retireful, LLC | 0 | -100,00 | 0 | |||||
| 2026-02-17 | 13F | Integrated Advisors Network LLC | 0 | -100,00 | 0 | |||||
| 2026-01-08 | 13F | Wealth Enhancement Advisory Services, Llc | 41.004 | 5,71 | 581 | 35,75 | ||||
| 2026-01-12 | 13F | Moody National Bank Trust Division | 19.072 | -6,66 | 249 | 12,22 | ||||
| 2026-02-17 | 13F | Woodline Partners LP | 0 | -100,00 | 0 | -100,00 | ||||
| 2026-01-06 | 13F | Investors Research Corp | 5.500 | 0,00 | 72 | 20,34 | ||||
| 2026-02-13 | 13F | Advyzon Investment Management, LLC | 15.887 | 207 | ||||||
| 2025-09-25 | NP | EEMGX - MFS Emerging Markets Equity Research Fund R4 | 5.667 | 16,82 | 54 | 20,00 | ||||
| 2026-02-10 | 13F | Rothschild Investment Llc | 335 | 0,00 | 4 | 33,33 | ||||
| 2026-02-10 | 13F | Murphy & Mullick Capital Management Corp | 500 | 0,00 | 7 | 20,00 | ||||
| 2026-02-18 | 13F | GWM Advisors LLC | 85.751 | 89,10 | 1.117 | 127,03 | ||||
| 2025-11-07 | 13F | Wealth Alliance | 0 | -100,00 | 0 | |||||
| 2026-02-17 | 13F | Ameriprise Financial Inc | 148.438 | -87,14 | 1.957 | -84,40 | ||||
| 2026-02-09 | 13F | Bleakley Financial Group, LLC | 22.984 | 6,70 | 299 | 28,33 | ||||
| 2026-02-17 | 13F | Greenline Partners, LLC | 661.200 | 96,67 | 8.615 | 135,96 | ||||
| 2026-01-23 | 13F | Sumitomo Mitsui Trust Holdings, Inc. | 199.605 | -2,79 | 2.601 | 16,64 | ||||
| 2026-02-13 | 13F | BNB Wealth Management, LLC | 10.000 | 130 | ||||||
| 2025-09-26 | NP | FBCGX - Fidelity Blue Chip Growth K6 Fund This fund is a listed as child fund of Fmr Llc and if that institution has disclosed ownership in this security, then these positions will not be double counted when calculating total shares and total value | 0 | -100,00 | 0 | -100,00 | ||||
| 2026-02-05 | 13F | Thrivent Financial For Lutherans | 378.799 | -27,99 | 5 | -20,00 | ||||
| 2026-01-21 | 13F | Rathbone Brothers plc | 0 | -100,00 | 0 | |||||
| 2026-02-06 | 13F | Cadence Wealth Management LLC | 43.644 | 0,43 | 569 | 20,59 | ||||
| 2026-02-12 | 13F | Ankerstar Wealth, LLC | 9 | 0 | ||||||
| 2026-02-06 | 13F | Profund Advisors Llc | 178.021 | 10,53 | 2.320 | 32,59 | ||||
| 2025-10-30 | 13F | Ridgewood Investments LLC | 92.611 | 51,88 | 684 | 15,37 | ||||
| 2026-01-08 | 13F | Traveka Wealth, LLC | 14.630 | 191 | ||||||
| 2026-01-29 | 13F | D.a. Davidson & Co. | 185.917 | -15,91 | 2.423 | 0,92 | ||||
| 2026-02-11 | 13F | TCTC Holdings, LLC | 560 | 0,00 | 7 | 16,67 | ||||
| 2026-02-09 | 13F | Atlantic Trust, LLC | 415 | 5 | ||||||
| 2026-02-13 | 13F | Knollwood Investment Advisory, LLC | 50.000 | 0,00 | 652 | 19,89 | ||||
| 2026-02-18 | 13F | Mackenzie Financial Corp | 1.338.132 | 15,47 | 17.495 | 39,01 | ||||
| 2026-02-06 | 13F | Signature Estate & Investment Advisors Llc | 10.496 | 0,00 | 137 | 20,35 | ||||
| 2026-02-09 | 13F | Genus Capital Management Inc. | 13.833 | -16,03 | 180 | 1,12 | ||||
| 2026-02-12 | 13F | Integrated Quantitative Investments LLC | 0 | -100,00 | 0 | |||||
| 2026-02-12 | 13F | Skopos Labs, Inc. | 221.075 | 359,88 | 2.856 | 510,26 | ||||
| 2026-01-15 | 13F | Highline Wealth Partners Llc | 1.699 | 83,28 | 22 | 120,00 | ||||
| 2025-11-12 | 13F | Transce3nd, LLC | 0 | -100,00 | 0 | -100,00 | ||||
| 2026-02-05 | 13F | May Hill Capital, LLC | 30.424 | 137,71 | 396 | 186,96 | ||||
| 2026-02-17 | 13F | Boreal Capital Management LLC | 560 | 0,00 | 7 | 16,67 | ||||
| 2026-02-13 | 13F | PCM Encore, LLC | 19.272 | 251 | ||||||
| 2026-02-17 | 13F | Cetera Investment Advisers | 207.502 | -6,28 | 2.704 | 12,44 | ||||
| 2026-01-20 | 13F | Lazari Capital Management, Inc. | 0 | -100,00 | 0 | |||||
| 2026-01-22 | 13F | Comprehensive Money Management Services LLC | 28.082 | -2,43 | 366 | 16,99 | ||||
| 2026-02-02 | 13F | CENTRAL TRUST Co | 1.500 | 0,00 | 20 | 18,75 | ||||
| 2025-09-26 | NP | FSGEX - Fidelity Series Global ex U.S. Index Fund This fund is a listed as child fund of Fmr Llc and if that institution has disclosed ownership in this security, then these positions will not be double counted when calculating total shares and total value | 34.124 | 0,00 | 325 | 2,52 | ||||
| 2025-09-25 | NP | DFAX - Dimensional World ex U.S. Core Equity 2 ETF | 239.247 | 10,58 | 2.280 | 13,21 | ||||
| 2026-01-29 | 13F | UMA Financial Services, Inc. | 589 | 0,00 | 8 | 16,67 | ||||
| 2026-02-17 | 13F | Bank Of America Corp /de/ | 9.932.169 | -41,44 | 129.416 | -29,74 | ||||
| 2026-02-17 | 13F | Jump Financial, LLC | 393.230 | -71,01 | 5.124 | -65,22 | ||||
| 2026-02-11 | 13F | Longfellow Investment Management Co Llc | 239.430 | -13,28 | 3.120 | 4,04 | ||||
| 2025-09-25 | NP | GBLAX - AMERICAN FUNDS GLOBAL BALANCED FUND Class A This fund is a listed as child fund of Capital World Investors and if that institution has disclosed ownership in this security, then these positions will not be double counted when calculating total shares and total value | 3.691.051 | 0,00 | 35.176 | 2,36 | ||||
| 2026-02-13 | 13F | Cloverfields Capital Group, Lp | 66.062 | -70,91 | 861 | -65,13 | ||||
| 2025-11-04 | 13F | Independent Advisor Alliance | 0 | -100,00 | 0 | -100,00 | ||||
| 2026-02-13 | 13F | Toroso Investments, LLC | 376.781 | 16,30 | 4.909 | 39,54 | ||||
| 2026-02-06 | 13F | New Millennium Group LLC | 12.937 | 169 | ||||||
| 2026-02-17 | 13F | Sig Brokerage, Lp | Put | 15.000 | 0,00 | 195 | 20,37 | |||
| 2025-09-26 | NP | FTCEX - Fidelity Total International Equity Fund Fidelity Advisor Total International Equity Fund: Class C This fund is a listed as child fund of Fmr Llc and if that institution has disclosed ownership in this security, then these positions will not be double counted when calculating total shares and total value | 175.668 | -22,30 | 1.674 | -20,44 | ||||
| 2026-02-04 | 13F | Tls Advisors Llc | 99.393 | 3,19 | 1 | 0,00 | ||||
| 2026-02-05 | 13F | Baader Bank INC | 40.421 | 304,21 | 525 | 385,19 | ||||
| 2026-02-13 | 13F | Centiva Capital, LP | 207.349 | 434,05 | 2.702 | 541,57 | ||||
| 2026-02-13 | 13F | Centiva Capital, LP | Put | 1.500.000 | 19.545 | |||||
| 2026-02-17 | 13F | Equitable Holdings, Inc. | 69.908 | 0,59 | 911 | 20,69 | ||||
| 2026-02-17 | 13F | Man Group plc | 5.629.183 | 36,10 | 73.348 | 63,30 | ||||
| 2026-01-06 | 13F | Tucker Asset Management Llc | 0 | -100,00 | 0 | |||||
| 2026-02-17 | 13F | CWM Advisors, LLC | 7.530 | 98 | ||||||
| 2026-02-02 | 13F | Horizon Investments, LLC | 0 | -100,00 | 0 | |||||
| 2026-02-11 | 13F | Capital International Sarl | 659.103 | 4,14 | 8.588 | 24,95 | ||||
| 2026-02-12 | 13F | Principal Securities, Inc. | 0 | -100,00 | 0 | |||||
| 2026-01-26 | 13F | Patriot Financial Group Insurance Agency, LLC | 0 | -100,00 | 0 | |||||
| 2026-02-11 | 13F | Allianz Asset Management GmbH | 1.774.300 | 8.771,50 | 23.119 | 10.553,92 | ||||
| 2026-02-11 | 13F | Letko, Brosseau & Associates Inc | 36.650 | 0,00 | 478 | 19,85 | ||||
| 2026-02-10 | 13F | State of Wyoming | 16.120 | 17,49 | 210 | 41,89 | ||||
| 2026-02-06 | 13F | Global Retirement Partners, LLC | 0 | -100,00 | 0 | |||||
| 2026-02-13 | 13F | Y-Intercept (Hong Kong) Ltd | 948.087 | -43,35 | 12.354 | -32,03 | ||||
| 2026-02-17 | 13F | Agf Management Ltd | 18.293 | -3,36 | 238 | 16,10 | ||||
| 2026-02-06 | 13F | Cedar Wealth Management, LLC | 100 | 0,00 | 1 | 0,00 | ||||
| 2025-09-25 | NP | ROAM - Hartford Multifactor Emerging Markets ETF | 23.377 | 24,06 | 223 | 18,09 | ||||
| 2025-09-26 | NP | FBGRX - Fidelity Blue Chip Growth Fund This fund is a listed as child fund of Fmr Llc and if that institution has disclosed ownership in this security, then these positions will not be double counted when calculating total shares and total value | 0 | -100,00 | 0 | -100,00 | ||||
| 2026-02-13 | 13F | Journey Strategic Wealth Llc | 23.816 | 26,65 | 310 | 51,96 | ||||
| 2025-11-13 | 13F | Glenmede Investment Management, LP | 0 | -100,00 | 0 | -100,00 | ||||
| 2026-02-17 | 13F | Brevan Howard Capital Management LP | 0 | -100,00 | 0 | -100,00 | ||||
| 2026-02-13 | 13F | Integrated Wealth Concepts LLC | 57.621 | -9,71 | 751 | 8,23 | ||||
| 2026-02-13 | 13F | Kiltearn Partners LLP | 1.157.336 | -17,03 | 15.080 | -0,46 | ||||
| 2026-02-13 | 13F | Neuberger Berman Group LLC | 148.004 | 32,65 | 1.928 | 59,21 | ||||
| 2026-02-11 | 13F | Capital Research Global Investors | 8.173.426 | 0,38 | 106.500 | 20,44 | ||||
| 2026-02-10 | 13F | Avestar Capital, LLC | Call | 2.000 | 0,00 | 26 | 23,81 | |||
| 2026-02-10 | 13F | Avestar Capital, LLC | 11.818 | -10,15 | 154 | 7,75 | ||||
| 2026-01-21 | 13F | Sowell Financial Services LLC | 15.696 | -14,52 | 205 | 2,51 | ||||
| 2026-02-17 | 13F | Cape Investment Advisory, Inc. | 670 | 89,80 | 9 | 166,67 | ||||
| 2026-02-05 | 13F | Pacific Heights Asset Management Llc | 500.000 | 0,00 | 6.515 | 19,98 | ||||
| 2026-02-04 | 13F | Pensionmark Financial Group, Llc | 33.546 | 115,16 | 222 | 31,36 | ||||
| 2026-02-09 | 13F | Geode Capital Management, Llc | 12.597 | -70,15 | 164 | -64,19 | ||||
| 2026-02-06 | 13F | Lsv Asset Management | 46.822 | 0,00 | 1 | |||||
| 2026-02-09 | 13F | Cary Street Partners Financial Llc | 9.499 | 0,00 | 124 | 19,42 | ||||
| 2026-02-10 | 13F | Foundations Investment Advisors, LLC | 1.264.002 | 16.470 | ||||||
| 2026-02-20 | 13F | Sunbelt Securities, Inc. | 250 | 0,00 | 3 | 50,00 | ||||
| 2026-02-13 | 13F | Bridgefront Capital, LLC | 0 | -100,00 | 0 | |||||
| 2025-09-29 | NP | TIIV - AAM Todd International Intrinsic Value ETF | 9.772 | 93 | ||||||
| 2026-02-06 | 13F | Creative Financial Designs Inc /adv | 1.225 | 0,00 | 16 | 15,38 | ||||
| 2026-02-17 | 13F | Moore Capital Management, Lp | Call | 0 | -100,00 | 0 | ||||
| 2026-02-05 | 13F | Cambridge Investment Research Advisors, Inc. | 465.441 | -5,20 | 6 | 20,00 | ||||
| 2026-02-20 | 13F/A | CMT Capital Markets Trading GmbH | 52.062 | -83,41 | 1 | -100,00 | ||||
| 2025-11-12 | 13F | NewSquare Capital LLC | 0 | -100,00 | 0 | |||||
| 2025-12-16 | 13F | Garde Capital, Inc. | 0 | -100,00 | 0 | |||||
| 2026-01-21 | 13F | Sound Income Strategies, LLC | 265 | 0,00 | 4 | 50,00 | ||||
| 2025-11-14 | 13F | AXA Investment Managers S.A. | 2.240 | 24 | ||||||
| 2026-01-26 | 13F | Mirae Asset Global Investments Co., Ltd. | 359.114 | 2,89 | 4.679 | 23,46 | ||||
| 2026-01-05 | 13F | Confluence Investment Management Llc | 0 | -100,00 | 0 | |||||
| 2026-02-13 | 13F | VPR Management LLC | 122.010 | 0,00 | 1.590 | 19,92 | ||||
| 2026-02-13 | 13F | Absolute Gestao de Investimentos Ltda. | 0 | -100,00 | 0 | |||||
| 2026-02-17 | 13F | Capital Fund Management S.a. | Call | 889.400 | -69,27 | 11.589 | -63,13 | |||
| 2026-02-11 | 13F | Franklin Resources Inc | 972.681 | 2,80 | 12.674 | 23,35 | ||||
| 2026-02-17 | 13F | Capital Fund Management S.a. | Put | 1.023.000 | -4,21 | 13.330 | 14,92 | |||
| 2026-01-14 | 13F | Redhawk Wealth Advisors, Inc. | 38.929 | 75,17 | 507 | 110,37 | ||||
| 2026-02-11 | 13F | Nikko Asset Management Americas, Inc. | 184.005 | 2.396 | ||||||
| 2026-02-12 | 13F | Marex Group plc | Call | 110.000 | 0,00 | 1.433 | 20,02 | |||
| 2025-11-14 | 13F | Axa S.a. | 0 | -100,00 | 0 | |||||
| 2026-01-08 | 13F | Grove Bank & Trust | 250 | 0,00 | 3 | 50,00 | ||||
| 2026-01-22 | 13F | Massachusetts Financial Services Co /ma/ | 8.488.758 | -11,49 | 110.609 | 6,19 | ||||
| 2026-02-10 | 13F | Savant Capital, LLC | 59.643 | 22,82 | 777 | 47,44 | ||||
| 2026-02-11 | 13F | Flagship Wealth Advisors, Llc | 47 | 0,00 | 1 | |||||
| 2025-11-13 | 13F | Crescent Grove Advisors, LLC | 0 | -100,00 | 0 | -100,00 | ||||
| 2026-01-16 | 13F | Standard Life Aberdeen plc | 2.838.991 | 2,41 | 36.992 | 24,31 | ||||
| 2026-01-27 | 13F | Genoa Capital Gestora de Recursos Ltda. | 0 | -100,00 | 0 | |||||
| 2026-02-10 | 13F | KERR FINANCIAL PLANNING Corp | 1.500 | 0,00 | 25 | 33,33 | ||||
| 2026-02-10 | 13F | Quantbot Technologies LP | 51.758 | -51,81 | 674 | -42,20 | ||||
| 2026-01-30 | 13F | State of New Jersey Common Pension Fund D | 478.398 | 0,00 | 6.234 | 19,98 | ||||
| 2026-02-17 | 13F | Jain Global LLC | 304.950 | 3.973 | ||||||
| 2026-01-13 | 13F | Mather Group, Llc. | 0 | -100,00 | 0 | |||||
| 2025-11-24 | 13F/A | Fulcrum Asset Management LLP | Put | 0 | -100,00 | 0 | -100,00 | |||
| 2026-02-10 | 13F | Bank of New York Mellon Corp | 70.982 | 17,58 | 925 | 41,07 | ||||
| 2025-09-25 | NP | Clough Global Dividend & Income Fund | 56.300 | 0,00 | 537 | 2,29 | ||||
| 2026-02-17 | 13F | Laird Norton Trust Company, Llc | 58.048 | 770 | ||||||
| 2026-02-09 | 13F | Mondrian Investment Partners LTD | 11.419.957 | 0,40 | 148.802 | 20,46 | ||||
| 2025-09-29 | NP | MPEMX - MONDRIAN EMERGING MARKETS VALUE EQUITY FUND | 36.819 | -5,29 | 351 | -3,05 | ||||
| 2026-02-11 | 13F | Capital Group Private Client Services, Inc. | 20.963 | -20,90 | 273 | -4,88 | ||||
| 2026-02-10 | 13F | Bnp Paribas Arbitrage, Sa | 4.585.885 | 150,73 | 59.754 | 200,83 | ||||
| 2026-02-17 | 13F | Moneda S.A. Administradora General de Fondos | 269.619 | -16,19 | 3.512 | -9,70 | ||||
| 2026-02-10 | 13F | Bnp Paribas Arbitrage, Sa | Put | 30.164 | 114,39 | 39.304 | 157,22 | |||
| 2026-02-10 | 13F | Bnp Paribas Arbitrage, Sa | Call | 15.670 | 55,80 | 20.418 | 86,94 | |||
| 2025-09-25 | NP | TIER - T. Rowe Price International Equity Research ETF | 2.116 | 20 | ||||||
| 2025-09-26 | NP | BLACKROCK FUNDS - BlackRock Emerging Markets ex-China Fund Investor A This fund is a listed as child fund of BlackRock, Inc. and if that institution has disclosed ownership in this security, then these positions will not be double counted when calculating total shares and total value | 0 | -100,00 | 0 | -100,00 | ||||
| 2026-02-13 | 13F | Verition Fund Management LLC | 466.039 | -30,66 | 6.072 | -16,81 | ||||
| 2026-02-13 | 13F | Citigroup Inc | Call | 1.488.200 | -1,33 | 19.391 | 18,39 | |||
| 2025-09-26 | NP | FAMKX - Fidelity Advisor Emerging Markets Fund Class A This fund is a listed as child fund of Fmr Llc and if that institution has disclosed ownership in this security, then these positions will not be double counted when calculating total shares and total value | 8.965.320 | -30,83 | 85.439 | -29,19 | ||||
| 2026-02-13 | 13F | Citigroup Inc | Put | 2.148.500 | 53,46 | 27.995 | 84,12 | |||
| 2025-09-26 | NP | Global Macro Absolute Return Advantage Portfolio - Global Macro Absolute Return Advantage Portfolio | 1.312.000 | 11,62 | 12.503 | 14,27 | ||||
| 2026-02-06 | 13F | Verde Servicos Internacionais S.A. | 249.600 | 0,00 | 3 | 50,00 | ||||
| 2026-02-14 | 13F | Rockefeller Capital Management L.P. | 44.204 | -2,41 | 576 | 17,11 | ||||
| 2025-10-30 | 13F | Stock Yards Bank & Trust Co | 0 | -100,00 | 0 | |||||
| 2026-02-13 | 13F | Verition Fund Management LLC | Put | 58.200 | -90,08 | 758 | -88,10 | |||
| 2026-02-13 | 13F | Citigroup Inc | 827.966 | -19,54 | 10.788 | -3,45 | ||||
| 2026-02-17 | 13F | Credit Agricole S A | Call | 100.000 | -60,00 | 1.303 | -52,01 | |||
| 2026-02-17 | 13F | Credit Agricole S A | 2.884 | -96,74 | 38 | -96,15 | ||||
| 2026-01-29 | 13F | Sava Infond d.o.o. | 60.000 | 39,53 | 782 | 67,60 | ||||
| 2026-02-13 | 13F | Schroder Investment Management Group | 0 | -100,00 | 0 | |||||
| 2026-02-11 | 13F | O'shaughnessy Asset Management, Llc | 2.540.879 | 12,84 | 33.108 | 35,39 | ||||
| 2026-02-13 | 13F | Flow Traders U.s. Llc | 59.201 | 1 | ||||||
| 2026-01-28 | 13F | Geneos Wealth Management Inc. | 15.495 | -32,62 | 202 | -19,28 | ||||
| 2026-02-12 | 13F | Sprott Inc. | 75.084 | -25,33 | 978 | -10,44 | ||||
| 2026-01-16 | 13F | Surience Private Wealth Llc | 170.190 | 2.218 | ||||||
| 2026-02-20 | 13F/A | Capital Markets Trading UK LLP | 30.251 | -87,66 | 0 | -100,00 | ||||
| 2026-02-09 | 13F | Harbour Investments, Inc. | 2.436 | -22,96 | 32 | -8,82 | ||||
| 2026-01-23 | 13F | Rsm Us Wealth Management Llc | 17.689 | 6,58 | 232 | 28,33 | ||||
| 2026-02-10 | 13F | NINE MASTS CAPITAL Ltd | 16.277 | -96,51 | 756 | -95,29 | ||||
| 2026-02-10 | 13F | NINE MASTS CAPITAL Ltd | Put | 11.500 | -41,62 | 16 | -97,44 | |||
| 2026-01-22 | 13F | Accordant Advisory Group Inc | 36 | -92,80 | 0 | -100,00 | ||||
| 2025-10-27 | 13F | Bogart Wealth, LLC | 0 | -100,00 | 0 | |||||
| 2026-02-12 | 13F | Triumph Capital Management | 3.085 | -0,32 | 40 | 21,21 | ||||
| 2026-02-17 | 13F | Capital Fund Management S.a. | 1.754.916 | 173,80 | 22.867 | 228,53 | ||||
| 2025-11-06 | 13F | Whipplewood Advisors, LLC | 0 | -100,00 | 0 | |||||
| 2026-02-17 | 13F | Sig Brokerage, Lp | Call | 0 | -100,00 | 0 | -100,00 | |||
| 2026-02-12 | 13F | Callan Family Office, LLC | 55.364 | 108,99 | 721 | 151,22 | ||||
| 2026-02-12 | 13F | Federation des caisses Desjardins du Quebec | 38.247 | 21,79 | 498 | 46,04 | ||||
| 2026-02-17 | 13F | Price T Rowe Associates Inc /md/ | 1.485.036 | -6,15 | 19 | 11,76 | ||||
| 2026-02-10 | 13F | Monaco Asset Management SAM | 0 | -100,00 | 0 | |||||
| 2026-01-29 | 13F | Teachers Retirement System Of The State Of Kentucky | 4.072.400 | 51,96 | 53 | 82,76 | ||||
| 2026-02-10 | 13F | Connor, Clark & Lunn Investment Management Ltd. | 17.937.883 | 36,12 | 233.731 | 63,32 | ||||
| 2026-02-12 | 13F | Tocqueville Asset Management L.p. | 80.614 | 1.050 | ||||||
| 2026-02-13 | 13F | Verition Fund Management LLC | Call | 0 | -100,00 | 0 | -100,00 | |||
| 2026-02-10 | 13F | Natixis Advisors, L.p. | 469.790 | 11,71 | 6 | 50,00 | ||||
| 2026-02-17 | 13F | Sig Brokerage, Lp | 0 | -100,00 | 0 | -100,00 | ||||
| 2026-02-05 | 13F | Atria Investments Llc | 11.270 | -5,51 | 147 | 13,18 | ||||
| 2026-02-03 | 13F | Chesapeake Capital Corp /il/ | 72.358 | 0,90 | 943 | 21,08 | ||||
| 2026-02-12 | 13F | Cibc World Markets Corp | 0 | -100,00 | 0 | |||||
| 2025-11-13 | 13F | Riggs Asset Managment Co. Inc. | 0 | -100,00 | 0 | |||||
| 2025-11-13 | 13F | EntryPoint Capital, LLC | 0 | -100,00 | 0 | -100,00 | ||||
| 2025-10-21 | 13F | American National Bank | 0 | -100,00 | 0 | |||||
| 2025-11-13 | 13F | Diametric Capital, LP | 0 | -100,00 | 0 | |||||
| 2026-02-09 | 13F | Leavell Investment Management, Inc. | 11.215 | 149 | ||||||
| 2026-02-12 | 13F | Brown Brothers Harriman & Co | 1.442 | -83,95 | 19 | -83,49 | ||||
| 2026-02-23 | 13F | Vinland Capital Management Gestora de Recursos LTDA. | 50.000 | 652 | ||||||
| 2026-02-13 | 13F | Baird Financial Group, Inc. | 369.699 | 4.817 | ||||||
| 2025-09-25 | NP | Dfa Investment Trust Co - The Emerging Markets Series This fund is a listed as child fund of Dimensional Fund Advisors Lp and if that institution has disclosed ownership in this security, then these positions will not be double counted when calculating total shares and total value | 537.780 | 0,00 | 5.125 | 2,38 | ||||
| 2026-02-11 | 13F | Cerity Partners LLC | 38.514 | 31,78 | 502 | 58,04 | ||||
| 2026-01-13 | 13F | Fort Washington Investment Advisors Inc /oh/ | 24.923 | 29,25 | 325 | 55,02 | ||||
| 2026-02-12 | 13F | Hrt Financial Lp | 0 | -100,00 | 0 | |||||
| 2026-02-12 | 13F | Advisory Resource Group | 120.355 | -8,86 | 1.568 | 9,34 | ||||
| 2026-02-02 | 13F | Miracle Mile Advisors, LLC | 13.523 | 2,66 | 176 | 23,08 | ||||
| 2026-02-03 | 13F | Orion Capital Management LLC | 0 | -100,00 | 0 | |||||
| 2026-01-15 | 13F | J. Safra Sarasin Holding AG | 68.200 | 0,00 | 889 | 20,00 | ||||
| 2026-02-13 | 13F | Bank Of Nova Scotia | 56.033 | -1,01 | 730 | 18,89 | ||||
| 2026-01-09 | 13F | 180 Wealth Advisors, Llc | 82.508 | -3,91 | 1.075 | 15,34 | ||||
| 2026-02-17 | 13F | Ameriflex Group, Inc. | 600 | 8 | ||||||
| 2026-02-13 | 13F | Smartleaf Asset Management LLC | 5.311 | 1.064,69 | 70 | 1.625,00 | ||||
| 2026-02-20 | 13F/A | CMT Capital Markets Trading GmbH | Put | 3.922.300 | -3,16 | 51 | 18,60 | |||
| 2026-01-16 | 13F | Vanguard Capital Wealth Advisors This fund is a listed as child fund of Vanguard Group Inc and if that institution has disclosed ownership in this security, then these positions will not be double counted when calculating total shares and total value | 10.500 | 137 | ||||||
| 2026-02-17 | 13F | Banco Bilbao Vizcaya Argentaria, S.a. | 0 | -100,00 | 0 | |||||
| 2025-11-13 | 13F | VGI Partners Ltd | 0 | -100,00 | 0 | |||||
| 2026-02-17 | 13F | Jones Financial Companies Lllp | 51.199 | 9,01 | 667 | 32,87 | ||||
| 2026-02-05 | 13F/A | Fulcrum Asset Management LLP | 28.982 | -9,08 | 380 | 9,54 | ||||
| 2026-02-11 | 13F | Simplex Trading, Llc | Put | 1.826.100 | -17,41 | 23.794 | 99.041,67 | |||
| 2026-02-11 | 13F | Simplex Trading, Llc | 636.509 | 8.294 | ||||||
| 2026-01-15 | 13F | SILVER OAK SECURITIES, Inc | 33.650 | 0,00 | 441 | 20,55 | ||||
| 2026-01-29 | 13F | Calamos Advisors LLC | 74.150 | 180,34 | 966 | 236,59 | ||||
| 2026-02-11 | 13F | Winton Capital Group Ltd | 99.000 | 1.290 | ||||||
| 2026-01-22 | 13F | Financial Consulate, Inc | 500 | 7 | ||||||
| 2026-01-22 | 13F | HHM Wealth Advisors, LLC | 700 | 0,00 | 9 | 28,57 | ||||
| 2026-01-23 | 13F | Nbt Bank N A /ny | 13 | 18,18 | 1 | |||||
| 2026-02-13 | 13F | Cornerstone Financial Management LLC | 51 | 1 | ||||||
| 2026-01-29 | 13F | IMC-Chicago, LLC | Put | 255.400 | 90,74 | 3.328 | 128,82 | |||
| 2026-01-14 | 13F | Jfs Wealth Advisors, Llc | 1.836 | 0,00 | 24 | 26,32 | ||||
| 2026-02-13 | 13F | Colony Group, LLC | 32.875 | 428 | ||||||
| 2025-09-26 | NP | RTXAX - Tax-Managed Real Assets Fund Class A | 99.402 | 52,38 | 947 | 56,01 | ||||
| 2026-01-20 | 13F | Wall Street Access Asset Management, LLC | 5.907 | 0,00 | 77 | 18,75 | ||||
| 2026-02-11 | 13F | Janney Montgomery Scott LLC | 29.218 | -48,63 | 0 | |||||
| 2026-01-29 | 13F | Calamos Advisors LLC | Call | 0 | -100,00 | 0 | -100,00 | |||
| 2025-10-30 | 13F | Ridgewood Investments LLC | Call | 0 | -100,00 | 0 | -100,00 | |||
| 2026-01-23 | 13F | Financial Connections Group, Inc. | 1.000 | 0,00 | 0 | |||||
| 2025-09-25 | NP | DFCEX - Emerging Markets Core Equity Portfolio - Institutional Class This fund is a listed as child fund of Dimensional Fund Advisors Lp and if that institution has disclosed ownership in this security, then these positions will not be double counted when calculating total shares and total value | 1.040.592 | 0,00 | 9.917 | 2,36 | ||||
| 2026-02-09 | 13F | Todd Asset Management Llc | 6.239.516 | 51,62 | 81.301 | 81,92 | ||||
| 2026-02-17 | 13F | Abel Hall, LLC | 32.000 | 0,00 | 417 | 19,88 | ||||
| 2026-02-17 | 13F | Qube Research & Technologies Ltd | 0 | -100,00 | 0 | |||||
| 2026-01-15 | 13F | Shrier Wealth Management, Llc | 22.677 | 295 | ||||||
| 2025-09-25 | NP | DEHP - Dimensional Emerging Markets High Profitability ETF | 9.111 | -14,30 | 87 | -12,24 | ||||
| 2025-09-26 | NP | DINT - Davis Select International ETF | 548.439 | -1,82 | 5.227 | 0,50 | ||||
| 2026-02-17 | 13F | Creative Planning | 274.994 | 37,54 | 3.583 | 65,04 | ||||
| 2026-02-09 | 13F | Employees Retirement System of Texas | 170.991 | 2 | ||||||
| 2025-11-12 | 13F | Corient IA LLC | 0 | -100,00 | 0 | -100,00 | ||||
| 2026-02-09 | 13F | Wellington Shields Capital Management, LLC | 0 | -100,00 | 0 | |||||
| 2026-01-12 | 13F | Abound Wealth Management | 30 | 0,00 | 0 | |||||
| 2026-02-17 | 13F | Boothbay Fund Management, Llc | 13.706 | 179 | ||||||
| 2026-02-10 | 13F | Sittner & Nelson, Llc | 237 | 0,00 | 4 | 50,00 | ||||
| 2026-02-13 | 13F | Parkside Financial Bank & Trust | 188 | 0,00 | 2 | 0,00 | ||||
| 2026-01-13 | 13F | Bank & Trust Co | 200 | 0,00 | 3 | 0,00 | ||||
| 2026-01-14 | 13F | Trust Co Of Oklahoma | 10.000 | 0,00 | 130 | 20,37 | ||||
| 2026-01-28 | 13F | DekaBank Deutsche Girozentrale | 631.753 | 0,00 | 9 | 33,33 | ||||
| 2026-02-13 | 13F | Marshall Wace, Llp | 3.165.210 | 41.243 | ||||||
| 2026-02-13 | 13F | Impala Asset Management LLC | 160.000 | 2.085 | ||||||
| 2025-09-25 | NP | AMTAX - AB All Market Real Return Portfolio Class A | 72.730 | 46,31 | 693 | 50,00 | ||||
| 2026-02-12 | 13F | Wealthspire Advisors, LLC | 0 | -100,00 | 0 | -100,00 | ||||
| 2026-02-12 | 13F | Alps Advisors Inc | 0 | -100,00 | 0 | |||||
| 2026-02-03 | 13F | Garner Asset Management Corp | 275 | 4 | ||||||
| 2026-02-05 | 13F | Allworth Financial LP | 19.374 | 74,93 | 252 | 110,00 | ||||
| 2026-02-03 | 13F | Ballentine Partners, LLC | 30.684 | 7,22 | 400 | 28,71 | ||||
| 2026-02-13 | 13F | Ubs Asset Management Americas Inc | 100.020 | 1.303 | ||||||
| 2026-01-28 | 13F | N.E.W. Advisory Services LLC | 2.000 | 26 | ||||||
| 2026-02-06 | 13F | Kilter Group LLC | 0 | -100,00 | 0 | |||||
| 2026-01-29 | 13F | Deltec Asset Management Llc | 16.500 | 0,00 | 215 | 19,55 | ||||
| 2026-01-09 | 13F | SG Americas Securities, LLC | 808.326 | 99,39 | 11 | 150,00 | ||||
| 2026-01-05 | 13F | Rosenberg Matthew Hamilton | 2.483 | 0,00 | 32 | 23,08 | ||||
| 2026-02-13 | 13F | Barclays Plc | 1.561.385 | -38,99 | 20.345 | -26,80 | ||||
| 2026-02-17 | 13F | Adage Capital Partners Gp, L.l.c. | 0 | -100,00 | 0 | |||||
| 2025-09-25 | NP | DAADX - Emerging Markets ex China Core Equity Portfolio Institutional Class | 301.863 | -31,03 | 2.877 | -29,41 | ||||
| 2026-01-26 | 13F | Monument Capital Management | 18.765 | 45,34 | 245 | 74,29 | ||||
| 2026-01-23 | 13F | Farther Finance Advisors, LLC | 33.009 | 50,53 | 430 | 80,67 | ||||
| 2025-11-07 | 13F | Sierra Ocean, Llc | 0 | -100,00 | 0 | |||||
| 2025-10-17 | 13F | Thompson Investment Management, Inc. | 0 | -100,00 | 0 | |||||
| 2026-02-05 | 13F | Gabelli Funds Llc | 10.000 | 0,00 | 130 | 20,37 | ||||
| 2026-02-13 | 13F | Johnson Investment Counsel Inc | 0 | -100,00 | 0 | |||||
| 2026-01-28 | 13F | Kapitalo Investimentos Ltda | 0 | -100,00 | 0 | |||||
| 2026-02-12 | 13F | Mint Tower Capital Management B.V. | 20.000 | 0 | ||||||
| 2026-02-12 | 13F | Mint Tower Capital Management B.V. | Call | 284.900 | 4 | |||||
| 2025-09-25 | NP | DEXC - Dimensional Emerging Markets ex China Core Equity ETF | 97.400 | 16,51 | 928 | 19,28 | ||||
| 2025-09-25 | NP | Dimensional Emerging Markets Value Fund - Dimensional Emerging Markets Value Fund This fund is a listed as child fund of Dimensional Fund Advisors Lp and if that institution has disclosed ownership in this security, then these positions will not be double counted when calculating total shares and total value | 656.676 | 0,00 | 6.258 | 2,37 | ||||
| 2026-02-12 | 13F | Mint Tower Capital Management B.V. | Put | 309.900 | 4 | |||||
| 2026-02-13 | 13F | Pathstone Holdings, LLC | 32.917 | 30,28 | 429 | 56,57 | ||||
| 2026-02-13 | 13F | Ubs Oconnor Llc | 0 | -100,00 | 0 | |||||
| 2026-01-05 | 13F | Park Avenue Securities Llc | 21.431 | 58,03 | 0 | |||||
| 2026-02-20 | 13F/A | Capital Markets Trading UK LLP | Put | 2.149.100 | -5,22 | 28 | 16,67 | |||
| 2026-02-17 | 13F | Caption Management, LLC | 770.000 | 10.033 | ||||||
| 2026-02-17 | 13F | Holocene Advisors, LP | 7.532.061 | 226,84 | 98.143 | 292,14 | ||||
| 2026-02-19 | 13F | Birchwood Financial Partners, Inc. | 1.620 | 21 | ||||||
| 2026-02-13 | 13F | Mariner, LLC | 152.538 | 8,62 | 1.988 | 30,30 | ||||
| 2026-01-09 | 13F | Pacifica Partners Inc. | 0 | -100,00 | 0 | |||||
| 2025-11-13 | 13F | Tepp RIA, LLC | 0 | -100,00 | 0 | -100,00 | ||||
| 2026-02-13 | 13F | Barclays Plc | Call | 13.700 | 0,00 | 179 | 20,27 | |||
| 2026-02-10 | 13F | CIBC World Markets Inc. | 816.277 | 9,09 | 10.636 | 30,89 | ||||
| 2026-01-07 | 13F | Riversedge Advisors, Llc | 12.938 | 169 | ||||||
| 2026-02-06 | 13F | GPS Wealth Strategies Group, LLC | 0 | -100,00 | 0 | |||||
| 2026-01-27 | 13F | Evergreen Capital Management Llc | 25.049 | 9,77 | 340 | 37,25 | ||||
| 2026-02-03 | 13F | AssuredPartners Investment Advisors, LLC | 36.350 | 474 | ||||||
| 2025-10-07 | 13F | GFG Capital, LLC | 0 | -100,00 | 0 | |||||
| 2026-02-17 | 13F | Clough Capital Partners L P | 0 | -100,00 | 0 | |||||
| 2026-02-17 | 13F | Caption Management, LLC | Put | 1.875.400 | 24.436 | |||||
| 2026-02-17 | 13F | Caption Management, LLC | Call | 2.155.400 | 28.085 | |||||
| 2026-01-08 | 13F | Wedmont Private Capital | 25.460 | 4,96 | 363 | 35,96 | ||||
| 2026-02-17 | 13F | Advisor Group Holdings, Inc. | 315.802 | -0,95 | 4.115 | 24,21 | ||||
| 2026-02-06 | 13F | Pnc Financial Services Group, Inc. | 28.913 | 2,23 | 377 | 22,48 | ||||
| 2026-02-13 | 13F | Stifel Financial Corp | 254.707 | -2,87 | 3.319 | 16,54 | ||||
| 2026-01-27 | 13F | Ninety One North America, Inc. | 3.361.779 | -0,47 | 43.804 | 19,42 | ||||
| 2026-02-12 | 13F | Advisors Asset Management, Inc. | 263.799 | -4,28 | 3.437 | 14,87 | ||||
| 2026-02-10 | 13F | NINE MASTS CAPITAL Ltd | Call | 0 | -100,00 | 0 | -100,00 | |||
| 2026-01-30 | 13F | Carrera Capital Advisors | 13.961 | 7,42 | 191 | 34,75 | ||||
| 2025-09-26 | NP | Global Opportunities Portfolio - Global Opportunities Portfolio | 496.500 | 29,13 | 4.732 | 32,19 | ||||
| 2026-02-17 | 13F | PointState Capital LP | 1.542.021 | 20.093 | ||||||
| 2026-01-05 | 13F | GAMMA Investing LLC | 4.483 | -0,42 | 58 | 20,83 | ||||
| 2025-10-30 | 13F | Twin Peaks Wealth Advisors, LLC | 0 | -100,00 | 0 | |||||
| 2026-02-13 | 13F | Gts Securities Llc | 20.980 | 273 | ||||||
| 2026-02-05 | 13F | Elyxium Wealth, LLC | 105 | 1 | ||||||
| 2026-01-21 | 13F | South Shore Capital Advisors | 0 | -100,00 | 0 | |||||
| 2026-01-28 | 13F | Financial Perspectives, Inc | 39.316 | 0,00 | 512 | 20,19 | ||||
| 2026-01-16 | 13F | Empirical Financial Services, LLC d.b.a. Empirical Wealth Management | 34.258 | 446 | ||||||
| 2026-02-23 | 13F | Virtu Financial LLC | 0 | -100,00 | 0 |