Grundlæggende statistik
| Institutionelle ejere | 1037 total, 1004 long only, 2 short only, 31 long/short - change of -29,42% MRQ |
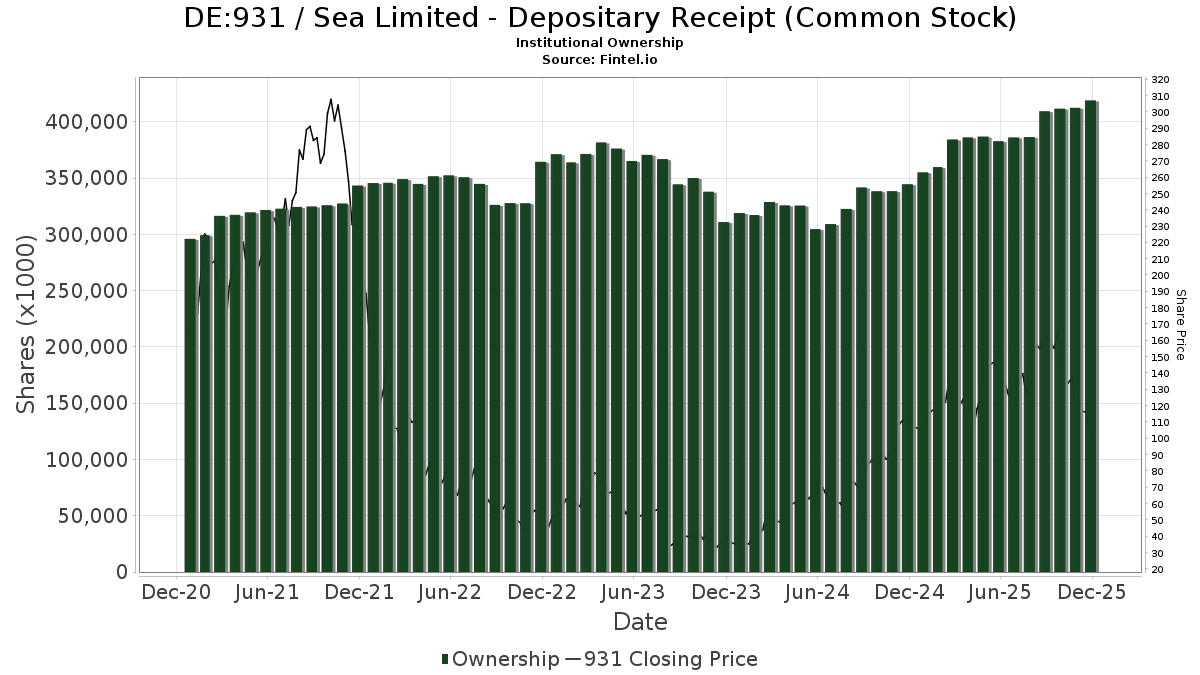
| Del pris | 76,40 |
| Gennemsnitlig porteføljeallokering | 0.6553 % - change of -22,63% MRQ |
| Institutionelle aktier (lange) | 395.900.412 (ex 13D/G) - change of -23,01MM shares -5,49% MRQ |
| Institutionel værdi (lang) | $ 47.074.787 USD ($1000) |
Institutionelt ejerskab og aktionærer
Sea Limited - Depositary Receipt (Common Stock) (DE:931) har 1037 institutionelle ejere og aktionærer, der har indsendt 13D/G- eller 13F-formularer til Securities Exchange Commission (SEC). Disse institutioner har i alt 395,914,540 aktier. Største aktionærer omfatter Baillie Gifford & Co, Wcm Investment Management, Llc, Jpmorgan Chase & Co, Price T Rowe Associates Inc /md/, BlackRock, Inc., Fmr Llc, Tiger Global Management Llc, State Street Corp, Schroder Investment Management Group, and Sands Capital Management, Llc .
Sea Limited - Depositary Receipt (Common Stock) (DB:931) institutionel ejerskabsstruktur viser aktuelle positioner i virksomheden efter institutioner og fonde, samt seneste ændringer i positionsstørrelse. Større aktionærer kan omfatte individuelle investorer, investeringsforeninger, hedgefonde eller institutioner. Skema 13D angiver, at investoren besidder (eller besidder) mere end 5 % af virksomheden og har til hensigt (eller har til hensigt at) aktivt at forfølge en ændring i forretningsstrategi. Skema 13G indikerer en passiv investering på over 5%.
The share price as of March 10, 2026 is 76,40 / share. Previously, on March 11, 2025, the share price was 116,40 / share. This represents a decline of 34,36% over that period.
Fondens stemningsscore
Fund Sentiment Score (fka Ownership Accumulation Score) finder de aktier, der bliver mest købt af fonde. Det er resultatet af en sofistikeret, multi-faktor kvantitativ model, der identificerer virksomheder med de højeste niveauer af institutionel akkumulering. Scoringsmodellen bruger en kombination af den samlede stigning i oplyste ejere, ændringerne i porteføljeallokeringer i disse ejere og andre målinger. Tallet går fra 0 til 100, hvor højere tal indikerer et højere niveau af akkumulering for sine jævnaldrende, og 50 er gennemsnittet.
Opdateringsfrekvens: Dagligt
Se Ownership Explorer, som giver en liste over højest rangerende virksomheder.
AI+ Ask Fintel’s AI assistant about Sea Limited - Depositary Receipt (Common Stock).
Select a question to share a public post with an AI-crafted answer.
Thinking of good questions…
13F og NPORT arkivering
Detaljer om 13F-arkivering er gratis. Detaljer om NP-ansøgninger kræver et premium-medlemskab. Grønne rækker angiver nye positioner. Røde rækker angiver lukkede positioner. Klik på linket ikon for at se den fulde transaktionshistorik.
Opgrader
for at låse premium-data op og eksportere til Excel ![]() .
.
Important Note
In an effort to reduce load times for our mobile users, we are testing some ways to deliver lighter pages.
In this first test, we will deliver only the most recent 750 transactions (out of 1386 for this stock). If you are interested in loading *all* the transactions for this company, click the "load all" button below. This is just a test and if you don't like it, please let us know by submitting some gentle feedback via the link at the bottom of this page.
Load All| Fil dato | Kilde | Investor | Type | Gennemsnitlig pris (Øst) |
Aktier | Δ Aktier (%) |
Rapporteret Værdi ($1000) |
Δ Værdi (%) |
Port Alloc (%) |
|
|---|---|---|---|---|---|---|---|---|---|---|
| 2026-01-26 | 13F | Private Trust Co Na | 249 | -10,75 | 32 | -36,73 | ||||
| 2026-02-17 | 13F | Nearwater Capital Markets, Ltd | 67.500 | 0,00 | 8.611 | -28,63 | ||||
| 2026-02-12 | 13F | Ci Investments Inc. | 0 | -100,00 | 0 | |||||
| 2026-02-17 | 13F | SageView Advisory Group, LLC | 268 | 34 | ||||||
| 2025-10-07 | 13F | Thurston, Springer, Miller, Herd & Titak, Inc. | 0 | -100,00 | 0 | |||||
| 2026-02-19 | 13F | Atomi Financial Group, Inc. | 4.196 | -6,40 | 535 | -33,21 | ||||
| 2026-01-29 | 13F | Mivtachim The Workers Social Insurance Fund Ltd. (Under Special Management) | 38.000 | 4.848 | ||||||
| 2025-09-25 | NP | PRASX - T. Rowe Price New Asia Fund This fund is a listed as child fund of Price T Rowe Associates Inc /md/ and if that institution has disclosed ownership in this security, then these positions will not be double counted when calculating total shares and total value | 146.462 | 9,01 | 22.943 | 27,38 | ||||
| 2026-02-13 | 13F | Kids Capital Management, L.p. | 31.000 | 3.955 | ||||||
| 2026-02-10 | 13F | Triglav Skladi, D.o.o. | 23.000 | 360,00 | 2.933 | 228,33 | ||||
| 2026-02-11 | 13F | ARK Investment Management LLC | 148.172 | -5,70 | 18.902 | -32,69 | ||||
| 2026-01-29 | 13F | Aprio Wealth Management, LLC | 0 | -100,00 | 0 | -100,00 | ||||
| 2026-02-13 | 13F | Ossiam | 129.574 | -0,25 | 16.530 | -28,80 | ||||
| 2026-02-13 | 13F | Resources Management Corp /ct/ /adv | 16.603 | 166,20 | 2 | 100,00 | ||||
| 2025-09-26 | NP | MSTFX - Morningstar International Equity Fund | 3.416 | 535 | ||||||
| 2025-09-26 | NP | JIJIX - John Hancock International Dynamic Growth Fund Class NAV | 257.200 | 1.016,80 | 40.290 | 409,23 | ||||
| 2026-01-26 | 13F | Moran Wealth Management, LLC | 30.564 | 338,51 | 3.899 | 213,17 | ||||
| 2026-02-17 | 13F | Oberweis Asset Management Inc/ | 0 | -100,00 | 0 | |||||
| 2026-02-05 | 13F | Stephens Inc /ar/ | 1.752 | 46,49 | 224 | 4,69 | ||||
| 2025-11-14 | 13F | Strategic Wealth Partners, Ltd. | 100 | 0,00 | 18 | 13,33 | ||||
| 2026-01-07 | 13F | Hilltop National Bank | 301 | -12,24 | 38 | -37,70 | ||||
| 2026-02-17 | 13F | Dv Equities, Llc | 500 | 64 | ||||||
| 2026-01-07 | 13F | Aventura Private Wealth, LLC | 67 | 0,00 | 9 | -27,27 | ||||
| 2026-02-03 | 13F | We Are One Seven, LLC | 3.135 | -68,93 | 400 | -77,87 | ||||
| 2026-02-13 | 13F | Blueshift Asset Management, LLC | 3.043 | 46,02 | 388 | 4,30 | ||||
| 2025-09-26 | NP | RAZAX - Multi-Asset Growth Strategy Fund Class A | 7.283 | 187,64 | 1.141 | 236,28 | ||||
| 2026-02-10 | 13F | Guardcap Asset Management Ltd | 5.095 | -13,57 | 650 | -38,37 | ||||
| 2025-09-25 | NP | PWJAX - PGIM Jennison International Opportunities Fund Class A | 1.259.332 | 41,93 | 197.274 | 65,86 | ||||
| 2026-02-09 | 13F | Putnam Fl Investment Management Co | 2.487 | 16,93 | 317 | -16,58 | ||||
| 2026-01-30 | 13F | North Star Investment Management Corp. | 18 | 0,00 | 2 | -33,33 | ||||
| 2026-01-29 | 13F | Nbc Securities, Inc. | 155 | 0,00 | 20 | -29,63 | ||||
| 2026-02-02 | 13F | CX Institutional | 1.033 | 2,68 | 0 | |||||
| 2026-02-12 | 13F | Raiffeisen Bank International AG | 7.732 | 10,11 | 992 | -22,14 | ||||
| 2026-01-21 | 13F | Greenleaf Trust | 4.061 | -0,49 | 518 | -28,94 | ||||
| 2025-11-12 | 13F | Edgestream Partners, L.P. | 0 | -100,00 | 0 | |||||
| 2026-01-27 | 13F | Ninety One UK Ltd | 50.450 | -96,63 | 6.436 | -97,59 | ||||
| 2026-01-30 | 13F | Us Bancorp \de\ | 113.121 | -25,06 | 14.431 | -46,51 | ||||
| 2026-02-12 | 13F | Bank Of Montreal /can/ | 242.383 | -75,43 | 30.921 | -82,46 | ||||
| 2026-02-13 | 13F | Altrafin AG | 2.810 | -75,37 | 358 | -82,44 | ||||
| 2026-02-17 | 13F | Ribbit Management Company, LLC | 1.010.179 | -8,18 | 128.869 | -34,46 | ||||
| 2026-01-29 | 13F | Concurrent Investment Advisors, LLC | 4.416 | -76,95 | 563 | -83,56 | ||||
| 2026-01-13 | 13F | Syquant Capital Sas | 446.114 | 57 | ||||||
| 2026-02-17 | 13F | Oaktree Fund Advisors, LLC | 0 | -100,00 | 0 | -100,00 | ||||
| 2026-02-09 | 13F | Powell Investment Advisors, LLC | 6.039 | 0,00 | 770 | -28,64 | ||||
| 2026-02-10 | 13F | Sivia Capital Partners, LLC | 1.575 | -5,80 | 201 | -32,89 | ||||
| 2026-02-13 | 13F | Laurion Capital Management LP | Call | 0 | -100,00 | 0 | ||||
| 2026-02-13 | 13F | Truvestments Capital Llc | 563 | 0,00 | 72 | -29,00 | ||||
| 2026-01-28 | 13F | Franchise GP Ltd | 4.266 | 544 | ||||||
| 2026-02-13 | 13F | American Century Companies Inc | 299.486 | -21,25 | 38.205 | -43,79 | ||||
| 2026-02-12 | 13F | Federation des caisses Desjardins du Quebec | 79.376 | -17,27 | 10.125 | -40,96 | ||||
| 2026-02-12 | 13F | Dimensional Fund Advisors Lp | 56.745 | -0,84 | 7.239 | -29,23 | ||||
| 2026-02-12 | 13F | Dalton Investments LLC | 42.800 | 53,96 | 5.460 | 9,88 | ||||
| 2026-01-29 | 13F | Resonant Capital Advisors, LLC | 1.820 | 1,11 | 232 | -27,73 | ||||
| 2026-01-23 | 13F | LOM Asset Management Ltd | 275 | 37,50 | 35 | -2,78 | ||||
| 2025-11-05 | 13F | Soundwatch Capital LLC | 0 | -100,00 | 0 | -100,00 | ||||
| 2026-02-12 | 13F | Nuveen, LLC | 944.323 | -5,13 | 120.467 | -32,29 | ||||
| 2025-09-25 | NP | JEMA - JPMorgan Emerging Markets Equity Core ETF | 12.289 | 269,93 | 1.925 | 332,58 | ||||
| 2025-11-14 | 13F | Evelyn Partners Investment Management LLP | 0 | -100,00 | 0 | -100,00 | ||||
| 2025-11-12 | 13F | Creekmur Asset Management LLC | 7.100 | -23,73 | 1.269 | -14,78 | ||||
| 2026-02-04 | 13F | Atlantic Union Bankshares Corp | 120 | 5,26 | 15 | -25,00 | ||||
| 2026-01-20 | 13F | AdvisorNet Financial, Inc | 317 | -38,68 | 40 | -56,52 | ||||
| 2026-02-17 | 13F | Fmr Llc | 17.504.405 | 61,96 | 2.233.037 | 15,60 | ||||
| 2026-02-11 | 13F | Clearbridge Investments, LLC | 2.035.302 | -22,48 | 259.643 | -44,67 | ||||
| 2026-02-09 | 13F | Hantz Financial Services, Inc. | 13.039 | -10,09 | 2 | -50,00 | ||||
| 2026-02-14 | 13F | Adalta Capital Management LLC | 0 | -100,00 | 0 | |||||
| 2026-01-05 | 13F | Park National Corp /oh/ | 3.692 | -1,44 | 471 | -29,75 | ||||
| 2026-01-29 | 13F | Pictet Asset Management Holding SA | 483.546 | 32,84 | 61.686 | -5,19 | ||||
| 2026-02-13 | 13F | State Street Corp | 7.050.480 | 7,32 | 899.430 | -23,40 | ||||
| 2025-09-26 | NP | FHKCX - Fidelity China Region Fund This fund is a listed as child fund of Fmr Llc and if that institution has disclosed ownership in this security, then these positions will not be double counted when calculating total shares and total value | 117.700 | 0,00 | 18.438 | 16,86 | ||||
| 2026-02-11 | 13F | Krane Funds Advisors LLC | 10.705 | 54,74 | 1.366 | 22,97 | ||||
| 2025-09-24 | NP | Managed Account Series - BlackRock GA Disciplined Volatility Equity Fund Class K | 0 | -100,00 | 0 | -100,00 | ||||
| 2026-02-09 | 13F | Hartland & Co., LLC | 411 | 9,02 | 52 | -22,39 | ||||
| 2025-10-30 | 13F | Twin Peaks Wealth Advisors, LLC | 0 | -100,00 | 0 | |||||
| 2026-01-21 | 13F | SeaTown Holdings Pte. Ltd. | 0 | -100,00 | 0 | |||||
| 2026-02-13 | 13F | Natixis | 9.115 | 1.163 | ||||||
| 2026-02-17 | 13F | Quantinno Capital Management LP | 43.829 | 1,08 | 5.591 | -27,86 | ||||
| 2026-01-21 | 13F | Sound Income Strategies, LLC | 10 | -93,59 | 1 | -96,55 | ||||
| 2026-02-10 | 13F | Holderness Investments Co | 1.611 | 5,50 | 206 | -24,63 | ||||
| 2025-10-08 | 13F | Sheets Smith Investment Management | 8.032 | -0,57 | 1.436 | 11,15 | ||||
| 2026-02-17 | 13F | Alliancebernstein L.p. | 154.739 | -79,19 | 19.740 | -85,14 | ||||
| 2026-01-15 | 13F | Highline Wealth Partners Llc | 18 | -30,77 | 2 | -50,00 | ||||
| 2026-01-06 | 13F | Nelson, Van Denburg & Campbell Wealth Management Group, LLC | 0 | -100,00 | 0 | |||||
| 2026-02-12 | 13F | Campbell & CO Investment Adviser LLC | 26.321 | 1.390,43 | 3.358 | 965,71 | ||||
| 2026-01-30 | 13F | Trifecta Capital Advisors, LLC | 52 | 7 | ||||||
| 2026-02-17 | 13F | Orbis Allan Gray Ltd | 2.715.855 | -12,55 | 346.462 | -37,59 | ||||
| 2026-03-06 | 13F | Hsbc Holdings Plc | 1.952.568 | 2,47 | 249.165 | -26,87 | ||||
| 2026-02-12 | 13F | Brinker Capital Investments, LLC | 34.080 | -4,59 | 4.348 | -31,90 | ||||
| 2026-02-13 | 13F | Arrowstreet Capital, Limited Partnership | 4.492.860 | -35,49 | 573.154 | -53,96 | ||||
| 2025-09-26 | NP | DILAX - Davis International Fund Class A | 32.940 | 0,00 | 5.160 | 16,87 | ||||
| 2025-11-12 | 13F | 111 Capital | 0 | -100,00 | 0 | -100,00 | ||||
| 2026-02-17 | 13F | CoreView Capital Management Ltd | 855.519 | 16,19 | 109.139 | -17,07 | ||||
| 2026-02-13 | 13F | Laurion Capital Management LP | Put | 0 | -100,00 | 0 | ||||
| 2026-02-17 | 13F | Northern Trust Corp | 3.106.614 | 2,15 | 396.311 | -27,09 | ||||
| 2025-11-12 | 13F | HAP Trading, LLC | Call | 14.300 | 407 | |||||
| 2026-02-05 | 13F | HFM Investment Advisors, LLC | 28 | 4 | ||||||
| 2026-02-17 | 13F | Schonfeld Strategic Advisors LLC | 0 | -100,00 | 0 | |||||
| 2026-02-17 | 13F | Polar Capital Holdings Plc | 452.378 | -10,32 | 57.710 | -35,99 | ||||
| 2026-02-13 | 13F | Vontobel Holding Ltd. | Call | 7.000 | 893 | |||||
| 2026-02-13 | 13F | Vontobel Holding Ltd. | 89.999 | 131,53 | 11.481 | 65,27 | ||||
| 2026-02-11 | 13F | Capital Wealth Planning, LLC | 22.303 | -52,26 | 2.933 | -64,89 | ||||
| 2026-02-09 | 13F | Legal & General Group Plc | 1.911.121 | -10,21 | 243.802 | -35,91 | ||||
| 2026-01-12 | 13F | Salem Investment Counselors Inc | 0 | -100,00 | 0 | |||||
| 2026-01-28 | 13F | HB Wealth Management, LLC | 1.714 | 8,83 | 219 | -22,42 | ||||
| 2026-02-13 | 13F | Korea Investment CORP | 269.029 | -15,01 | 34.320 | -39,33 | ||||
| 2025-09-26 | NP | SPEDX - Alger Dynamic Opportunities Fund Class A | 18.695 | -50,93 | 2.929 | -42,66 | ||||
| 2025-11-14 | 13F | Third Point LLC | 0 | -100,00 | 0 | |||||
| 2026-01-14 | 13F | Spire Wealth Management | 126 | -95,44 | 16 | -96,75 | ||||
| 2026-02-10 | 13F | Cravens & Co Advisors, LLC | 3.965 | -1,81 | 515 | -28,71 | ||||
| 2026-02-17 | 13F | Susquehanna Advisors Group, Inc. | Call | 0 | -100,00 | 0 | ||||
| 2026-02-17 | 13F | General Equity Holdings LP | 114.568 | 171,17 | 14.615 | 93,55 | ||||
| 2026-02-18 | 13F | Vident Advisory, LLC | 65.772 | 94,79 | 8.391 | 39,05 | ||||
| 2025-11-14 | 13F | Cubist Systematic Strategies, LLC | Put | 165.500 | -6,34 | 29.580 | 4,66 | |||
| 2026-02-17 | 13F | Totem Point Management, LLC | 0 | -100,00 | 0 | |||||
| 2025-10-30 | 13F | Ridgewood Investments LLC | 0 | -100,00 | 0 | |||||
| 2025-09-17 | NP | NWHNX - Nationwide Bailard International Equities Fund Institutional Service Class | 14.000 | -6,67 | 2.193 | 9,10 | ||||
| 2025-11-14 | 13F | Cubist Systematic Strategies, LLC | Call | 91.900 | 15,02 | 16.425 | 28,53 | |||
| 2025-11-14 | 13F | Cubist Systematic Strategies, LLC | 78.320 | -74,45 | 13.998 | -71,45 | ||||
| 2025-09-24 | NP | ACWX - iShares MSCI ACWI ex U.S. ETF | 81.317 | 1,41 | 12.738 | 18,50 | ||||
| 2026-01-15 | 13F | Nikulski Financial, Inc. | 14.780 | 66,69 | 1.885 | 19,00 | ||||
| 2025-11-06 | 13F | Ground Swell Capital, LLC | 0 | -100,00 | 0 | |||||
| 2026-02-13 | 13F | Commerce Bank | 1.795 | -1,81 | 229 | -30,06 | ||||
| 2026-02-19 | 13F | CI Private Wealth, LLC | 11.444 | -14,63 | 1.460 | -39,08 | ||||
| 2026-02-13 | 13F | Van Eck Associates Corp | 56.346 | 213,19 | 7 | 133,33 | ||||
| 2026-02-10 | 13F | Sustainable Growth Advisers, LP | 760.360 | 96.999 | ||||||
| 2025-09-23 | NP | ARKF - ARK Fintech Innovation ETF | 162.502 | 1,23 | 25.456 | 18,29 | ||||
| 2026-02-11 | 13F | Axiom International Investors Llc /de | 62.300 | -93,59 | 7.948 | -95,42 | ||||
| 2025-09-26 | NP | SUNAMERICA SERIES TRUST - SA International Index Portfolio Class 1 | 19.855 | 7,24 | 3.110 | 25,35 | ||||
| 2026-02-17 | 13F | IHT Wealth Management, LLC | 1.681 | -21,15 | 214 | -43,83 | ||||
| 2026-02-17 | 13F | United Capital Financial Advisers, Llc | 2.458 | -4,17 | 314 | -31,66 | ||||
| 2025-11-14 | 13F | Dorsal Capital Management, LLC | Call | 0 | -100,00 | 0 | -100,00 | |||
| 2026-02-17 | 13F | Foxhaven Asset Management, LP | 996.430 | 26,08 | 127.115 | -10,01 | ||||
| 2026-02-12 | 13F | DRW Securities, LLC | 2.232 | -78,88 | 285 | -84,96 | ||||
| 2026-01-20 | 13F | Cromwell Holdings LLC | 983 | -5,48 | 125 | -32,43 | ||||
| 2026-01-16 | 13F | Legacy Capital Wealth Partners, LLC | 2.705 | -7,20 | 345 | -33,65 | ||||
| 2026-01-20 | 13F | SOA Wealth Advisors, LLC. | 1.425 | 1,79 | 182 | -27,60 | ||||
| 2026-02-13 | 13F | First Trust Advisors Lp | 39.368 | 31,65 | 5.022 | -6,03 | ||||
| 2026-01-29 | 13F | Concord Wealth Partners | 1 | -99,79 | 0 | -100,00 | ||||
| 2026-02-13 | 13F | Blue Grotto Capital, LLC | 510.000 | 41,01 | 65.061 | 0,65 | ||||
| 2026-01-05 | 13F | Park Avenue Securities Llc | 19.158 | -7,05 | 2 | -33,33 | ||||
| 2026-02-17 | 13F | Tiger Pacific Capital LP | 828.410 | 80,57 | 105.680 | 28,89 | ||||
| 2026-02-11 | 13F | Harvest Fund Management Co., Ltd | 0 | -100,00 | 0 | |||||
| 2025-11-06 | 13F | Blume Capital Management, Inc. | 0 | -100,00 | 0 | |||||
| 2026-02-09 | 13F | IPG Investment Advisors LLC | 3.025 | 0,00 | 386 | -28,70 | ||||
| 2025-11-13 | 13F | Glenmede Investment Management, LP | 26.717 | 14,07 | 4.775 | 27,47 | ||||
| 2026-02-17 | 13F | California State Teachers Retirement System | 426.686 | -3,52 | 54.432 | -31,14 | ||||
| 2026-02-11 | 13F | Vise Technologies, Inc. | 3.921 | -61,72 | 500 | -72,68 | ||||
| 2026-02-13 | 13F | Lord, Abbett & Co. Llc | 397.654 | -52,28 | 51 | -66,22 | ||||
| 2026-02-17 | 13F | MIRAE ASSET GLOBAL ETFS HOLDINGS Ltd. | 48.355 | 0,05 | 6.170 | -28,64 | ||||
| 2026-01-13 | 13F | Roberts Wealth Advisors, LLC | 41.033 | 64,36 | 5.235 | 17,30 | ||||
| 2026-02-13 | 13F | Squarepoint Ops LLC | Call | 245.000 | -29,46 | 31.255 | -49,65 | |||
| 2026-02-13 | 13F | Squarepoint Ops LLC | Put | 159.400 | -41,18 | 20.335 | -58,02 | |||
| 2026-02-17 | 13F | Artisan Partners Limited Partnership | 4.856.734 | -3,85 | 619.574 | -31,37 | ||||
| 2026-03-09 | 13F | Corecam Pte. Ltd. | 0 | -100,00 | 0 | |||||
| 2026-02-09 | 13F | Mediolanum International Funds Ltd | 75.729 | 3,96 | 9.720 | -26,47 | ||||
| 2026-02-09 | 13F | Jefferies Financial Group Inc. | 10.344 | 0,06 | 1.320 | -28,59 | ||||
| 2026-02-13 | 13F | Charles-Lim Capital Ltd | 750.000 | 172,73 | 95.678 | 94,66 | ||||
| 2026-01-29 | 13F | Kestra Private Wealth Services, Llc | 0 | -100,00 | 0 | -100,00 | ||||
| 2026-02-13 | 13F | QVT Financial LP | 2.811 | 360 | ||||||
| 2026-02-03 | 13F | Indivisible Partners | 5.455 | 696 | ||||||
| 2026-02-17 | 13F | XTX Topco Ltd | 23.756 | 202,16 | 3.031 | 115,66 | ||||
| 2026-02-04 | 13F | Twin Lakes Capital Management, LLC | 20 | 0,00 | 3 | -33,33 | ||||
| 2026-02-11 | 13F | Ramirez Asset Management, Inc. | 27.904 | 3.560 | ||||||
| 2026-02-03 | 13F | Geneva Partners, LLC | 0 | -100,00 | 0 | -100,00 | ||||
| 2026-02-13 | 13F | Arkadios Wealth Advisors | 3.221 | 11,11 | 411 | -20,85 | ||||
| 2025-09-25 | NP | HOLA - JPMorgan International Hedged Equity Laddered Overlay ETF | 6.668 | 1.045 | ||||||
| 2025-09-25 | NP | EMGAX - Wells Fargo Emerging Markets Equity Fund Class A | 225.740 | -15,05 | 35.362 | -0,73 | ||||
| 2026-01-08 | 13F | Nordea Investment Management Ab | 582.435 | 58,11 | 74.022 | 13,11 | ||||
| 2026-02-10 | 13F | Bbr Partners, Llc | 0 | -100,00 | 0 | |||||
| 2025-09-24 | NP | BlackRock ETF Trust - BlackRock World ex U.S. Carbon Transition Readiness ETF This fund is a listed as child fund of BlackRock, Inc. and if that institution has disclosed ownership in this security, then these positions will not be double counted when calculating total shares and total value | 2.547 | 6,48 | 399 | 24,38 | ||||
| 2026-02-17 | 13F/A | RBF Capital, LLC | 3.000 | 0,00 | 383 | -28,73 | ||||
| 2026-02-23 | 13F | Virtu Financial LLC | 0 | -100,00 | 0 | |||||
| 2026-02-17 | 13F | Warren Averett Asset Management, LLC | 1.980 | 253 | ||||||
| 2026-02-04 | 13F | HighPoint Advisor Group LLC | 2.163 | 44,10 | 276 | 2,61 | ||||
| 2026-01-26 | 13F | PDS Planning, Inc | 0 | -100,00 | 0 | -100,00 | ||||
| 2026-02-24 | 13F | DGS Capital Management, LLC | 1.690 | -14,60 | 216 | -39,09 | ||||
| 2025-11-13 | 13F | Riggs Asset Managment Co. Inc. | 0 | -100,00 | 0 | |||||
| 2025-09-25 | NP | WELLS FARGO MASTER TRUST - Wells Fargo International Growth Portfolio International Growth Portfolio | 3.548 | -2,61 | 556 | 13,73 | ||||
| 2026-01-29 | 13F | Rakuten Securities, Inc. | 771 | 147,91 | 98 | 78,18 | ||||
| 2026-02-06 | 13F | Fortis Group Advisors, LLC | 11.140 | 1.298 | ||||||
| 2026-02-17 | 13F | Watershed Asset Management, L.L.C. | 19.480 | -34,19 | 2.485 | 107,43 | ||||
| 2026-02-11 | 13F | BIT Capital GmbH | 9.768 | 36,58 | 1.246 | -2,50 | ||||
| 2025-09-26 | NP | RINYX - International Developed Markets Fund Class Y | 47.991 | 7.518 | ||||||
| 2026-02-14 | 13F | Militia Capital Partners, LP | 21.400 | 2.730 | ||||||
| 2026-02-17 | 13F | SummitTX Capital, L.P. | 3.289 | 420 | ||||||
| 2025-09-29 | NP | CAGEX - Calamos Global Equity Fund Class A | 6.450 | 6,17 | 1.010 | 10,62 | ||||
| 2026-02-10 | 13F | Bnp Paribas Arbitrage, Sa | 1.847.904 | -13,55 | 235.737 | -38,30 | ||||
| 2026-02-11 | 13F | OneAscent Financial Services LLC | 0 | -100,00 | 0 | -100,00 | ||||
| 2026-02-12 | 13F | BlackRock, Inc. | 20.364.587 | -1,25 | 2.597.910 | -29,51 | ||||
| 2026-02-10 | 13F | Bnp Paribas Arbitrage, Sa | Call | 76 | -51,28 | 970 | -65,24 | |||
| 2026-02-13 | 13F | Dai-Ichi Life Insurance Company, Ltd | 16.461 | -71,45 | 2.100 | -79,63 | ||||
| 2026-02-13 | 13F | Caitong International Asset Management Co., Ltd | 111 | 2.120,00 | 14 | |||||
| 2026-01-28 | 13F | Paradice Investment Management LLC | 0 | -100,00 | 0 | |||||
| 2026-02-04 | 13F | Aubrey Capital Management Ltd | 0 | -100,00 | 0 | |||||
| 2026-02-09 | 13F | Morningstar Investment Management LLC | 0 | -100,00 | 0 | |||||
| 2026-01-12 | 13F | Roble, Belko & Company, Inc | 1 | 0,00 | 0 | |||||
| 2026-01-14 | 13F | Eastern Bank | 1 | 0 | ||||||
| 2026-01-29 | 13F | Veracity Capital LLC | 1.902 | 0,85 | 243 | -28,19 | ||||
| 2026-02-11 | 13F | Prudential Plc | 2.111.252 | 1,11 | 269.332 | -27,83 | ||||
| 2026-02-06 | 13F | Larson Financial Group LLC | 2.125 | 63,46 | 271 | 16,81 | ||||
| 2026-02-17 | 13F | Whale Rock Capital Management LLC | 0 | -100,00 | 0 | |||||
| 2026-02-17 | 13F | Cetera Investment Advisers | 81.537 | 6,52 | 10.402 | -23,97 | ||||
| 2026-02-05 | 13F | AustralianSuper Pty Ltd | 19.028 | 0,00 | 2.427 | -28,62 | ||||
| 2025-09-29 | NP | AWGIX - CIBC ATLAS ALL CAP GROWTH FUND Institutional Class Shares | 22.347 | 3.501 | ||||||
| 2026-02-17 | 13F | Oaktree Capital Management Lp | 0 | -100,00 | 0 | -100,00 | ||||
| 2026-02-13 | 13F | Maplelane Capital, Llc | Call | 555.000 | -7,50 | 70.240 | -34,50 | |||
| 2026-02-13 | 13F | Cornerstone Financial Management LLC | 20 | 3 | ||||||
| 2026-02-17 | 13F | Untitled Investments Lp | 129.522 | 21,69 | 16.523 | -13,14 | ||||
| 2025-10-30 | 13F | Traub Capital Management LLC | 0 | -100,00 | 0 | -100,00 | ||||
| 2026-02-13 | 13F | Maplelane Capital, Llc | 634.000 | 52,04 | 80.879 | 8,52 | ||||
| 2026-02-17 | 13F | Ravenswood Partners LP | 106.883 | 0,86 | 13.635 | -28,01 | ||||
| 2025-09-29 | NP | CRLSX - CATHOLIC RESPONSIBLE INVESTMENTS INTERNATIONAL EQUITY FUND Institutional Shares | 216.217 | 0,00 | 33.870 | 16,86 | ||||
| 2026-01-26 | 13F | Quadrant Private Wealth Management, LLC | 5.849 | 8,80 | 746 | -22,29 | ||||
| 2026-02-13 | 13F | Sands Capital Management, Llc | 5.501.013 | 12,65 | 701.764 | -19,59 | ||||
| 2026-02-17 | 13F | Vinva Investment Management Ltd | 370.365 | 81,58 | 47.667 | 27,83 | ||||
| 2026-01-26 | 13F | Provenance Wealth Advisors, LLC | 18 | 0,00 | 2 | -33,33 | ||||
| 2026-02-10 | 13F | Eurizon Capital SGR S.p.A. | 113.910 | 14.536 | ||||||
| 2026-02-12 | 13F | Steward Partners Investment Advisory, Llc | 1.016 | -4,69 | 130 | -32,11 | ||||
| 2026-02-13 | 13F | Ieq Capital, Llc | 63.008 | -0,96 | 8.038 | -29,31 | ||||
| 2026-02-17 | 13F | Aquatic Capital Management LLC | 0 | -100,00 | 0 | |||||
| 2026-02-11 | 13F | Loup Funds, LLC | 12.219 | 1.559 | ||||||
| 2025-09-26 | NP | DAACX - Diversified Equity Fund | 520 | 4,00 | 81 | 35,00 | ||||
| 2026-01-28 | 13F | WPG Advisers, LLC | 2.808 | -6,56 | 358 | -33,33 | ||||
| 2026-02-11 | 13F | MCF Advisors LLC | 2.059 | 263 | ||||||
| 2026-02-12 | 13F | Advisors Asset Management, Inc. | 2.710 | 33,37 | 346 | -4,96 | ||||
| 2026-01-13 | 13F | Dakota Wealth Management | 0 | -100,00 | 0 | |||||
| 2026-02-03 | 13F | NewEdge Wealth, LLC | 11.102 | 21,19 | 1.416 | -2,01 | ||||
| 2026-02-06 | 13F | Creative Financial Designs Inc /adv | 74 | 0,00 | 9 | -30,77 | ||||
| 2026-02-12 | 13F | Skandinaviska Enskilda Banken AB (publ) | 104.113 | 8,92 | 13.282 | -22,26 | ||||
| 2026-02-03 | 13F | Washington Trust Advisors, Inc. | 0 | -100,00 | 0 | |||||
| 2026-02-11 | 13F | Fjarde Ap-fonden /fourth Swedish National Pension Fund | 83.473 | 10.649 | ||||||
| 2026-01-06 | 13F | Leibman Financial Services, Inc. | 12.962 | 89,50 | 1.654 | 35,27 | ||||
| 2026-02-09 | 13F | William Blair Investment Management, Llc | 2.370.876 | -31,55 | 302.415 | -51,15 | ||||
| 2026-02-17 | 13F | Capitolis Liquid Global Markets LLC | 673.970 | 85.978 | ||||||
| 2025-11-14 | 13F | Binnacle Investments Inc | 408 | 15,25 | 73 | 28,57 | ||||
| 2026-02-12 | 13F | Barings Llc | 223.923 | 6,94 | 28.566 | -23,67 | ||||
| 2026-02-13 | 13F | Infusive Asset Management Inc. | 40.963 | 32,50 | 5.226 | -5,43 | ||||
| 2026-02-17 | 13F | Delaware Management Holdings, Inc. | 657.728 | 83.906 | ||||||
| 2026-02-17 | 13F | Summit Trail Advisors, Llc | 0 | -100,00 | 0 | -100,00 | ||||
| 2026-01-21 | 13F/A | Winthrop Advisory Group LLC | 0 | -100,00 | 0 | |||||
| 2026-02-10 | 13F | Clear Harbor Asset Management, LLC | 3.969 | -1,68 | 506 | -29,82 | ||||
| 2026-02-13 | 13F | Resources Investment Advisors, LLC. | 12.321 | -11,39 | 1.572 | -36,78 | ||||
| 2026-01-27 | 13F | Regions Financial Corp | 4.787 | -48,73 | 611 | -63,43 | ||||
| 2025-09-25 | NP | NEWFX - NEW WORLD FUND INC Class A | 640.012 | -2,61 | 100.258 | 13,81 | ||||
| 2025-09-26 | NP | FSGGX - Fidelity Global ex U.S. Index Fund This fund is a listed as child fund of Fmr Llc and if that institution has disclosed ownership in this security, then these positions will not be double counted when calculating total shares and total value | 166.658 | 10,95 | 26.107 | 29,66 | ||||
| 2026-02-17 | 13F | Tcw Group Inc | 5.986 | 764 | ||||||
| 2026-02-13 | 13F | Polymer Capital Management (HK) LTD | 15.463 | 7,53 | 1.973 | -23,27 | ||||
| 2026-02-17 | 13F | RMB Capital Management, LLC | 0 | -100,00 | 0 | |||||
| 2026-02-03 | 13F | Denali Advisors Llc | 0 | -100,00 | 0 | |||||
| 2026-01-20 | 13F | Analyst IMS Investment Management Services Ltd. | 8.331 | 0,00 | 1 | 0,00 | ||||
| 2026-02-17 | 13F | EFG International AG | 28.936 | 3.690 | ||||||
| 2025-09-26 | NP | ZABDFX - American Beacon Diversified Fund AAL Class | 17.600 | -5,38 | 2.757 | 10,59 | ||||
| 2026-01-28 | 13F/A | Capelight Capital Asset Management LP | 20.000 | 2.551 | ||||||
| 2026-02-17 | 13F | Greenland Capital Management LP | 15.691 | 2.002 | ||||||
| 2025-09-24 | NP | SFILX - Schwab Fundamental International Small Company Index Fund Institutional Shares | 7.055 | -8,90 | 1.105 | 6,45 | ||||
| 2026-01-12 | 13F | Contravisory Investment Management, Inc. | 1.793 | 2,05 | 229 | -27,39 | ||||
| 2025-11-14 | 13F | Squarepoint Ops LLC | 0 | -100,00 | 0 | -100,00 | ||||
| 2026-02-17 | 13F | Qube Research & Technologies Ltd | Put | 39.200 | 51,35 | 5.001 | 8,01 | |||
| 2026-02-11 | 13F | LPL Financial LLC | Put | 3.000 | -40,00 | 383 | -57,22 | |||
| 2025-11-13 | 13F | Wells Fargo & Company/mn | Call | 0 | -100,00 | 0 | -100,00 | |||
| 2026-01-15 | 13F | Retirement Systems of Alabama | 118.805 | 0,00 | 15.156 | -28,63 | ||||
| 2026-01-29 | 13F | Matthews International Capital Management Llc | 179.241 | -15,94 | 22.866 | -40,00 | ||||
| 2026-02-13 | 13F | Candriam Luxembourg S.C.A. | 1.863 | -93,35 | 238 | -95,26 | ||||
| 2026-02-13 | 13F | Alcosta Capital Management, Inc. | 0 | -100,00 | 0 | |||||
| 2026-02-11 | 13F | Simplex Trading, Llc | Put | 199.000 | -31,19 | 25.386 | 49.676,47 | |||
| 2026-02-12 | 13F | M&G Plc | 0 | -100,00 | 0 | |||||
| 2026-02-17 | 13F | Mane Global Capital Management Lp | 217.494 | 5,87 | 27.746 | -24,44 | ||||
| 2026-02-02 | 13F | Equitable Trust Co | 143.306 | 2,55 | 18.282 | -26,81 | ||||
| 2026-02-11 | 13F | LPL Financial LLC | 376.463 | 2,45 | 48.025 | -26,88 | ||||
| 2025-11-13 | 13F | Wells Fargo & Company/mn | Put | 0 | -100,00 | 0 | -100,00 | |||
| 2026-02-17 | 13F | Qube Research & Technologies Ltd | Call | 79.800 | 65,22 | 10.180 | 17,93 | |||
| 2026-02-17 | 13F | Qube Research & Technologies Ltd | 411.802 | 22,19 | 52.534 | -12,79 | ||||
| 2026-02-11 | 13F | Simplex Trading, Llc | 28.880 | 3.684 | ||||||
| 2026-01-26 | 13F | Roman Butler Fullerton & Co | 0 | -100,00 | 0 | |||||
| 2026-02-11 | 13F | Simplex Trading, Llc | Call | 342.400 | -3,30 | 43.680 | 69.231,75 | |||
| 2026-02-12 | 13F | Hohimer Wealth Management, Llc | 0 | -100,00 | 0 | |||||
| 2026-02-17 | 13F | Advisory Services Network, LLC | 3.609 | 7,09 | 460 | -23,59 | ||||
| 2026-01-14 | 13F | Tradewinds Capital Management, LLC | 200 | 0,00 | 26 | -28,57 | ||||
| 2026-02-02 | 13F | Oppenheimer & Co Inc | 0 | -100,00 | 0 | |||||
| 2026-03-09 | 13F | EMC Capital Management | 165 | 0,00 | 0 | |||||
| 2026-01-14 | 13F | Petros Family Wealth, LLC | 0 | -100,00 | 0 | |||||
| 2026-01-29 | 13F | China Universal Asset Management Co., Ltd. | 21.100 | -13,52 | 2.692 | -38,29 | ||||
| 2026-02-10 | 13F | Acadian Asset Management Llc | 52.197 | -97,89 | 7 | -98,64 | ||||
| 2025-09-26 | NP | DRFAX - Davis Research Fund Class A | 6.490 | 0,00 | 1.017 | 16,92 | ||||
| 2026-02-17 | 13F | Infinitum Asset Management, Llc | 1.006.500 | 98,10 | 128.399 | 41,39 | ||||
| 2026-01-14 | 13F | Generate Investment Management Ltd | 37.935 | 4.839 | ||||||
| 2026-02-11 | 13F | Kontiki Capital Management (HK) Ltd. | 1.359.992 | -29,68 | 173.494 | -49,81 | ||||
| 2026-02-12 | 13F | Summit Financial, LLC | 4.587 | -10,09 | 585 | -35,78 | ||||
| 2026-02-17 | 13F | HighVista Strategies LLC | 7.450 | 44,91 | 950 | 3,49 | ||||
| 2025-09-29 | NP | Calamos Global Dynamic Income Fund | 22.885 | 44,89 | 3.585 | 69,30 | ||||
| 2026-02-02 | 13F | Qrg Capital Management, Inc. | 20.437 | -9,28 | 2.607 | -35,25 | ||||
| 2025-11-12 | 13F | Transce3nd, LLC | 0 | -100,00 | 0 | -100,00 | ||||
| 2026-02-12 | 13F | Cloud Capital Management, LLC | 2.005 | 7,97 | 0 | |||||
| 2026-02-13 | 13F | Itau Unibanco Holding S.A. | 2.326 | -59,46 | 297 | -71,12 | ||||
| 2026-02-06 | 13F | IFP Advisors, Inc | 3.848 | -1,11 | 491 | -29,50 | ||||
| 2026-02-17 | 13F | Titan Wealth (CI) Ltd | 2.815 | 359 | ||||||
| 2026-01-12 | 13F | Canvas Wealth Advisors, LLC | 4.931 | -3,80 | 629 | -33,58 | ||||
| 2026-02-03 | 13F | RFG Advisory, LLC | 0 | -100,00 | 0 | |||||
| 2026-02-04 | 13F | Asahi Life Asset Management Co., Ltd. | 0 | -100,00 | 0 | |||||
| 2025-09-24 | NP | CRBN - iShares MSCI ACWI Low Carbon Target ETF | 2.355 | 102,84 | 369 | 137,42 | ||||
| 2026-01-20 | 13F | Princeton Global Asset Management LLC | 67 | 0,00 | 9 | -27,27 | ||||
| 2026-02-12 | 13F | Loomis Sayles & Co L P | 1.211 | 17,46 | 154 | -16,30 | ||||
| 2026-01-13 | 13F | Granite Group Advisors, LLC | 3.431 | -6,44 | 438 | -33,28 | ||||
| 2025-10-27 | 13F | N.E.W. Advisory Services LLC | 0 | -100,00 | 0 | |||||
| 2026-02-17 | 13F | Royal Bank Of Canada | Put | 20.000 | -86,67 | 2.551 | -90,48 | |||
| 2026-01-15 | 13F | Burns Matteson Capital Management, LLC | 2.081 | 9,07 | 265 | -22,29 | ||||
| 2026-02-17 | 13F | Royal Bank Of Canada | 528.535 | -50,57 | 67.426 | -64,72 | ||||
| 2026-01-20 | 13F | Myriad Asset Management US LP | 4.943 | -70,28 | 631 | -78,80 | ||||
| 2026-01-20 | 13F | Perpetual Ltd | 1.095.702 | -7,34 | 139.779 | -33,87 | ||||
| 2026-02-12 | 13F | Penserra Capital Management LLC | 23.122 | 16,23 | 3 | -33,33 | ||||
| 2026-02-13 | 13F | Victory Capital Management Inc | 60.106 | -32,04 | 7.668 | -51,50 | ||||
| 2025-09-25 | NP | AMTAX - AB All Market Real Return Portfolio Class A | 0 | -100,00 | 0 | -100,00 | ||||
| 2026-02-17 | 13F | Citadel Advisors Llc | Put | 1.067.800 | -20,86 | 136.219 | -43,52 | |||
| 2026-02-17 | 13F | Citadel Advisors Llc | Call | 1.842.200 | -38,69 | 235.009 | -56,24 | |||
| 2025-11-20 | 13F | Maven Securities LTD | Put | 0 | -100,00 | 0 | -100,00 | |||
| 2025-09-26 | NP | RMYAX - Multi-Strategy Income Fund Class A | 2.933 | 46,43 | 459 | 71,27 | ||||
| 2026-02-12 | 13F | Groupe la Francaise | 0 | -100,00 | 0 | |||||
| 2026-02-13 | 13F | MayTech Global Investments, LLC | 123.418 | 15.745 | ||||||
| 2026-02-17 | 13F | Old Mission Capital Llc | 22.337 | 2.850 | ||||||
| 2026-02-17 | 13F | Citadel Advisors Llc | 859.075 | 42,30 | 109.592 | 1,56 | ||||
| 2025-11-14 | 13F | Bwcp, Lp | 0 | -100,00 | 0 | |||||
| 2026-02-13 | 13F | Golden State Wealth Management, LLC | 29 | 480,00 | 4 | |||||
| 2026-02-05 | 13F | iA Global Asset Management Inc. | 39.810 | -51,73 | 5 | -64,29 | ||||
| 2026-02-13 | 13F | Peak6 Llc | Put | 120.500 | -85,00 | 15.372 | -89,30 | |||
| 2026-02-13 | 13F | Peak6 Llc | 43.310 | 5.525 | ||||||
| 2026-02-13 | 13F | Peak6 Llc | Call | 32.800 | -90,92 | 4.184 | -93,52 | |||
| 2025-11-14 | 13F | KADENSA CAPITAL Ltd | 0 | -100,00 | 0 | -100,00 | ||||
| 2026-02-02 | 13F | Wolverine Asset Management Llc | Put | 170.000 | -46,54 | 21.687 | -61,84 | |||
| 2026-02-13 | 13F | NLB Skladi, upravljanje premozenja, d.o.o. | 6.674 | 851 | ||||||
| 2025-09-26 | NP | FWWFX - Fidelity Worldwide Fund This fund is a listed as child fund of Fmr Llc and if that institution has disclosed ownership in this security, then these positions will not be double counted when calculating total shares and total value | 16.000 | -27,27 | 2.506 | -6,46 | ||||
| 2026-02-12 | 13F | Polen Capital Management Llc | 42.710 | -39,19 | 5.449 | -56,60 | ||||
| 2026-02-17 | 13F | Metavasi Capital LP | 35.000 | 4.465 | ||||||
| 2026-02-12 | 13F | EntryPoint Capital, LLC | 1.918 | 0,00 | 245 | -28,65 | ||||
| 2025-11-14 | 13F | Wetherby Asset Management Inc | 6.266 | 0,58 | 1.120 | 12,35 | ||||
| 2026-02-12 | 13F | CIBC Private Wealth Group, LLC | 5.275 | -99,18 | 673 | -99,41 | ||||
| 2026-02-17 | 13F | Bulltick Wealth Management, LLC | 30.829 | 0,03 | 3.933 | -28,61 | ||||
| 2025-11-14 | 13F | Amundi | 0 | -100,00 | 0 | -100,00 | ||||
| 2025-09-24 | NP | SWMIX - Laudus International MarketMasters Fund Select Shares | 36.449 | 21,50 | 5.710 | 41,98 | ||||
| 2026-01-23 | 13F | Stanley-Laman Group, Ltd. | 5.000 | 638 | ||||||
| 2026-01-23 | 13F | Bridgewater Advisors Inc. | 0 | -100,00 | 0 | -100,00 | ||||
| 2026-02-12 | 13F | Intesa Sanpaolo Wealth Management | 0 | 0 | ||||||
| 2026-02-17 | 13F | GAM Holding AG | 5.327 | -35,41 | 680 | -53,93 | ||||
| 2026-02-04 | 13F | Dogwood Wealth Management LLC | 55 | 0,00 | 7 | -22,22 | ||||
| 2026-02-10 | 13F | WCG Wealth Advisors LLC | 53.058 | 6.769 | ||||||
| 2025-09-22 | NP | GSEQX - Goldman Sachs Multi-Manager Global Equity Fund Class R6 Shares | 36.738 | 1,72 | 5.755 | 18,88 | ||||
| 2026-02-13 | 13F | Panagora Asset Management Inc | 13.761 | -92,91 | 1.755 | -94,94 | ||||
| 2026-01-09 | 13F | Diversified Trust Co | 1.886 | -85,02 | 241 | -89,33 | ||||
| 2026-02-17 | 13F | Raymond James Financial Inc | 223.702 | -26,28 | 28.538 | -47,38 | ||||
| 2026-02-13 | 13F | National Bank Of Canada /fi/ | 1.157.200 | 97,03 | 147.623 | 40,64 | ||||
| 2025-09-29 | NP | EMWLX - Lord Abbett Emerging Markets Equity Fund Class R6 | 423 | 14,02 | 66 | 34,69 | ||||
| 2026-01-29 | 13F | Dunhill Financial, LLC | 231 | 151,09 | 13 | -25,00 | ||||
| 2026-03-04 | 13F | Rehmann Capital Advisory Group | 1.884 | 3,69 | 241 | -25,62 | ||||
| 2025-11-03 | 13F | Townsquare Capital Llc | 0 | -100,00 | 0 | |||||
| 2026-02-17 | 13F | D1 Capital Partners L.P. | 3.485.043 | 169,61 | 444.587 | 92,43 | ||||
| 2026-02-06 | 13F | Addison Advisors LLC | 15 | 0,00 | 2 | -50,00 | ||||
| 2025-11-12 | 13F | BOCHK Asset Management Ltd | 0 | -100,00 | 0 | -100,00 | ||||
| 2026-02-06 | 13F | HighTower Advisors, LLC | 50.450 | -9,42 | 6.436 | -35,35 | ||||
| 2026-02-13 | 13F | Wells Fargo & Company/mn | 404.098 | -1,88 | 51.551 | -29,97 | ||||
| 2026-02-17 | 13F | Ameriprise Financial Inc | 1.472.103 | 71,79 | 187.020 | 22,10 | ||||
| 2025-11-12 | 13F | CIBC Bancorp USA Inc. | 639.461 | 114.291 | ||||||
| 2026-02-12 | 13F | Renaissance Technologies Llc | 1.153.800 | 66,57 | 147.190 | 18,89 | ||||
| 2026-02-17 | 13F | SIH Partners, LLLP | 0 | -100,00 | 0 | |||||
| 2025-09-26 | NP | FTIHX - Fidelity Total International Index Fund This fund is a listed as child fund of Fmr Llc and if that institution has disclosed ownership in this security, then these positions will not be double counted when calculating total shares and total value | 178.193 | 9,39 | 27.914 | 27,84 | ||||
| 2026-02-17 | 13F | Sherman Porfolios, Llc | 75.475 | 9.628 | ||||||
| 2025-09-26 | NP | DGFAX - Davis Global Fund Class A | 55.410 | -28,90 | 8.680 | -16,92 | ||||
| 2026-02-20 | 13F | Kovitz Investment Group Partners, LLC | 0 | -100,00 | 0 | |||||
| 2026-02-09 | 13F | Wcm Investment Management, Llc | 25.862.514 | -0,73 | 3.319.454 | -29,78 | ||||
| 2026-01-09 | 13F | Assenagon Asset Management S.A. | 7.457 | 8,43 | 951 | -22,62 | ||||
| 2026-02-10 | 13F | Catalyst Capital Advisors LLC | 0 | -100,00 | 0 | |||||
| 2025-09-26 | NP | BKIE - BNY Mellon International Equity ETF | 15.431 | 42,31 | 2.417 | 66,35 | ||||
| 2026-02-13 | 13F | Verition Fund Management LLC | Call | 4.000 | -90,41 | 510 | -93,16 | |||
| 2026-02-13 | 13F | Verition Fund Management LLC | 18.663 | -61,05 | 2.381 | -72,21 | ||||
| 2025-09-26 | NP | ATVPX - Alger 35 Fund Class P | 9.046 | -7,33 | 1.417 | 8,33 | ||||
| 2026-02-13 | 13F | Verition Fund Management LLC | Put | 1.900 | -97,27 | 242 | -98,05 | |||
| 2026-01-27 | 13F | TD Waterhouse Canada Inc. | 2.058 | -84,42 | 262 | -89,10 | ||||
| 2026-02-18 | 13F | EP Wealth Advisors, Inc. | 3.758 | 479 | ||||||
| 2026-02-18 | 13F | GWM Advisors LLC | 11.700 | 8,03 | 1.493 | -22,89 | ||||
| 2026-02-19 | 13F | Mcguire Capital Advisors Inc | 101 | 13 | ||||||
| 2025-11-13 | 13F | Long Corridor Asset Management Ltd | 0 | -100,00 | 0 | |||||
| 2026-02-17 | 13F | Advisor Group Holdings, Inc. | Call | 2 | 0,00 | 4 | -77,78 | |||
| 2026-01-28 | 13F | Klp Kapitalforvaltning As | 139.100 | 1,31 | 17.745 | -27,69 | ||||
| 2026-02-17 | 13F | Two Sigma Investments, Lp | Call | 8.900 | 1.135 | |||||
| 2026-02-17 | 13F | Limestone Investment Advisors LP | 7.000 | 893 | ||||||
| 2026-01-21 | 13F | Portside Wealth Group, LLC | 6.832 | -1,70 | 872 | -29,87 | ||||
| 2026-02-17 | 13F | Two Sigma Investments, Lp | 1.710.686 | 38,86 | 218.232 | -0,89 | ||||
| 2026-01-28 | 13F | Geneos Wealth Management Inc. | 11 | -91,85 | 1 | -95,83 | ||||
| 2026-02-17 | 13F | Two Sigma Investments, Lp | Put | 8.000 | 1.021 | |||||
| 2026-02-12 | 13F | Mount Yale Investment Advisors, LLC | 1.938 | 25,36 | 247 | -10,51 | ||||
| 2026-01-20 | 13F | Independence Bank of Kentucky | 15 | 2 | ||||||
| 2026-02-13 | 13F | Oarsman Capital, Inc. | 2.124 | 88,97 | 271 | 35,00 | ||||
| 2026-02-06 | 13F | EverSource Wealth Advisors, LLC | 1.742 | -5,07 | 222 | -32,11 | ||||
| 2025-11-07 | 13F | Putney Financial Group LLC | 0 | -100,00 | 0 | -100,00 | ||||
| 2026-02-12 | 13F | Marsico Capital Management Llc | 0 | -100,00 | 0 | |||||
| 2026-01-23 | 13F | Wallace Advisory Group, LLC | 0 | -100,00 | 0 | |||||
| 2026-02-17 | 13F | Think Investments LP | 174.000 | 0,00 | 22.197 | -28,62 | ||||
| 2026-01-15 | 13F | Capital Advisors Inc/ok | 284.073 | 0,94 | 36.239 | -27,95 | ||||
| 2026-01-28 | 13F | Legacy Capital Group California, Inc. | 2.236 | 6,27 | 285 | -24,20 | ||||
| 2025-11-03 | 13F | AE Wealth Management LLC | 0 | -100,00 | 0 | |||||
| 2026-01-21 | 13F | DMG Group, LLC | 0 | -100,00 | 0 | |||||
| 2025-09-26 | NP | AFOIX - Alger Mid Cap Focus Fund Class I | 38.267 | -23,27 | 5.995 | -65,02 | ||||
| 2026-02-26 | 13F | TD Capital Management LLC | 109 | 1,87 | 14 | -31,58 | ||||
| 2026-02-10 | 13F | Bank of New York Mellon Corp | 670.542 | -2,22 | 85.541 | -30,21 | ||||
| 2026-02-18 | 13F | Sunstone Asset Management, L.P. | 6.614 | 844 | ||||||
| 2025-09-29 | NP | Calamos Global Total Return Fund | 6.125 | 37,80 | 959 | 61,18 | ||||
| 2026-01-16 | 13F | Banque Pictet & Cie Sa | 127.401 | -2,91 | 16.253 | -30,72 | ||||
| 2026-02-06 | 13F | Leonteq Securities AG | 27.278 | 496,63 | 3.480 | 325,83 | ||||
| 2025-09-26 | NP | FFDI - Fidelity Fundamental Developed International ETF | 303 | 0,00 | 47 | 17,50 | ||||
| 2026-02-13 | 13F | Dixon Mitchell Investment Counsel Inc. | 47.000 | 5.996 | ||||||
| 2026-02-17 | 13F | Woodline Partners LP | 7.049 | 899 | ||||||
| 2026-02-17 | 13F | Graham Capital Management, L.P. | 3.527 | -50,54 | 450 | -64,76 | ||||
| 2026-01-30 | 13F | Sage Rhino Capital Llc | 0 | -100,00 | 0 | -100,00 | ||||
| 2026-02-02 | 13F | Varma Mutual Pension Insurance Co | 44.000 | 7,32 | 5.613 | -23,39 | ||||
| 2026-02-09 | 13F | Coldstream Capital Management Inc | 6.176 | 6,50 | 788 | -24,03 | ||||
| 2026-01-30 | 13F | Interchange Capital Partners, LLC | 1.742 | 6,03 | 222 | -24,23 | ||||
| 2025-09-26 | NP | CNECX - Alger Concentrated Equity Fund Class C | 1.169 | -10,83 | 183 | 4,57 | ||||
| 2025-09-18 | NP | ABLG - TrimTabs All Cap International Free-Cash-Flow ETF | 4.995 | 782 | ||||||
| 2026-02-03 | 13F | Crossmark Global Holdings, Inc. | 19.561 | 19,15 | 2.495 | -14,96 | ||||
| 2026-02-12 | 13F | Jane Street Group, Llc | Call | 330.100 | -81,68 | 42.111 | -86,93 | |||
| 2026-02-12 | 13F | Jane Street Group, Llc | 4.083 | -78,22 | 521 | -84,48 | ||||
| 2026-02-17 | 13F | Steadfast Capital Management Lp | 286.801 | 36.587 | ||||||
| 2026-02-12 | 13F | Jane Street Group, Llc | Put | 525.100 | -67,88 | 66.987 | -77,07 | |||
| 2025-09-26 | NP | FITFX - Fidelity Flex International Index Fund This fund is a listed as child fund of Fmr Llc and if that institution has disclosed ownership in this security, then these positions will not be double counted when calculating total shares and total value | 36.057 | -5,30 | 5.648 | 10,66 | ||||
| 2026-02-03 | 13F | Privium Fund Management B.V. | 138.000 | -13,75 | 17.605 | -38,44 | ||||
| 2026-02-13 | 13F | Oasis Management Co Ltd. | 37.000 | 0,00 | 4.720 | -28,63 | ||||
| 2025-09-29 | NP | CNWGX - Calamos Evolving World Growth Fund Class A | 61.420 | 0,00 | 9.621 | 16,86 | ||||
| 2026-02-09 | 13F | Prairie Wealth Advisors, Inc. | 0 | -100,00 | 552 | -29,09 | ||||
| 2026-02-11 | 13F | Parallel Advisors, LLC | 5.571 | -6,98 | 711 | -33,64 | ||||
| 2026-02-17 | 13F | Zurich Insurance Group Ltd/FI | 262.717 | 0,90 | 33.515 | -27,98 | ||||
| 2026-02-17 | 13F | Liontrust Investment Partners LLP | 0 | -100,00 | 0 | |||||
| 2025-09-26 | NP | INVESCO ACTIVELY MANAGED EXCHANGE-TRADED FUND TRUST - Invesco MSCI EAFE Income Advantage ETF | 2.608 | 16,01 | 409 | 35,55 | ||||
| 2026-02-17 | 13F | Cardiff Park Advisors, Llc | 0 | -100,00 | 0 | |||||
| 2025-09-24 | NP | AAXJ - iShares MSCI All Country Asia ex Japan ETF | 134.808 | 4,21 | 21.118 | 21,78 | ||||
| 2025-09-26 | NP | TCIEX - TIAA-CREF International Equity Index Fund Institutional Class | 636.026 | 7,00 | 99.633 | 25,04 | ||||
| 2025-11-20 | 13F | Maven Securities LTD | Call | 0 | -100,00 | 0 | -100,00 | |||
| 2026-02-03 | 13F | Sequoia Financial Advisors, LLC | 5.400 | -7,01 | 689 | -33,65 | ||||
| 2025-11-12 | 13F | Duncan Williams Asset Management, LLC | 0 | -100,00 | 0 | -100,00 | ||||
| 2026-02-12 | 13F | BRYN MAWR TRUST Co | 447 | -59,58 | 57 | -71,07 | ||||
| 2025-11-12 | 13F | Headlands Technologies LLC | 0 | -100,00 | 0 | |||||
| 2025-09-25 | NP | TOUS - T. Rowe Price International Equity ETF | 26.810 | 17,35 | 4.200 | 37,13 | ||||
| 2025-09-24 | NP | TOK - iShares MSCI Kokusai ETF | 1.190 | 5,22 | 186 | 23,18 | ||||
| 2025-09-26 | NP | FIONX - Fidelity SAI International Index Fund This fund is a listed as child fund of Fmr Llc and if that institution has disclosed ownership in this security, then these positions will not be double counted when calculating total shares and total value | 151.370 | 2,59 | 23.712 | 19,88 | ||||
| 2026-02-17 | 13F | Hillhouse Capital Advisors, Ltd. | 0 | -100,00 | 0 | |||||
| 2025-09-25 | NP | JIG - JPMorgan International Growth ETF | 10.369 | 23,79 | 1.624 | 44,74 | ||||
| 2025-09-24 | NP | EFA - iShares MSCI EAFE ETF | 1.304.543 | 5,20 | 204.357 | 22,94 | ||||
| 2026-02-24 | 13F | Bell Investment Advisors, Inc | 43 | -10,42 | 5 | -37,50 | ||||
| 2026-02-10 | 13F | Rothschild Investment Llc | 106 | -46,73 | 14 | -62,86 | ||||
| 2026-02-12 | 13F | Quadrant Capital Group Llc | 13.998 | 0,94 | 1.786 | -27,97 | ||||
| 2026-02-12 | 13F | Long Walk Management Lp | 222.500 | -27,05 | 28.384 | -47,93 | ||||
| 2026-02-12 | 13F | StoneX Group Inc. | 3.120 | -8,69 | 398 | -34,75 | ||||
| 2026-01-30 | 13F | Archer Investment Corp | 27 | 0,00 | 3 | -25,00 | ||||
| 2026-02-06 | 13F | Copia Wealth Management | 30 | 4 | ||||||
| 2026-02-18 | 13F | Achmea Investment Management B.V. | 4.160 | 1 | ||||||
| 2026-01-30 | 13F | Jennison Associates Llc | 1.619.291 | -72,96 | 206.573 | -80,70 | ||||
| 2025-11-13 | 13F | Nemes Rush Group LLC | 0 | -100,00 | 0 | |||||
| 2026-02-12 | 13F | Sit Investment Associates Inc | 2.525 | 0,00 | 0 | |||||
| 2026-03-02 | 13F | Bank Of Hawaii | 7.109 | -22,11 | 907 | -44,45 | ||||
| 2026-02-17 | 13F | Private Advisor Group, LLC | 0 | -100,00 | 0 | |||||
| 2025-09-29 | NP | LGCAX - Lord Abbett Global Equity Research Fund Class A | 26.375 | 76,92 | 4.132 | 106,76 | ||||
| 2026-01-27 | 13F | Zurcher Kantonalbank (Zurich Cantonalbank) | 243.527 | 4,84 | 31.067 | -25,17 | ||||
| 2026-02-13 | 13F | Sterling Capital Management LLC | 2.328 | 297 | ||||||
| 2026-02-12 | 13F | New York State Common Retirement Fund | 139.163 | -69,48 | 17.753 | -78,22 | ||||
| 2026-01-30 | 13F | Wealthstar Advisors, Llc | 2.679 | -33,47 | 342 | -52,57 | ||||
| 2025-09-26 | NP | FEAAX - Fidelity Advisor Emerging Asia Fund Class A This fund is a listed as child fund of Fmr Llc and if that institution has disclosed ownership in this security, then these positions will not be double counted when calculating total shares and total value | 75.095 | -62,29 | 11.764 | -55,94 | ||||
| 2026-01-12 | 13F | Perkins Coie Trust Co | 0 | -100,00 | 0 | |||||
| 2026-02-10 | 13F | Channing Global Advisors, Llc | 39 | 25,81 | 5 | -20,00 | ||||
| 2026-02-06 | 13F | Envestnet Portfolio Solutions, Inc. | 20.578 | -2,64 | 2.625 | -30,50 | ||||
| 2026-02-12 | 13F | Lansforsakringar Fondforvaltning AB (publ) | 90.711 | 11.572 | ||||||
| 2026-02-17 | 13F | Susquehanna International Group, Llp | Call | 1.824.500 | -24,67 | 232.751 | -46,23 | |||
| 2026-02-04 | 13F | Swiss Life Asset Management Ltd | 29.316 | -17,66 | 3.740 | -41,24 | ||||
| 2026-01-27 | 13F | Bayforest Capital Ltd | 1.231 | -46,24 | 157 | -61,61 | ||||
| 2026-02-10 | 13F | Pasadena Private Wealth, LLC | 2.800 | 357 | ||||||
| 2026-01-23 | 13F | Ritholtz Wealth Management | 6.513 | 0,76 | 831 | -28,14 | ||||
| 2026-02-09 | 13F | Freemont Capital Pte Ltd | 0 | -100,00 | 0 | |||||
| 2026-02-05 | 13F | Td Private Client Wealth Llc | 626 | -59,97 | 80 | -71,68 | ||||
| 2026-02-17 | 13F | Susquehanna International Group, Llp | 527.561 | 145,69 | 67.301 | 75,37 | ||||
| 2026-02-06 | 13F | Motco | 30 | 0,00 | 4 | -40,00 | ||||
| 2026-02-17 | 13F | Susquehanna International Group, Llp | Put | 1.515.800 | -45,96 | 193.371 | -61,43 | |||
| 2026-01-22 | 13F | Personal Cfo Solutions, Llc | 15.363 | 3,13 | 1.960 | -26,41 | ||||
| 2026-02-17 | 13F | Signature Equity Partners, LLC | 35 | 4 | ||||||
| 2026-02-13 | 13F | Thornburg Investment Management Inc | 323.829 | 4,91 | 41.311 | -25,12 | ||||
| 2026-01-21 | 13F | Albion Financial Group /ut | 108 | 0,00 | 14 | -31,58 | ||||
| 2025-11-12 | 13F | Intellus Advisors LLC | 0 | -100,00 | 0 | |||||
| 2026-01-23 | 13F | Diversify Advisory Services, LLC | 6.204 | 14,70 | 753 | -11,52 | ||||
| 2026-02-17 | 13F | Nomura Holdings Inc | 24.864 | 166,84 | 3.172 | 90,45 | ||||
| 2026-02-10 | 13F | Eurizon SLJ Capital Ltd | 14.387 | 1.835 | ||||||
| 2026-02-11 | 13F | Picton Mahoney Asset Management | 9.100 | 1.161 | ||||||
| 2026-02-17 | 13F | Wiley Bros.-aintree Capital, Llc | 12.962 | -7,18 | 1.658 | -33,75 | ||||
| 2026-02-13 | 13F | Citigroup Inc | 2.284.427 | -7,23 | 291.424 | -33,78 | ||||
| 2026-02-13 | 13F | Citigroup Inc | Call | 20.000 | 2.551 | |||||
| 2026-01-08 | 13F | Wealth Enhancement Advisory Services, Llc | 9.921 | 8,01 | 1.418 | -19,21 | ||||
| 2026-02-13 | 13F | Prudential Financial Inc | 92.701 | -66,24 | 11.826 | -75,91 | ||||
| 2025-09-25 | NP | JIRE - JPMorgan International Research Enhanced Equity ETF | 225.619 | 28,30 | 35.343 | 49,94 | ||||
| 2026-02-11 | 13F | Vestcor Inc | 5.399 | -9,79 | 1 | -100,00 | ||||
| 2026-02-17 | 13F | Parallax Volatility Advisers, L.P. | Call | 100 | 0,00 | 13 | -29,41 | |||
| 2026-02-17 | 13F | Parallax Volatility Advisers, L.P. | Put | 252.500 | -6,48 | 32.211 | -33,25 | |||
| 2026-02-17 | 13F | Parallax Volatility Advisers, L.P. | 27.609 | 724,89 | 3.522 | 488,96 | ||||
| 2026-02-17 | 13F | Persistent Asset Partners Ltd | 5.000 | 638 | ||||||
| 2026-01-29 | 13F | Simon Quick Advisors, Llc | 10.797 | 0,60 | 1.377 | -28,21 | ||||
| 2025-09-24 | NP | SWISX - Schwab International Index Fund This fund is a listed as child fund of Charles Schwab Investment Management Inc and if that institution has disclosed ownership in this security, then these positions will not be double counted when calculating total shares and total value | 233.316 | 4,55 | 36.549 | 22,18 | ||||
| 2026-02-11 | 13F | Cookson Peirce & Co Inc | 0 | -100,00 | 0 | |||||
| 2026-02-03 | 13F | Bluebird Wealth Management LLC | 13.047 | 1.664 | ||||||
| 2026-02-17 | 13F | Eminence Capital, Lp | 2.641.640 | 78,63 | 336.994 | 27,50 | ||||
| 2026-02-17 | 13F | Samlyn Capital, Llc | 0 | -100,00 | 0 | -100,00 | ||||
| 2025-09-24 | NP | Neuberger Berman Next Generation Connectivity Fund Inc. | 104.685 | -0,21 | 16.399 | 16,61 | ||||
| 2026-02-11 | 13F | West Family Investments, Inc. | 3.166 | 0,00 | 404 | -28,67 | ||||
| 2026-02-04 | 13F | C WorldWide Group Holding A/S | 197.648 | -16,40 | 25 | -40,48 | ||||
| 2026-02-04 | 13F | ABN AMRO Bank N.V. | 2.000 | -22,48 | 254 | -44,90 | ||||
| 2026-02-13 | 13F | Causeway Capital Management Llc | 0 | -100,00 | 0 | |||||
| 2026-02-17 | 13F | Bank Of America Corp /de/ | 2.187.684 | 9,70 | 279.083 | -21,70 | ||||
| 2025-09-24 | NP | DAINX - Dunham International Stock Fund Class A | 1.943 | 0,00 | 304 | 16,92 | ||||
| 2026-02-03 | 13F | International Assets Investment Management, Llc | 2.659 | 339 | ||||||
| 2026-02-06 | 13F | Fairtree Asset Management (Pty) Ltd | 3.907 | 498 | ||||||
| 2026-02-18 | 13F | Caitlin John, LLC | 21 | 0,00 | 3 | -33,33 | ||||
| 2026-02-12 | 13F | Colonial Trust Co / SC | 0 | -100,00 | 0 | -100,00 | ||||
| 2025-09-26 | NP | FFGX - Fidelity Fundamental Global ex-U.S. ETF | 805 | -34,76 | 126 | -23,64 | ||||
| 2026-02-17 | 13F | Voloridge Investment Management, Llc | 0 | -100,00 | 0 | |||||
| 2025-09-26 | NP | FSSGX - Fidelity SAI Sustainable Emerging Markets Equity Fund | 1.234 | -52,04 | 193 | -43,90 | ||||
| 2026-02-17 | 13F | Fred Alger Management, Llc | 2.767.173 | -4,13 | 353.008 | -31,57 | ||||
| 2026-02-10 | 13F | Principia Wealth Advisory, LLC | 5 | -76,19 | 1 | -100,00 | ||||
| 2026-01-12 | 13F | Brucke Financial, Inc. | 0 | -100,00 | 0 | |||||
| 2026-01-22 | 13F | City Holding Co | 0 | -100,00 | 0 | |||||
| 2026-02-13 | 13F | Greenline Wealth Management LLC | 238 | 30 | ||||||
| 2025-11-10 | 13F | WT Asset Management Ltd | 0 | -100,00 | 0 | -100,00 | ||||
| 2026-01-30 | 13F | Keybank National Association/oh | 4.782 | 11,34 | 610 | -20,47 | ||||
| 2026-02-05 | 13F | Chase Investment Counsel Corp | 9.794 | -57,59 | 1 | -75,00 | ||||
| 2026-02-02 | 13F | Benjamin Edwards Inc | 7.792 | 90,37 | 994 | 35,84 | ||||
| 2025-09-24 | NP | BlackRock ETF Trust - BlackRock Future Financial and Technology ETF This fund is a listed as child fund of BlackRock, Inc. and if that institution has disclosed ownership in this security, then these positions will not be double counted when calculating total shares and total value | 2.188 | 228,53 | 343 | 284,27 | ||||
| 2026-02-11 | 13F | Metis Global Partners, LLC | 7.774 | 21,64 | 992 | -13,22 | ||||
| 2026-02-12 | 13F | Hm Payson & Co | 800 | 0,00 | 102 | -28,17 | ||||
| 2026-02-11 | 13F | Havemeyer Place LP | 9.849 | 1.256 | ||||||
| 2026-02-14 | 13F | Rockefeller Capital Management L.P. | 2.898 | -11,70 | 370 | -37,03 | ||||
| 2026-02-09 | 13F | Prospera Financial Services Inc | 0 | -100,00 | 0 | |||||
| 2026-01-16 | 13F | Tower Wealth Partners, Inc. | 0 | -100,00 | 0 | -100,00 | ||||
| 2026-02-12 | 13F | Ward Ferry Management (BVI) Ltd | 1.511.242 | 38,42 | 193 | -1,54 | ||||
| 2025-09-25 | NP | VMMSX - Vanguard Emerging Markets Select Stock Fund Investor Shares | 39.644 | -2,36 | 6.210 | 14,11 | ||||
| 2026-02-10 | 13F | Fideuram Asset Management (Ireland) dac | 1.415 | 201 | ||||||
| 2026-02-17 | 13F | Wellington Management Group Llp | 828.169 | 7,26 | 105.650 | -23,44 | ||||
| 2025-11-06 | 13F | Financial Advocates Investment Management | 0 | -100,00 | 0 | -100,00 | ||||
| 2026-02-10 | 13F | Nomura Asset Management Co Ltd | 169.662 | -12,79 | 21.644 | -37,75 | ||||
| 2026-01-21 | 13F | Raleigh Capital Management Inc. | 1 | 0 | ||||||
| 2026-02-05 | 13F | AlphaCore Capital LLC | 1.613 | -12,72 | 206 | -37,88 | ||||
| 2026-02-17 | 13F | Canada Pension Plan Investment Board | 13 | -96,13 | 2 | -98,33 | ||||
| 2026-02-17 | 13F | Trexquant Investment LP | 84.627 | -50,81 | 10.796 | -64,89 | ||||
| 2026-02-13 | 13F | Bridgewater Associates, LP | 1.533.269 | -4,51 | 195.599 | -31,84 | ||||
| 2025-09-26 | NP | PCLCX - PACE Large Co Growth Equity Investments Class P | 15.110 | 2.367 | ||||||
| 2026-01-29 | 13F | D.a. Davidson & Co. | 4.232 | -22,69 | 540 | -44,89 | ||||
| 2026-02-02 | 13F | Addison Capital Co | 40.185 | 1,68 | 5.126 | -27,42 | ||||
| 2026-02-02 | 13F | Danske Bank A/s | 195.926 | 13,35 | 24.994 | -19,10 | ||||
| 2026-02-13 | 13F | Public Employees Retirement Association Of Colorado | 65.923 | -3,65 | 8 | -33,33 | ||||
| 2026-02-17 | 13F | Mercer Global Advisors Inc /adv | 23.121 | 3,70 | 2.822 | -29,18 | ||||
| 2026-02-17 | 13F | Avala Global LP | 348.214 | -22,92 | 44.422 | -44,98 | ||||
| 2026-01-07 | 13F | Mfg Wealth Management, Inc. | 0 | -100,00 | 0 | |||||
| 2026-02-11 | 13F | Group One Trading, L.p. | Call | 175.600 | -13,41 | 22.401 | -38,20 | |||
| 2026-02-02 | 13F | Wolverine Asset Management Llc | 82.676 | 10.547 | ||||||
| 2026-02-11 | 13F | Group One Trading, L.p. | Put | 132.300 | 71,15 | 16.878 | 22,16 | |||
| 2026-02-11 | 13F | Group One Trading, L.p. | 8.555 | -25,70 | 1.091 | -46,96 | ||||
| 2026-02-19 | 13F/A | Vancity Investment Management Ltd | 58.774 | -4,49 | 7 | -30,00 | ||||
| 2026-02-17 | 13F | Grafton Street Partners Management Company, LLC | 63.972 | 8.161 | ||||||
| 2025-11-14 | 13F | Beacon Pointe Advisors, LLC | 0 | -100,00 | 0 | |||||
| 2025-09-29 | NP | LGLAX - Lord Abbett Growth Leaders Fund Class A | 553.369 | 0,00 | 86.685 | 16,86 | ||||
| 2026-02-06 | 13F | GPS Wealth Strategies Group, LLC | 0 | -100,00 | 0 | |||||
| 2025-10-20 | 13F | Shilanski & Associates, Inc. | 2.041 | -0,73 | 365 | 10,98 | ||||
| 2026-02-10 | 13F | Bnp Paribas | 37.233 | 3,87 | 4.750 | -25,85 | ||||
| 2026-02-17 | 13F | Temasek Holdings (Private) Ltd | 3.303.217 | 33,45 | 421.391 | -4,75 | ||||
| 2025-10-07 | 13F | Proathlete Wealth Management Llc | 0 | -100,00 | 0 | |||||
| 2026-02-13 | 13F | Mariner, LLC | 26.056 | -29,10 | 3.324 | -49,39 | ||||
| 2025-11-14 | 13F | Symmetry Investments LP | 0 | -100,00 | 0 | -100,00 | ||||
| 2026-01-13 | 13F | Mather Group, Llc. | 0 | -100,00 | 0 | |||||
| 2026-02-13 | 13F | Gen-Wealth Partners Inc | 2.829 | 328,64 | 361 | 207,69 | ||||
| 2026-02-13 | 13F | Ubs Oconnor Llc | 4.000 | 510 | ||||||
| 2026-02-09 | 13F | Berkshire Capital Holdings Inc | 10 | 0,00 | 1 | 0,00 | ||||
| 2026-02-11 | 13F | Financiere des Professionnels - Fonds d,investissement inc. | 6.061 | -58,79 | 773 | -70,59 | ||||
| 2026-01-20 | 13F | Cigna Investments Inc /new | 6.824 | -0,66 | 1 | -100,00 | ||||
| 2026-02-05 | 13F | Pinnacle Associates Ltd | 10.608 | -12,46 | 1.353 | -37,51 | ||||
| 2026-02-11 | 13F | Zions Bancorporation, National Association /ut/ | 307 | 539,58 | 39 | 387,50 | ||||
| 2026-02-11 | 13F | O'shaughnessy Asset Management, Llc | 22.157 | -24,45 | 2.827 | -46,08 | ||||
| 2025-11-14 | 13F | Evelyn Partners Investment Management Services Ltd | 0 | -100,00 | 0 | |||||
| 2026-01-08 | 13F | Baker Tilly Financial, Llc | 0 | -100,00 | 0 | |||||
| 2026-02-14 | 13F | Whipplewood Advisors, LLC | 65 | 8 | ||||||
| 2026-01-22 | 13F | Financial Consulate, Inc | 0 | -100,00 | 0 | |||||
| 2025-11-13 | 13F | Deutsche Bank Ag\ | Put | 0 | -100,00 | 0 | -100,00 | |||
| 2025-11-21 | 13F/A | Royal Bank Of Canada | Call | 0 | -100,00 | 0 | -100,00 | |||
| 2025-09-24 | NP | Innovator ETFs Trust - Innovator Gradient Tactical Rotation Strategy ETF | 5.233 | 820 | ||||||
| 2026-02-13 | 13F | Aspex Management (HK) Ltd | 3.373.016 | -21,40 | 430 | -43,86 | ||||
| 2025-09-26 | NP | FXINX - Fidelity Flex International Focused Index Fund | 174 | 27 | ||||||
| 2026-02-04 | 13F | Hartford Investment Management Co | 4.600 | -0,43 | 587 | -28,97 | ||||
| 2025-11-13 | 13F | Marvin & Palmer Associates Inc | 0 | -100,00 | 0 | |||||
| 2026-02-05 | 13F | Allworth Financial LP | 577 | 67,25 | 74 | 19,67 | ||||
| 2026-02-13 | 13F | Eschler Asset Management LLP | 3.400 | -94,14 | 434 | -95,82 | ||||
| 2026-02-11 | 13F | Franklin Resources Inc | 2.144.222 | -1,86 | 273.538 | -29,95 | ||||
| 2026-02-13 | 13F | JustInvest LLC | 19.963 | -5,16 | 2.547 | -32,32 | ||||
| 2025-09-26 | NP | USCGX - Capital Growth Fund | 6.828 | -2,16 | 1.070 | 14,33 | ||||
| 2026-02-06 | 13F | Resona Asset Management Co.,Ltd. | 112.036 | -2,31 | 14.348 | -30,15 | ||||
| 2026-02-17 | 13F | Driehaus Capital Management Llc | 371.261 | 142,81 | 47.362 | 73,31 | ||||
| 2025-09-25 | NP | PDEAX - PGIM JENNISON EMERGING MARKETS EQUITY OPPORTUNITIES FUND Class A | 46.966 | -58,05 | 7.357 | 32,27 | ||||
| 2026-02-17 | 13F | Atreides Management, LP | 275.439 | 1,95 | 35.138 | -27,23 | ||||
| 2026-01-13 | 13F | CoreCap Advisors, LLC | 59 | 0,00 | 8 | -30,00 | ||||
| 2025-10-24 | 13F | Hemington Wealth Management | 23 | 64,29 | 0 | |||||
| 2026-02-04 | 13F | Proem Advisors LLC | 85.000 | 183,33 | 10.843 | 102,26 | ||||
| 2026-01-30 | 13F | Samalin Investment Counsel, LLC | 3.106 | -1,68 | 396 | -29,79 | ||||
| 2026-02-13 | 13F | Liberty One Investment Management, Llc | 4.629 | 591 | ||||||
| 2026-02-13 | 13F | Schroder Investment Management Group | 6.002.878 | 47,76 | 765.787 | 5,46 | ||||
| 2025-09-26 | NP | FEOPX - Fidelity Enduring Opportunities Fund This fund is a listed as child fund of Fmr Llc and if that institution has disclosed ownership in this security, then these positions will not be double counted when calculating total shares and total value | 284 | -8,97 | 44 | 7,32 | ||||
| 2026-02-10 | 13F | Murphy & Mullick Capital Management Corp | 27 | 8,00 | 3 | -25,00 | ||||
| 2026-02-12 | 13F | Integrated Quantitative Investments LLC | 10.161 | 1.296 | ||||||
| 2026-01-23 | 13F | Sumitomo Mitsui Trust Holdings, Inc. | 1.053.710 | -4,19 | 134.422 | -31,61 | ||||
| 2026-02-17 | 13F | Toronto Dominion Bank | 1.393.985 | 5,54 | 177.794 | -24,68 | ||||
| 2025-09-26 | NP | RGEAX - Global Equity Fund Class A | 16.457 | -8,26 | 2.578 | 7,20 | ||||
| 2026-02-17 | 13F | Price T Rowe Associates Inc /md/ | 20.517.378 | 20,79 | 2.617 | -13,77 | ||||
| 2026-02-17 | 13F | Point72 Asset Management, L.P. | Put | 171.200 | 79,45 | 21.840 | 28,09 | |||
| 2026-02-17 | 13F | Point72 Asset Management, L.P. | Call | 197.400 | 61,41 | 25.182 | 15,21 | |||
| 2026-02-17 | 13F | Cederberg Capital Ltd | 17.600 | 0,00 | 3 | 0,00 | ||||
| 2026-02-17 | 13F | Anson Funds Management LP | 20.000 | 2.551 | ||||||
| 2025-09-24 | NP | SNTKX - Steward International Enhanced Index Fund Class A | 13.437 | 8,21 | 2.105 | 26,44 | ||||
| 2025-11-06 | 13F | Ameritas Advisory Services, LLC | 0 | -100,00 | 0 | -100,00 | ||||
| 2026-02-12 | 13F | Ensign Peak Advisors, Inc | 16.300 | 0,31 | 2.079 | -28,41 | ||||
| 2025-10-31 | 13F | Whittier Trust Co Of Nevada Inc | 0 | -100,00 | 0 | |||||
| 2025-09-29 | NP | LAVGX - Lord Abbett International Growth Fund Class R6 | 365 | 1,67 | 57 | 18,75 | ||||
| 2025-11-13 | 13F | Total Investment Management Inc | 0 | -100,00 | 0 | -100,00 | ||||
| 2026-02-12 | 13F | Wealthspire Advisors, LLC | 0 | -100,00 | 0 | |||||
| 2025-11-12 | 13F | NewSquare Capital LLC | 0 | -100,00 | 0 | |||||
| 2026-01-26 | 13F | BCS Private Wealth Management, Inc. | 7.865 | 440,55 | 1.003 | 285,77 | ||||
| 2026-01-29 | 13F | Vanguard Group Inc | 916.603 | 1,48 | 116.931 | -27,56 | ||||
| 2026-02-13 | 13F | Great West Life Assurance Co /can/ | 216.499 | -24,04 | 28 | -47,06 | ||||
| 2026-01-13 | 13F | Norden Group Llc | 2.704 | -35,53 | 345 | -54,07 | ||||
| 2026-02-02 | 13F | CENTRAL TRUST Co | 5.656 | -46,62 | 721 | -61,91 | ||||
| 2026-02-17 | 13F | Lone Pine Capital Llc | 0 | -100,00 | 0 | |||||
| 2026-02-11 | 13F | Investors Towarzystwo Funduszy Inwestycyjnych Spolka Akcyjna | 1.997 | 54,81 | 255 | 10,43 | ||||
| 2026-02-17 | 13F | Viking Global Investors Lp | 3.671.545 | 20,81 | 468.379 | -13,77 | ||||
| 2026-02-12 | 13F | APG Asset Management N.V. | 19.899 | -14,97 | 2.161 | -39,28 | ||||
| 2026-02-17 | 13F | Point72 Asset Management, L.P. | 4.903.074 | 194,72 | 625.485 | 110,36 | ||||
| 2026-02-10 | 13F | Norges Bank | 4.518.219 | 576.389 | ||||||
| 2026-02-17 | 13F | Limestone Investment Advisors LP | Call | 0 | -100,00 | 0 | -100,00 | |||
| 2026-02-18 | 13F | Mackenzie Financial Corp | 157.194 | -21,03 | 20.136 | -43,40 | ||||
| 2026-02-12 | 13F | State Board Of Administration Of Florida Retirement System | 22.474 | 0,00 | 2.867 | -28,61 | ||||
| 2026-02-13 | 13F | Avanda Investment Management Pte. Ltd. | 0 | -100,00 | 0 | |||||
| 2026-02-17 | 13F | Lazard Asset Management Llc | 271.746 | -22,52 | 34.667 | -44,70 | ||||
| 2026-02-18 | 13F | State of Tennessee, Treasury Department | 718.949 | 32,35 | 83.750 | -13,74 | ||||
| 2026-02-17 | 13F | Limestone Investment Advisors LP | Put | 0 | -100,00 | 0 | -100,00 | |||
| 2026-02-13 | 13F | Scge Management, L.p. | 1.775.000 | 4,17 | 226.437 | -25,65 | ||||
| 2025-09-25 | NP | PRITX - T. Rowe Price International Stock Fund This fund is a listed as child fund of Price T Rowe Associates Inc /md/ and if that institution has disclosed ownership in this security, then these positions will not be double counted when calculating total shares and total value | 735.872 | -33,65 | 115.274 | -22,47 | ||||
| 2026-02-14 | 13F | American Trust | 2.761 | 21,31 | 352 | -13,30 | ||||
| 2026-02-17 | 13F | Mirabella Financial Services Llp | 17.909 | -59,80 | 2.279 | -71,38 | ||||
| 2025-11-14 | 13F | Flight Deck Capital, LP | 0 | -100,00 | 0 | -100,00 | ||||
| 2026-02-18 | 13F | Arohi Asset Management PTE Ltd. | 1.131.800 | -9,55 | 144.384 | -35,44 | ||||
| 2026-01-14 | 13F | Exchange Traded Concepts, Llc | 278.742 | 68,15 | 35.559 | 20,02 | ||||
| 2026-02-04 | 13F | Tsfg, Llc | 125 | 108,33 | 0 | |||||
| 2026-02-10 | 13F | Parametrica Management Ltd | 16.000 | 0,00 | 2.041 | -28,61 | ||||
| 2026-02-17 | 13F | Veritas Asset Management LLP | 22.860 | 2.916 | ||||||
| 2025-09-25 | NP | PRGSX - T. Rowe Price Global Stock Fund This fund is a listed as child fund of Price T Rowe Associates Inc /md/ and if that institution has disclosed ownership in this security, then these positions will not be double counted when calculating total shares and total value | 392.377 | 59,96 | 61.466 | 86,93 | ||||
| 2026-02-12 | 13F | Skopos Labs, Inc. | 7.966 | 127,67 | 1.043 | 87,07 | ||||
| 2026-01-28 | 13F | Oversea-Chinese Banking CORP Ltd | 1.791.660 | 24,35 | 228.549 | -11,21 | ||||
| 2025-09-23 | NP | POIIX - Polen International Growth Fund Institutional Class | 18.626 | 2.918 | ||||||
| 2026-02-17 | 13F | Snowden Capital Advisors LLC | 18.247 | -4,86 | 2.328 | -32,10 | ||||
| 2026-01-23 | 13F | TT International Asset Management LTD | 43.845 | 257,36 | 6 | -99,77 | ||||
| 2026-02-03 | 13F | Generali Asset Management SPA SGR | 883 | 0,00 | 113 | -28,66 | ||||
| 2026-02-10 | 13F | Hillsdale Investment Management Inc. | 640 | -1,54 | 82 | -30,17 | ||||
| 2025-09-26 | NP | FHKFX - Fidelity Series Emerging Markets Fund This fund is a listed as child fund of Fmr Llc and if that institution has disclosed ownership in this security, then these positions will not be double counted when calculating total shares and total value | 77.900 | -62,18 | 12.203 | -55,81 | ||||
| 2026-02-11 | 13F | Gwn Securities Inc. | 0 | -100,00 | 0 | -100,00 | ||||
| 2026-02-17 | 13F | Captrust Financial Advisors | 28.941 | 22,64 | 3.692 | -12,47 | ||||
| 2026-02-10 | 13F | Bnp Paribas Arbitrage, Sa | Put | 0 | -100,00 | 0 | -100,00 | |||
| 2025-09-26 | NP | FSUMX - Fidelity Series Sustainable U.S. Market Fund | 52 | -1,89 | 8 | 14,29 | ||||
| 2026-01-14 | 13F | Eagle Rock Investment Company, Llc | 0 | -100,00 | 0 | |||||
| 2026-02-12 | 13F | Insigneo Advisory Services, Llc | 3.719 | 8,39 | 474 | -22,68 | ||||
| 2025-11-13 | 13F | United Super Pty Ltd in its capacity as Trustee for the Construction & Building Unions Superannuation Fund | 0 | -100,00 | 0 | |||||
| 2026-02-04 | 13F | Western Pacific Wealth Management, LP | 44 | 0,00 | 6 | -28,57 | ||||
| 2026-02-10 | 13F | Mitchell Capital Management Co | 22.795 | -0,18 | 2.908 | -28,77 | ||||
| 2026-02-13 | 13F | Strategic Global Advisors, LLC | 25.216 | -38,73 | 3.217 | -56,27 | ||||
| 2026-02-17 | 13F | Maryland State Retirement & Pension System | 31.032 | 0,00 | 3.959 | -28,63 | ||||
| 2025-10-16 | 13F | City State Bank | 0 | -100,00 | 0 | |||||
| 2026-02-06 | 13F | Handelsbanken Fonder AB | 142.576 | -15,18 | 18 | -40,00 | ||||
| 2025-09-26 | NP | PCIEX - PACE International Equity Investments Class P | 32.302 | -6,56 | 5.060 | 9,22 | ||||
| 2026-02-06 | 13F | Profund Advisors Llc | 4.388 | -28,43 | 560 | -48,95 | ||||
| 2026-02-10 | 13F | Dynasty Wealth Management, Llc | 2.939 | 5,64 | 375 | -24,75 | ||||
| 2026-01-21 | 13F | Yousif Capital Management, Llc | 15.868 | -0,46 | 1.924 | -32,50 | ||||
| 2026-02-10 | 13F | AdvisorShares Investments LLC | 8.642 | 1,62 | 1.102 | -27,45 | ||||
| 2026-01-28 | 13F | Teacher Retirement System Of Texas | 290.127 | -4,85 | 37.012 | -32,09 | ||||
| 2025-11-14 | 13F | PineBridge Investments, L.P. | 5.148 | 15,84 | 920 | 29,58 | ||||
| 2026-01-26 | 13F | United Advisor Group, LLC | 2.093 | -43,46 | 267 | -59,61 | ||||
| 2026-02-13 | 13F | Charles Schwab Investment Management Inc | 321.121 | 0,29 | 40.965 | -28,42 | ||||
| 2026-02-12 | 13F | Voya Investment Management Llc | 50.626 | 6,05 | 6.458 | -24,31 | ||||
| 2026-02-17 | 13F | Glenmede Trust Co Na | 21.849 | -6,56 | 2.787 | -8,65 | ||||
| 2026-02-13 | 13F | Cetera Trust Company, N.A | 1.180 | -33,71 | 151 | -52,83 | ||||
| 2026-02-12 | 13F | UniSuper Management Pty Ltd | 112.400 | 0,63 | 14.339 | -28,18 | ||||
| 2026-02-17 | 13F | Quantitative Investment Management, LLC | 6.082 | -26,47 | 1 | -100,00 | ||||
| 2026-01-23 | 13F | Robeco Institutional Asset Management B.V. | 846.627 | -19,31 | 108.004 | -42,40 | ||||
| 2026-02-17 | 13F | Duquesne Family Office LLC | 944.120 | 244,32 | 120 | 144,90 | ||||
| 2025-09-25 | NP | PRJAX - PGIM Jennison Global Opportunities Fund Class A | 1.085.522 | 101,88 | 170.047 | 135,91 | ||||
| 2026-02-11 | 13F | Gordian Capital Singapore Pte Ltd | 19.000 | 0,00 | 2.424 | -28,63 | ||||
| 2026-02-09 | 13F | Geode Capital Management, Llc | 3.568.472 | 3,54 | 448.976 | -26,07 | ||||
| 2026-02-17 | 13F | Brevan Howard Capital Management LP | 9.000 | 1.144 | -60,55 | |||||
| 2025-09-25 | NP | VSIEX - JPMorgan International Equity Fund Class I | 256.199 | 89,23 | 40.134 | 288,43 | ||||
| 2025-09-26 | NP | PNQI - Invesco NASDAQ Internet ETF This fund is a listed as child fund of Invesco Ltd. and if that institution has disclosed ownership in this security, then these positions will not be double counted when calculating total shares and total value | 75.774 | -15,25 | 11.870 | -0,96 | ||||
| 2026-02-17 | 13F | Align Financial, LLC | 22.707 | 23 | ||||||
| 2026-01-23 | 13F | Gibbs Wealth Management | 7.282 | -21,43 | 972 | -41,30 | ||||
| 2025-09-25 | NP | PIEQX - T. Rowe Price International Equity Index Fund This fund is a listed as child fund of Price T Rowe Associates Inc /md/ and if that institution has disclosed ownership in this security, then these positions will not be double counted when calculating total shares and total value | 34.184 | 19,04 | 5.355 | 39,10 | ||||
| 2026-02-17 | 13F | Fund 1 Investments, LLC | 79.000 | 10.078 | ||||||
| 2026-02-17 | 13F | Blackstone Group Inc | 18.439 | 103,21 | 2.352 | 45,10 | ||||
| 2026-01-27 | 13F | Belpointe Asset Management LLC | 6.440 | 11,44 | 822 | -20,45 | ||||
| 2026-02-12 | 13F | Qtron Investments LLC | 0 | -100,00 | 0 | |||||
| 2026-02-13 | 13F | Banco Santander, S.A. | 0 | -100,00 | 0 | |||||
| 2026-02-06 | 13F | Cullen/frost Bankers, Inc. | 1.132 | 102,50 | 144 | 45,45 | ||||
| 2026-02-05 | 13F | Thrivent Financial For Lutherans | 19.242 | -1,96 | 2 | -33,33 | ||||
| 2026-01-15 | 13F | Trust Co | 3 | 0 | ||||||
| 2026-01-20 | 13F | Sheets Smith Wealth Management | 0 | -100,00 | 0 | |||||
| 2026-02-17 | 13F | Fullerton Fund Management Co Ltd | 209.826 | 3,21 | 26.768 | -26,33 | ||||
| 2026-02-17 | 13F | Nissay Asset Management Corp /japan/ /adv | 143.649 | 111,82 | 18.325 | 51,20 | ||||
| 2025-11-14 | 13F | Point72 Hong Kong Ltd | 1.399 | 250 | ||||||
| 2025-11-14 | 13F | Sig Brokerage, Lp | 0 | -100,00 | 0 | |||||
| 2026-01-29 | 13F | UMA Financial Services, Inc. | 17 | -15,00 | 2 | -33,33 | ||||
| 2026-02-13 | 13F | Wealth Alliance | 3.976 | -19,53 | 507 | -42,58 | ||||
| 2026-02-10 | 13F | Envestnet Asset Management Inc | 1.175.371 | -10,47 | 149.942 | -36,10 | ||||
| 2026-02-10 | 13F | National Pension Service | 704.327 | -46,86 | 89.851 | -62,07 | ||||
| 2025-09-26 | NP | JHMD - John Hancock Multifactor Developed International ETF | 4.384 | -4,11 | 687 | 12,09 | ||||
| 2026-02-13 | 13F | Barclays Plc | 2.246.371 | 29,91 | 286.570 | -7,27 | ||||
| 2026-02-13 | 13F | Barclays Plc | Put | 45.700 | -23,45 | 5.830 | -45,37 | |||
| 2026-01-29 | 13F | UBS Group AG | Put | 364.305 | -9,76 | 46.474 | -35,59 | |||
| 2026-02-11 | 13F | Meiji Yasuda Life Insurance Co | 3.587 | -8,14 | 458 | -34,43 | ||||
| 2026-01-29 | 13F | UBS Group AG | Call | 232.962 | -18,19 | 29.719 | -41,61 | |||
| 2026-03-06 | 13F | Hsbc Holdings Plc | Put | 0 | -100,00 | 0 | ||||
| 2026-01-29 | 13F | UBS Group AG | 5.153.194 | 51,97 | 657.393 | 8,47 | ||||
| 2026-02-17 | 13F | Public Employees Retirement System Of Ohio | 620.638 | -11,98 | 79.175 | -37,18 | ||||
| 2025-10-27 | 13F | Hoxton Planning & Management, LLC | 1.221 | 218 | ||||||
| 2025-11-10 | 13F | Eleva Capital SAS | 0 | -100,00 | 0 | -100,00 | ||||
| 2026-02-13 | 13F | Barclays Plc | Call | 518.500 | 93,83 | 66.145 | 38,35 | |||
| 2026-02-13 | 13F | Marcho Partners LLP | 156.592 | 14,63 | 19.976 | -18,18 | ||||
| 2026-02-13 | 13F | Carter Financial Group, INC. | 0 | -100,00 | 0 | |||||
| 2026-03-06 | 13F | Hsbc Holdings Plc | Call | 0 | -100,00 | 0 | ||||
| 2026-02-02 | 13F | Advisors Preferred, LLC | 0 | -100,00 | 0 | |||||
| 2025-09-26 | NP | AAEMX - Alger Emerging Markets Fund Class A | 1.738 | -75,10 | 272 | -74,07 | ||||
| 2026-02-11 | 13F | Cerity Partners LLC | 26.081 | 4,26 | 3.327 | -25,56 | ||||
| 2026-02-17 | 13F | Two Sigma Securities, Llc | 3.524 | 450 | ||||||
| 2025-09-25 | NP | TMSRX - T. Rowe Price Multi-Strategy Total Return Fund This fund is a listed as child fund of Price T Rowe Associates Inc /md/ and if that institution has disclosed ownership in this security, then these positions will not be double counted when calculating total shares and total value | 2.143 | 42,30 | 336 | 66,67 | ||||
| 2026-01-05 | 13F | Rosenberg Matthew Hamilton | 298 | 0,00 | 38 | -28,30 | ||||
| 2026-02-12 | 13F | Evolutionary Tree Capital Management, LLC | 24.837 | 17,51 | 3.168 | -16,12 | ||||
| 2026-02-13 | 13F | Neuberger Berman Group LLC | 344.759 | 17,93 | 44.015 | -15,93 | ||||
| 2026-02-13 | 13F | Tree Line Advisors (Hong Kong) Ltd. | 940.000 | 0,00 | 119.916 | -29,69 | ||||
| 2026-02-13 | 13F | Storgate, LLC | 12.333 | 1.573 | ||||||
| 2026-01-27 | 13F | BLVD Private Wealth, LLC | 0 | -100,00 | 0 | -100,00 | ||||
| 2026-02-12 | 13F | Xponance, Inc. | 1.949 | 0,00 | 249 | -28,74 | ||||
| 2025-11-14 | 13F | AXA Investment Managers S.A. | 341.556 | 61.046 | ||||||
| 2026-02-17 | 13F | Jump Financial, LLC | 53.897 | -25,42 | 6.876 | -46,77 | ||||
| 2026-02-13 | 13F | Integrated Wealth Concepts LLC | 2.173 | -78,21 | 277 | -84,46 | ||||
| 2026-02-17 | 13F | Perennial Investment Advisors, LLC | 0 | -100,00 | 0 | -100,00 | ||||
| 2026-02-17 | 13F | Himension Fund | 8.172 | 1.043 | ||||||
| 2026-01-07 | 13F | Stonekeep Investments, LLC | 0 | -100,00 | 0 | |||||
| 2026-01-29 | 13F | IMC-Chicago, LLC | 99.512 | 12.695 | ||||||
| 2026-02-03 | 13F | Gallacher Capital Management LLC | 2.635 | -25,10 | 336 | -46,50 | ||||
| 2026-02-11 | 13F | Fox Run Management, L.l.c. | 0 | -100,00 | 0 | |||||
| 2026-01-29 | 13F | IMC-Chicago, LLC | Put | 406.600 | -15,17 | 51.870 | -39,45 | |||
| 2026-02-10 | 13F | Blue Barn Wealth, LLC | 0 | -100,00 | 0 |