Grundlæggende statistik
| Institutionelle aktier (lange) | 244.297.690 - 95,02% (ex 13D/G) - change of -26,34MM shares -9,73% MRQ |
| Institutionel værdi (lang) | $ 61.434.447 USD ($1000) |
Institutionelt ejerskab og aktionærer
Arthur J. Gallagher & Co. (US:AJG) har 1536 institutionelle ejere og aktionærer, der har indsendt 13D/G- eller 13F-formularer til Securities Exchange Commission (SEC). Disse institutioner har i alt 244,310,772 aktier. Største aktionærer omfatter Vanguard Group Inc, Jpmorgan Chase & Co, BlackRock, Inc., Fmr Llc, Capital World Investors, State Street Corp, Morgan Stanley, Norges Bank, Capital International Investors, and Geode Capital Management, Llc .
Arthur J. Gallagher & Co. (NYSE:AJG) institutionel ejerskabsstruktur viser aktuelle positioner i virksomheden efter institutioner og fonde, samt seneste ændringer i positionsstørrelse. Større aktionærer kan omfatte individuelle investorer, investeringsforeninger, hedgefonde eller institutioner. Skema 13D angiver, at investoren besidder (eller besidder) mere end 5 % af virksomheden og har til hensigt (eller har til hensigt at) aktivt at forfølge en ændring i forretningsstrategi. Skema 13G indikerer en passiv investering på over 5%.
The share price as of March 20, 2026 is 214,82 / share. Previously, on March 21, 2025, the share price was 331,79 / share. This represents a decline of 35,25% over that period.

Fondens stemningsscore
Fund Sentiment Score (fka Ownership Accumulation Score) finder de aktier, der bliver mest købt af fonde. Det er resultatet af en sofistikeret, multi-faktor kvantitativ model, der identificerer virksomheder med de højeste niveauer af institutionel akkumulering. Scoringsmodellen bruger en kombination af den samlede stigning i oplyste ejere, ændringerne i porteføljeallokeringer i disse ejere og andre målinger. Tallet går fra 0 til 100, hvor højere tal indikerer et højere niveau af akkumulering for sine jævnaldrende, og 50 er gennemsnittet.
Opdateringsfrekvens: Dagligt
Se Ownership Explorer, som giver en liste over højest rangerende virksomheder.
AI+ Ask Fintel’s AI assistant about Arthur J. Gallagher & Co..
Select a question to share a public post with an AI-crafted answer.
Thinking of good questions…
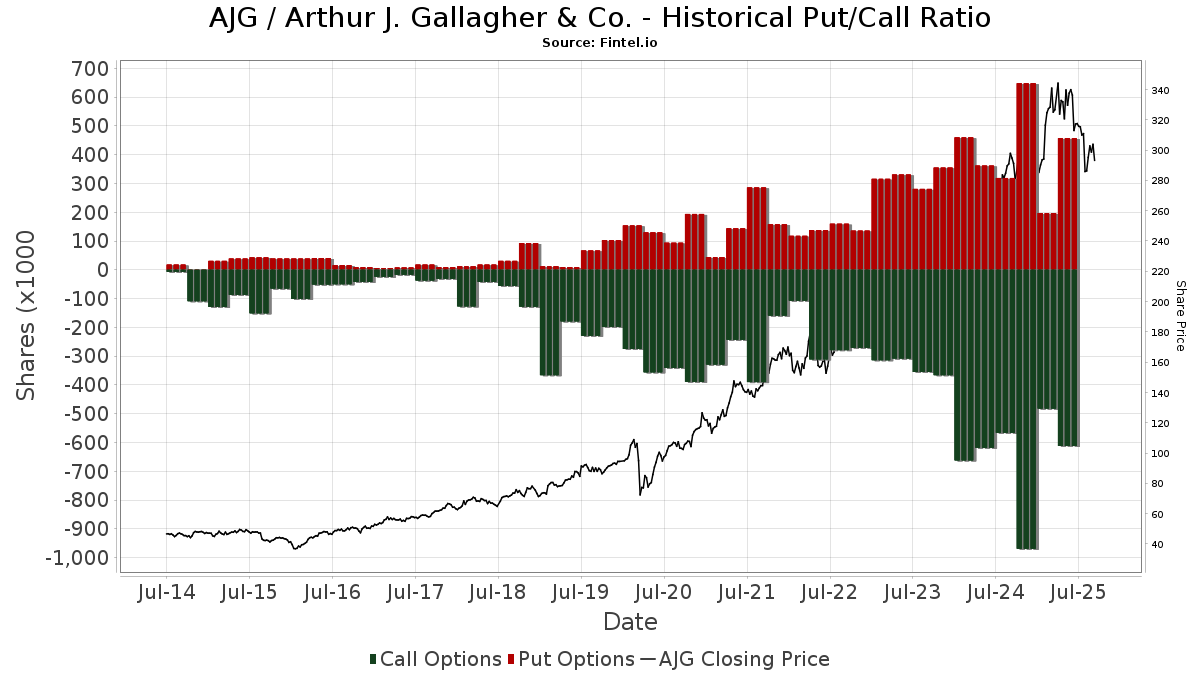
Institutionel Put/Call-forhold
Ud over at indberette standardaktie- og gældsudstedelser skal institutter med mere end 100 mill. aktiver under forvaltning også oplyse deres put- og call-optionsbeholdninger. Da salgsoptioner generelt indikerer negativ stemning, og købsoptioner indikerer positiv stemning, kan vi få en fornemmelse af den overordnede institutionelle stemning ved at plotte forholdet mellem put og kald. Diagrammet til højre viser det historiske put/call-forhold for dette instrument.
Brug af Put/Call Ratio som en indikator for investorernes stemning overvinder en af de vigtigste mangler ved at bruge totalt institutionelt ejerskab, som er, at en betydelig mængde af aktiver under forvaltning investeres passivt for at spore indekser. Passivt forvaltede fonde køber typisk ikke optioner, så indikatoren for put/call-forholdet følger mere nøje følelsen af aktivt forvaltede fonde.
13D/G-arkivering
Vi præsenterer 13D/G ansøgninger separat fra 13F ansøgninger på grund af den forskellige behandling af SEC. 13D/G-ansøgninger kan indgives af grupper af investorer (med én ledende), hvorimod 13F-ansøgninger ikke kan. Dette resulterer i situationer, hvor en investor kan indsende en 13D/G, der rapporterer én værdi for de samlede aktier (der repræsenterer alle de aktier, der ejes af investorgruppen), men derefter indsender en 13F, der rapporterer en anden værdi for de samlede aktier (der udelukkende repræsenterer deres egne) ejendomsret). Det betyder, at aktieejerskab af 13D/G-arkiver og 13F-arkiveringer ofte ikke er direkte sammenlignelige, så vi præsenterer dem separat.
Bemærk: Fra den 16. maj 2021 viser vi ikke længere ejere, der ikke har indsendt en 13D/G inden for det seneste år. Tidligere viste vi den fulde historie af 13D/G-arkiver. Generelt skal enheder, der er forpligtet til at indgive 13D/G-ansøgninger, indgive mindst årligt, før de indsender en afsluttende ansøgning. Dog forlader fonde nogle gange positioner uden at indsende en afsluttende ansøgning (dvs. de afvikler), så visning af den fulde historie resulterede nogle gange i forvirring om det nuværende ejerskab. For at undgå forvirring viser vi nu kun 'aktuelle' ejere - det vil sige - ejere, der har anmeldt inden for det seneste år.
Upgrade to unlock premium data.
| Fil dato | Form | Investor | Forrige Aktier |
Seneste Aktier |
Δ Aktier (Procent) |
Ejendomsret (Procent) |
Δ Ejerskab (Procent) |
|
|---|---|---|---|---|---|---|---|---|
| 2026-02-13 | Capital World Investors | 5,000,000 | 12,951,790 | 159.04 | 5.00 | 25.00 | ||
| 2025-10-31 | JPMORGAN CHASE & CO | 17,145,622 | 20,155,017 | 17.55 | 7.80 | 16.42 | ||
| 2025-07-16 | BlackRock, Inc. | 17,415,095 | 17,725,659 | 1.78 | 6.90 | -14.81 |
13F og NPORT arkivering
Detaljer om 13F-arkivering er gratis. Detaljer om NP-ansøgninger kræver et premium-medlemskab. Grønne rækker angiver nye positioner. Røde rækker angiver lukkede positioner. Klik på linket ikon for at se den fulde transaktionshistorik.
Opgrader
for at låse premium-data op og eksportere til Excel ![]() .
.
Important Note
In an effort to reduce load times for our mobile users, we are testing some ways to deliver lighter pages.
In this first test, we will deliver only the most recent 750 transactions (out of 1907 for this stock). If you are interested in loading *all* the transactions for this company, click the "load all" button below. This is just a test and if you don't like it, please let us know by submitting some gentle feedback via the link at the bottom of this page.
Load All| Fil dato | Kilde | Investor | Type | Gennemsnitlig pris (Øst) |
Aktier | Δ Aktier (%) |
Rapporteret Værdi ($1000) |
Δ Værdi (%) |
Port Alloc (%) |
|
|---|---|---|---|---|---|---|---|---|---|---|
| 2025-09-26 | NP | Eaton Vance Tax-managed Diversified Equity Income Fund | 74.450 | 0,00 | 21.386 | -10,43 | ||||
| 2026-01-26 | 13F | Provenance Wealth Advisors, LLC | 7 | 0,00 | 2 | -50,00 | ||||
| 2026-02-10 | 13F | Norges Bank | 7.438.704 | 1.925.062 | ||||||
| 2026-01-09 | 13F | Diversified Trust Co | 0 | -100,00 | 0 | |||||
| 2026-01-21 | 13F | Fulton Breakefield Broenniman Llc | 1.175 | 11,37 | 304 | -6,75 | ||||
| 2026-01-26 | 13F | Foster Victor Wealth Advisors, LLC | 900 | 0,56 | 233 | -16,25 | ||||
| 2026-02-13 | 13F | Peak6 Llc | 9.327 | 2.414 | ||||||
| 2025-11-14 | 13F | Strategic Wealth Partners, Ltd. | 368 | -85,87 | 114 | -86,43 | ||||
| 2026-01-21 | 13F | Sound Income Strategies, LLC | 15 | 0,00 | 4 | -25,00 | ||||
| 2026-02-17 | 13F | Ancora Advisors, LLC | 9.701 | -2,19 | 2.511 | -18,29 | ||||
| 2025-10-29 | 13F | HHM Wealth Advisors, LLC | 0 | -100,00 | 0 | |||||
| 2026-02-17 | 13F | Maryland State Retirement & Pension System | 12.638 | 0,00 | 3.271 | -16,45 | ||||
| 2026-02-11 | 13F | Fjarde Ap-fonden /fourth Swedish National Pension Fund | 75.954 | 19.656 | ||||||
| 2026-02-13 | 13F | Neo Ivy Capital Management | 15.267 | 39,83 | 3.951 | 16,83 | ||||
| 2026-02-02 | 13F | Ellis Investment Partners, LLC | 3.711 | -8,19 | 961 | -23,32 | ||||
| 2025-09-29 | NP | PBP - Invesco S&P 500 BuyWrite ETF This fund is a listed as child fund of Invesco Ltd. and if that institution has disclosed ownership in this security, then these positions will not be double counted when calculating total shares and total value | 1.367 | 78,23 | 393 | 60,00 | ||||
| 2026-01-29 | 13F | Dunhill Financial, LLC | 101 | -7,34 | 26 | -21,21 | ||||
| 2025-11-14 | 13F | Qtron Investments LLC | 0 | -100,00 | 0 | |||||
| 2026-02-06 | 13F | IFP Advisors, Inc | 3.121 | -3,91 | 808 | -19,78 | ||||
| 2026-02-13 | 13F | Delos Wealth Advisors, LLC | 4 | 0,00 | 1 | 0,00 | ||||
| 2026-02-13 | 13F | River Wealth Advisors LLC | 843 | -38,33 | 218 | -48,46 | ||||
| 2026-01-26 | 13F | Chicago Capital, LLC | 11.713 | 1,52 | 3.031 | -15,17 | ||||
| 2026-01-15 | 13F | Burns Matteson Capital Management, LLC | 1.077 | -3,06 | 279 | -19,19 | ||||
| 2026-01-29 | 13F | Obermeyer Wood Investment Counsel, Lllp | 1.740 | -1,19 | 450 | -17,43 | ||||
| 2026-01-14 | 13F | Woodward Diversified Capital, Llc | 2.822 | 4,17 | 730 | -12,99 | ||||
| 2026-02-11 | 13F | Picton Mahoney Asset Management | 38.507 | -20,57 | 9.965 | 66.333,33 | ||||
| 2026-02-17 | 13F | Asset One Wealth Management LLC | 965 | 237 | ||||||
| 2026-02-02 | 13F | Ashton Thomas Securities, Llc | 0 | -100,00 | 0 | |||||
| 2026-01-07 | 13F | WESPAC Advisors SoCal, LLC | 0 | -100,00 | 0 | |||||
| 2026-02-03 | 13F | Crossmark Global Holdings, Inc. | 11.232 | -7,22 | 2.907 | -22,49 | ||||
| 2026-02-17 | 13F | D. E. Shaw & Co., Inc. | 173.498 | 404,50 | 44.900 | 321,55 | ||||
| 2026-02-13 | 13F | NLB Skladi, upravljanje premozenja, d.o.o. | 1.069 | 277 | ||||||
| 2026-01-14 | 13F | Nova Wealth Management, Inc. | 16 | 0,00 | 4 | 0,00 | ||||
| 2026-01-30 | 13F | Strategic Blueprint, LLC | 1.368 | 4,59 | 354 | -12,84 | ||||
| 2026-02-17 | 13F | Tcw Group Inc | 4.003 | 1.036 | ||||||
| 2025-09-25 | NP | DFUS - Dimensional U.S. Equity ETF | 72.772 | 9,39 | 20.904 | -2,02 | ||||
| 2026-02-18 | 13F | State of Tennessee, Treasury Department | 109.468 | 27,53 | 27.298 | 2,67 | ||||
| 2026-02-17 | 13F | Delta Global Management LP | 6.620 | -20,51 | 1.713 | -33,58 | ||||
| 2026-01-29 | 13F | State Of Michigan Retirement System | 67.187 | -3,03 | 17.387 | -18,98 | ||||
| 2026-02-12 | 13F | Raiffeisen Bank International AG | 4.003 | -4,14 | 1.048 | -17,87 | ||||
| 2025-09-29 | NP | AWMIX - CIBC Atlas Mid Cap Equity Fund Institutional Class | 39.129 | -2,73 | 11.240 | -12,88 | ||||
| 2026-02-12 | 13F | Intesa Sanpaolo Wealth Management | 9.183 | 2.376 | ||||||
| 2026-02-13 | 13F | Truvestments Capital Llc | 88 | -6,38 | 23 | -24,14 | ||||
| 2026-02-02 | 13F | Fairfield Financial Advisors, LTD | 6.651 | -31,05 | 1.721 | -42,38 | ||||
| 2026-01-23 | 13F | Reuter James Wealth Management, Llc | 27.358 | 0,93 | 7.080 | -15,68 | ||||
| 2026-02-19 | 13F | Invesco Ltd. | 1.733.169 | 5,19 | 448.527 | -12,11 | ||||
| 2025-09-26 | NP | SUNAMERICA SERIES TRUST - SA JPMorgan Mid-Cap Growth Portfolio Class 1 | 14.680 | -29,86 | 4.217 | -37,18 | ||||
| 2026-01-15 | 13F | Foundation Wealth Management, LLC\PA | 2.271 | -2,11 | 588 | -18,25 | ||||
| 2025-09-29 | NP | VEGN - US Vegan Climate ETF | 1.371 | 31,20 | 394 | 17,31 | ||||
| 2025-10-24 | 13F | Hemington Wealth Management | 99 | -5,71 | 0 | |||||
| 2026-01-22 | 13F | City Holding Co | 1.022 | 0,00 | 264 | -16,46 | ||||
| 2025-09-29 | NP | FAS - Direxion Daily Financial Bull 3X Shares | 62.963 | 9,76 | 18.086 | -1,68 | ||||
| 2026-02-10 | 13F | Ellevest, Inc. | 2.117 | 23,01 | 548 | 2,63 | ||||
| 2026-02-13 | 13F | Fayez Sarofim & Co | 0 | -100,00 | 0 | |||||
| 2026-02-12 | 13F | Longbow Finance SA | 0 | -100,00 | 0 | |||||
| 2026-02-02 | 13F | CENTRAL TRUST Co | 18.932 | -4,91 | 4.899 | -20,55 | ||||
| 2026-01-20 | 13F | AdvisorNet Financial, Inc | 1.354 | 0,00 | 350 | -16,47 | ||||
| 2026-02-13 | 13F | AlTi Global, Inc. | 2.207 | -6,56 | 571 | -21,89 | ||||
| 2026-01-15 | 13F | Bright Rock Capital Management, Llc | 7.500 | 0,00 | 1.941 | -16,49 | ||||
| 2026-02-10 | 13F | Principia Wealth Advisory, LLC | 8 | -33,33 | 2 | -33,33 | ||||
| 2026-02-17 | 13F | California State Teachers Retirement System | 378.483 | -2,08 | 97.948 | -18,18 | ||||
| 2026-02-17 | 13F | Lazard Asset Management Llc | 206.238 | 53.372 | ||||||
| 2026-01-08 | 13F | Baker Tilly Financial, Llc | 1.058 | 2,42 | 274 | -14,42 | ||||
| 2025-09-25 | NP | DFAC - Dimensional U.S. Core Equity 2 ETF | 74.643 | -0,11 | 21.441 | -10,52 | ||||
| 2026-02-05 | 13F | RiverFront Investment Group, LLC | 796 | 206 | ||||||
| 2026-02-13 | 13F | Kilter Group LLC | 35 | -10,26 | 9 | -25,00 | ||||
| 2025-11-14 | 13F | Fortress Investment Group LLC | 0 | -100,00 | 0 | |||||
| 2026-02-06 | 13F | ProShare Advisors LLC | 54.222 | 5,38 | 14.032 | -11,95 | ||||
| 2026-02-13 | 13F | FJ Capital Management LLC | 0 | -100,00 | 0 | |||||
| 2025-11-07 | 13F | Gsa Capital Partners Llp | 0 | -100,00 | 0 | |||||
| 2026-02-20 | 13F | Sunbelt Securities, Inc. | 3.222 | -2,33 | 834 | -18,41 | ||||
| 2026-02-12 | 13F | Loomis Sayles & Co L P | 0 | 0 | ||||||
| 2026-01-13 | 13F | Parsons Capital Management Inc/ri | 4.568 | -17,23 | 1.182 | -30,84 | ||||
| 2026-01-29 | 13F | Vanguard Group Inc | 31.390.446 | 0,70 | 8.123.534 | -15,87 | ||||
| 2026-02-06 | 13F | Payden & Rygel | 500 | -85,71 | 0 | -100,00 | ||||
| 2026-02-13 | 13F | Epoch Investment Partners, Inc. | 0 | -100,00 | 0 | |||||
| 2026-02-10 | 13F | Westpac Banking Corp | 1.079 | 0,00 | 279 | -16,47 | ||||
| 2026-02-13 | 13F | JustInvest LLC | 26.876 | -6,37 | 6.955 | -21,77 | ||||
| 2026-01-28 | 13F | Mowery & Schoenfeld Wealth Management, LLC | 1.087 | -9,64 | 281 | -24,46 | ||||
| 2026-02-13 | 13F | Rafferty Asset Management, LLC | 78.346 | -8,17 | 20.275 | -23,27 | ||||
| 2025-11-07 | 13F | Synovus Financial Corp | 12.700 | 32,90 | 3.934 | 28,57 | ||||
| 2026-02-09 | 13F | Nicola Wealth Management Ltd. | 42.900 | 0,00 | 11.102 | -16,44 | ||||
| 2025-09-24 | NP | SWTSX - Schwab Total Stock Market Index Fund This fund is a listed as child fund of Charles Schwab Investment Management Inc and if that institution has disclosed ownership in this security, then these positions will not be double counted when calculating total shares and total value | 123.360 | 1,92 | 35.435 | -8,71 | ||||
| 2026-02-12 | 13F | BRYN MAWR TRUST Co | 813 | 0,00 | 210 | -16,33 | ||||
| 2026-02-13 | 13F | Colony Group, LLC | 644.128 | 1.368,06 | 166.694 | 1.125,06 | ||||
| 2026-02-03 | 13F | Asset Planning,Inc | 1.206 | 0,25 | 312 | -16,13 | ||||
| 2026-02-13 | 13F | 11 Capital Partners LP | 53.714 | -19,92 | 13.901 | -33,09 | ||||
| 2026-02-05 | 13F | Tucker Asset Management Llc | 1.274 | 12,64 | 330 | -6,00 | ||||
| 2026-02-11 | 13F | Janney Montgomery Scott LLC | 39.577 | -37,54 | 10 | -47,37 | ||||
| 2025-09-26 | NP | FHOFX - Fidelity Series Large Cap Growth Index Fund This fund is a listed as child fund of Fmr Llc and if that institution has disclosed ownership in this security, then these positions will not be double counted when calculating total shares and total value | 1.036 | -8,24 | 298 | -17,96 | ||||
| 2026-01-26 | 13F | Key Capital Management, INC | 3 | 1 | ||||||
| 2026-02-13 | 13F | FORA Capital, LLC | 0 | -100,00 | 0 | |||||
| 2025-10-08 | 13F | Country Club Bank /gfn | 2.277 | 0,00 | 696 | -3,73 | ||||
| 2025-11-05 | 13F | Anthracite Investment Company, Inc. | 0 | -100,00 | 0 | -100,00 | ||||
| 2026-01-30 | 13F | Activest Wealth Management | 0 | -100,00 | 0 | |||||
| 2025-10-07 | 13F | Carolina Wealth Advisors, LLC | 0 | -100,00 | 0 | |||||
| 2026-01-21 | 13F | Talbot Financial, LLC | 38.547 | -3,29 | 9.976 | -19,20 | ||||
| 2026-02-04 | 13F | Swiss Life Asset Management Ltd | 25.323 | -5,35 | 6.553 | -20,92 | ||||
| 2026-01-23 | 13F | KG&L Capital Management,LLC | 26.376 | 4,92 | 6.826 | -12,34 | ||||
| 2025-09-26 | NP | SUNAMERICA SERIES TRUST - SA Fidelity Institutional AM International Growth Portfolio Class 1 | 11.781 | 9,74 | 3.384 | -1,69 | ||||
| 2026-02-17 | 13F | Coppell Advisory Solutions LLC | 7.331 | 21,21 | 1.920 | 3,84 | ||||
| 2026-01-09 | 13F | Somerset Trust Co | 2.026 | 0,00 | 524 | -16,43 | ||||
| 2026-02-09 | 13F | MQS Management LLC | 1.498 | 388 | ||||||
| 2026-02-11 | 13F | Harvest Fund Management Co., Ltd | 0 | -100,00 | 0 | |||||
| 2026-02-03 | 13F | Gateway Investment Advisers Llc | 184.154 | 0,36 | 47.657 | -16,15 | ||||
| 2026-02-10 | 13F | Root Financial Partners, LLC | 275 | 16,03 | 71 | -2,74 | ||||
| 2025-11-14 | 13F | Eqis Capital Management, Inc. | 0 | -100,00 | 0 | |||||
| 2026-01-23 | 13F | Steigerwald, Gordon & Koch Inc. | 264 | 32,00 | 68 | 11,48 | ||||
| 2025-09-29 | NP | HCMT - Direxion HCM Tactical Enhanced US ETF | 1.906 | 24,41 | 547 | 11,41 | ||||
| 2026-02-09 | 13F | Allen Capital Group, LLC | 1.895 | 2,54 | 490 | -14,34 | ||||
| 2026-02-12 | 13F | von Borstel & Associates, Inc. | 0 | -100,00 | 0 | |||||
| 2026-02-10 | 13F | Anchor Capital Advisors Llc | 145.548 | 0,92 | 37.666 | -15,69 | ||||
| 2025-11-14 | 13F | Binnacle Investments Inc | 102 | -0,97 | 32 | -3,12 | ||||
| 2026-02-17 | 13F | Lombard Odier Asset Management (Switzerland) SA | 0 | -100,00 | 0 | |||||
| 2026-02-12 | 13F | Commonwealth Equity Services, Llc | 36.181 | -9,90 | 9.363 | 77.925,00 | ||||
| 2026-01-27 | 13F | Regions Financial Corp | 348.547 | -2,33 | 90.200 | -18,40 | ||||
| 2026-02-10 | 13F | Nelson Capital Management, LLC | 13.087 | -1,92 | 3.387 | -18,05 | ||||
| 2025-11-12 | 13F | Marsico Capital Management Llc | 0 | -100,00 | 0 | |||||
| 2025-09-25 | NP | BBLIX - BBH Select Series - Large Cap Fund Class I Shares | 58.833 | 0,00 | 16.900 | -10,43 | ||||
| 2026-02-12 | 13F | Litman Gregory Asset Management LLC | 2 | 1 | ||||||
| 2026-02-17 | 13F | Raymond James Financial Inc | 536.685 | -10,20 | 138.889 | -24,97 | ||||
| 2026-02-17 | 13F | Mercer Global Advisors Inc /adv | 155.398 | 54,29 | 40.436 | 29,62 | ||||
| 2026-01-05 | 13F | Park National Corp /oh/ | 2.763 | 0,00 | 715 | -16,37 | ||||
| 2026-02-13 | 13F | Kestra Advisory Services, LLC | 0 | -100,00 | 0 | |||||
| 2026-01-30 | 13F | Oakworth Capital, Inc. | 1.586 | 0,00 | 410 | -16,50 | ||||
| 2026-02-13 | 13F | Ostrum Asset Management | 6.925 | -24,89 | 1.792 | -37,23 | ||||
| 2025-11-20 | 13F | Maven Securities LTD | Put | 0 | -100,00 | 0 | -100,00 | |||
| 2026-02-17 | 13F | Creative Planning | 86.321 | 19,87 | 22.339 | 0,15 | ||||
| 2026-02-04 | 13F | C WorldWide Group Holding A/S | 9.224 | 0,00 | 2 | 0,00 | ||||
| 2026-01-23 | 13F | Assetmark, Inc | 73.376 | 0,14 | 18.989 | -16,33 | ||||
| 2026-02-03 | 13F | Sigma Investment Counselors Inc | 32.681 | -1,85 | 8.457 | -18,00 | ||||
| 2025-11-07 | 13F | BOK Financial Private Wealth, Inc. | 0 | -100,00 | 0 | -100,00 | ||||
| 2026-01-20 | 13F | Thurston, Springer, Miller, Herd & Titak, Inc. | 169 | 668,18 | 44 | 616,67 | ||||
| 2025-09-26 | NP | TISPX - TIAA-CREF S&P 500 Index Fund Institutional Class | 53.963 | -0,86 | 15.501 | -11,21 | ||||
| 2026-02-06 | 13F | Resona Asset Management Co.,Ltd. | 91.323 | -8,63 | 23.694 | -23,34 | ||||
| 2026-02-06 | 13F | McKinley Carter Wealth Services, Inc. | 32.335 | -0,13 | 8.368 | -16,55 | ||||
| 2026-01-21 | 13F | Newbridge Financial Services Group, Inc. | 3 | 0,00 | 1 | |||||
| 2025-09-26 | NP | FEOPX - Fidelity Enduring Opportunities Fund This fund is a listed as child fund of Fmr Llc and if that institution has disclosed ownership in this security, then these positions will not be double counted when calculating total shares and total value | 159 | -8,62 | 46 | -18,18 | ||||
| 2026-02-20 | 13F | Kovitz Investment Group Partners, LLC | 4.352 | -99,02 | 1.126 | -99,18 | ||||
| 2025-11-14 | 13F | Qube Research & Technologies Ltd | 0 | -100,00 | 0 | -100,00 | ||||
| 2026-02-10 | 13F | Fiduciary Family Office, Llc | 861 | -46,55 | 223 | -55,42 | ||||
| 2026-02-17 | 13F | Cetera Investment Advisers | 90.383 | -15,07 | 23.390 | -29,04 | ||||
| 2025-09-24 | NP | BlackRock ETF Trust - Blackrock Future U.S. Themes ETF This fund is a listed as child fund of BlackRock, Inc. and if that institution has disclosed ownership in this security, then these positions will not be double counted when calculating total shares and total value | 18.924 | 607,97 | 5.436 | 534,19 | ||||
| 2026-01-16 | 13F | Catalina Capital Group, LLC | 0 | -100,00 | 0 | |||||
| 2026-01-21 | 13F | SJS Investment Consulting Inc. | 121 | 7,08 | 31 | -11,43 | ||||
| 2026-01-20 | 13F | Aspiriant, Llc | 0 | -100,00 | 0 | |||||
| 2026-02-03 | 13F | Farmers & Merchants Investments Inc | 146 | 0,00 | 38 | -17,78 | ||||
| 2026-01-28 | 13F | Arizona State Retirement System | 72.211 | -3,53 | 18.687 | -19,40 | ||||
| 2026-02-13 | 13F | Public Sector Pension Investment Board | 0 | -100,00 | 0 | |||||
| 2026-02-12 | 13F | Keel Point, LLC | 1.092 | -16,83 | 283 | -30,54 | ||||
| 2026-02-12 | 13F | IFC & Insurance Marketing, Inc. | 24 | 0 | ||||||
| 2026-01-08 | 13F | GuoLine Advisory Pte Ltd | 52.400 | 13.561 | ||||||
| 2026-01-16 | 13F | Tema Etfs Llc | 3.850 | -0,21 | 996 | -16,58 | ||||
| 2026-01-28 | 13F | Proathlete Wealth Management Llc | 467 | 0,00 | 121 | -16,67 | ||||
| 2026-02-13 | 13F | Banco Santander, S.A. | 1.983 | 4,64 | 513 | -12,46 | ||||
| 2026-01-15 | 13F | Fifth Third Wealth Advisors LLC | 2.731 | -9,81 | 707 | -24,65 | ||||
| 2026-02-10 | 13F | Moors & Cabot, Inc. | 1.016 | 16,51 | 263 | -2,96 | ||||
| 2026-02-17 | 13F | BTG Pactual Asset Management US LLC | 2.674 | -22,36 | 692 | -35,08 | ||||
| 2025-09-25 | NP | TAAAX - Thrivent Aggressive Allocation Fund Class A | 4.221 | -10,80 | 1.212 | -20,11 | ||||
| 2026-02-11 | 13F | West Family Investments, Inc. | 1.174 | -7,27 | 304 | -22,70 | ||||
| 2026-02-23 | 13F | Wealth Preservation Advisors, LLC | 6 | -14,29 | 2 | -50,00 | ||||
| 2026-01-30 | 13F | Us Bancorp \de\ | 78.277 | -3,13 | 20.260 | -19,06 | ||||
| 2026-02-06 | 13F | Creative Financial Designs Inc /adv | 34 | -2,86 | 9 | -20,00 | ||||
| 2026-02-17 | 13F | Advisor Group Holdings, Inc. | 39.938 | -65,27 | 10.350 | -70,84 | ||||
| 2026-02-10 | 13F | Axq Capital, Lp | 0 | -100,00 | 0 | |||||
| 2026-01-20 | 13F | Independence Bank of Kentucky | 9 | 2 | ||||||
| 2026-02-17 | 13F | First Manhattan Co | 22.087 | -17,35 | 5.716 | -30,95 | ||||
| 2026-01-22 | 13F | Personal Cfo Solutions, Llc | 2.239 | 8,22 | 579 | -9,53 | ||||
| 2025-09-26 | NP | TIEIX - TIAA-CREF Equity Index Fund Institutional Class | 218.219 | 0,00 | 62.683 | -10,43 | ||||
| 2026-02-11 | 13F | Sunrise Financial Services, LLC | 95 | 24 | ||||||
| 2026-01-20 | 13F | Trust Co Of Toledo Na /oh/ | 12.518 | 0,00 | 3.240 | -16,46 | ||||
| 2026-02-13 | 13F | Northwest Bancshares, Inc. | 917 | 0,00 | 237 | -16,55 | ||||
| 2026-03-16 | 13F | Bank of New Hampshire | 2.000 | -13,04 | 518 | -27,39 | ||||
| 2025-09-29 | NP | AWYIX - CIBC ATLAS EQUITY INCOME FUND Institutional Class Shares | 11.427 | -16,11 | 3.282 | -24,86 | ||||
| 2026-02-13 | 13F | Brant Point Investment Management Llc | Put | 300 | 7.764 | |||||
| 2025-11-14 | 13F | ICONIQ Capital, LLC | 0 | -100,00 | 0 | |||||
| 2026-02-13 | 13F | Brant Point Investment Management Llc | 35.072 | 0,00 | 9.076 | -16,45 | ||||
| 2026-01-21 | 13F | Sowell Financial Services LLC | 1.382 | -15,99 | 358 | -29,86 | ||||
| 2025-11-20 | 13F | Maven Securities LTD | 0 | -100,00 | 0 | -100,00 | ||||
| 2026-02-11 | 13F | Fiera Capital Corp | 160.603 | -8,72 | 41.562 | -23,74 | ||||
| 2026-01-20 | 13F | Signaturefd, Llc | 4.170 | -6,92 | 1.079 | -22,21 | ||||
| 2026-01-21 | 13F | Raleigh Capital Management Inc. | 1.565 | 0,00 | 405 | -16,53 | ||||
| 2025-11-14 | 13F | Gillson Capital LP | 0 | -100,00 | 0 | |||||
| 2025-11-12 | 13F | Kaizen Financial Strategies | 0 | -100,00 | 0 | |||||
| 2026-02-17 | 13F | Freestone Grove Partners LP | 3.150 | -97,16 | 815 | -97,63 | ||||
| 2026-02-13 | 13F | Sands Capital Management, Llc | 244.255 | -77,67 | 63.211 | -81,35 | ||||
| 2025-09-25 | NP | DGRO - iShares Core Dividend Growth ETF | 155.152 | 17,58 | 44.567 | 5,32 | ||||
| 2026-02-05 | 13F | High Note Wealth, LLC | 76 | 4,11 | 20 | -13,64 | ||||
| 2026-02-11 | 13F | Jpmorgan Chase & Co | 20.313.249 | -0,12 | 5.256.867 | -16,55 | ||||
| 2025-10-20 | 13F | Security National Bank | 0 | -100,00 | 0 | |||||
| 2026-02-10 | 13F | Argent Trust Co | 4.067 | -4,46 | 1.052 | -20,18 | ||||
| 2026-02-24 | 13F | MidFirst Bank | 1.209 | 313 | ||||||
| 2026-01-20 | 13F | Stratos Wealth Partners, LTD. | 24.535 | 2,72 | 6.350 | -14,18 | ||||
| 2026-01-29 | 13F | D.a. Davidson & Co. | 3.430 | 17,06 | 888 | -2,21 | ||||
| 2025-09-26 | NP | RTDAX - Multifactor U.S. Equity Fund Class A | 1.363 | 48,96 | 392 | 33,45 | ||||
| 2026-02-17 | 13F | Northern Trust Corp | 2.230.272 | -3,76 | 577.172 | -19,59 | ||||
| 2026-02-13 | 13F | Toroso Investments, LLC | 5.673 | -34,54 | 1.468 | -45,31 | ||||
| 2026-02-11 | 13F | Rise Advisors, LLC | 0 | -100,00 | 0 | |||||
| 2026-02-13 | 13F | Neuberger Berman Group LLC | 12.397 | -2,49 | 3.208 | -18,54 | ||||
| 2026-02-12 | 13F | Lansforsakringar Fondforvaltning AB (publ) | 82.234 | 1,07 | 21.281 | -15,55 | ||||
| 2026-02-10 | 13F | Peapack Gladstone Financial Corp | 1.128 | -94,98 | 0 | -100,00 | ||||
| 2025-09-26 | NP | TOV - JLens 500 Jewish Advocacy U.S. ETF | 734 | 16,14 | 211 | 3,96 | ||||
| 2026-01-12 | 13F | Kozak & Associates, Inc. | 674 | 0,15 | 178 | 2,30 | ||||
| 2026-01-26 | 13F | KBC Group NV | 143.679 | -8,32 | 37 | -22,92 | ||||
| 2025-09-26 | NP | FMTM - MarketDesk Focused U.S. Momentum ETF | 0 | -100,00 | 0 | -100,00 | ||||
| 2025-10-08 | 13F/A | Simon Quick Advisors, Llc | 0 | -100,00 | 0 | |||||
| 2026-02-11 | 13F | Cookson Peirce & Co Inc | 1.410 | -18,83 | 365 | -32,34 | ||||
| 2026-02-17 | 13F | Snowden Capital Advisors LLC | 2.639 | -12,90 | 683 | -27,29 | ||||
| 2026-01-08 | 13F | NorthCrest Asset Manangement, LLC | 2.083 | -20,04 | 548 | -32,09 | ||||
| 2026-02-17 | 13F | IHT Wealth Management, LLC | 0 | -100,00 | 0 | |||||
| 2026-02-17 | 13F | Titan Wealth (CI) Ltd | 41 | 11 | ||||||
| 2026-01-23 | 13F | Bellevue Asset Management, Llc | 8 | 0,00 | 2 | 0,00 | ||||
| 2025-09-26 | NP | FCPAX - Fidelity Advisor International Capital Appreciation Fund Class A This fund is a listed as child fund of Fmr Llc and if that institution has disclosed ownership in this security, then these positions will not be double counted when calculating total shares and total value | 677.686 | 63,49 | 194.665 | 46,44 | ||||
| 2026-02-09 | 13F | Shufro Rose & Co Llc | 1.400 | 0,00 | 362 | -25,05 | ||||
| 2026-02-13 | 13F | Sei Investments Co | 212.544 | 3,76 | 55.005 | -13,31 | ||||
| 2025-10-21 | 13F | Intelligent Financial Strategies | 0 | -100,00 | 0 | |||||
| 2026-02-17 | 13F | Woodline Partners LP | 535.602 | 138.608 | ||||||
| 2026-01-26 | 13F | Paradigm Financial Partners, Llc | 0 | -100,00 | 0 | |||||
| 2026-02-11 | 13F | Simplex Trading, Llc | Call | 10.100 | -77,25 | 2.614 | 20.000,00 | |||
| 2026-02-11 | 13F | Simplex Trading, Llc | Put | 38.400 | 141,51 | 9.938 | 248.325,00 | |||
| 2025-10-09 | 13F | Compton Wealth Advisory Group, LLC | 0 | -100,00 | 0 | |||||
| 2025-11-14 | 13F | Quantessence Capital LLC | 0 | -100,00 | 0 | |||||
| 2026-02-05 | 13F | Northwestern Mutual Investment Management Company, Llc | 8.206 | 0,44 | 2.124 | -16,09 | ||||
| 2025-10-30 | 13F | Accredited Investors Inc. | 0 | -100,00 | 0 | -100,00 | ||||
| 2026-02-04 | 13F | Advisor OS, LLC | 3.791 | -8,34 | 981 | -23,42 | ||||
| 2026-01-28 | 13F | Torray Llc | 23.180 | -4,95 | 5.999 | -20,59 | ||||
| 2026-01-09 | 13F | Carderock Capital Management Inc | 0 | -100,00 | 0 | |||||
| 2026-02-09 | 13F | Legal & General Group Plc | 1.369.877 | -1,14 | 354.510 | -17,40 | ||||
| 2026-02-06 | 13F | HighTower Advisors, LLC | 50.929 | -23,23 | 13.180 | -35,92 | ||||
| 2026-02-13 | 13F | Financial Network Wealth Advisors LLC | 407 | 20,41 | 105 | 0,96 | ||||
| 2026-02-13 | 13F | L2 Asset Management, LLC | 1.283 | 7,36 | 332 | -10,27 | ||||
| 2025-09-26 | NP | DAACX - Diversified Equity Fund | 902 | -34,06 | 259 | -37,14 | ||||
| 2026-02-05 | 13F | Center for Financial Planning, Inc. | 1.223 | 16,37 | 317 | -2,77 | ||||
| 2026-01-20 | 13F | Savvy Advisors, Inc. | 1.402 | 13,52 | 363 | -5,24 | ||||
| 2026-02-04 | 13F | Boston Private Wealth Llc | 5.284 | -57,31 | 1.368 | -64,35 | ||||
| 2025-09-26 | NP | SUNAMERICA SERIES TRUST - SA JPMorgan Global Equities Portfolio Class 1 | 3.400 | 977 | ||||||
| 2026-01-23 | 13F | Patton Fund Management, Inc. | 950 | 39,09 | 246 | 16,11 | ||||
| 2026-01-08 | 13F | True Wealth Design, LLC | 7 | -30,00 | 2 | -50,00 | ||||
| 2026-02-10 | 13F | Bnp Paribas Arbitrage, Sa | 477.105 | 36,93 | 123.470 | 14,41 | ||||
| 2026-01-27 | 13F | Forum Financial Management, LP | 2.785 | 9,43 | 721 | -8,63 | ||||
| 2026-02-03 | 13F | Koshinski Asset Management, Inc. | 1.216 | -3,42 | 315 | -19,28 | ||||
| 2026-01-26 | 13F | Parcion Private Wealth LLC | 884 | 3,88 | 229 | -13,31 | ||||
| 2026-02-17 | 13F | Laird Norton Trust Company, Llc | 6.168 | 1.596 | ||||||
| 2026-01-28 | 13F | North Point Portfolio Managers Corp/oh | 67.595 | 0,39 | 17.493 | -16,12 | ||||
| 2026-02-17 | 13F | Kemnay Advisory Services Inc. | 102 | 26 | ||||||
| 2025-11-14 | 13F | PineBridge Investments, L.P. | 4.415 | -67,61 | 1.368 | -68,66 | ||||
| 2026-02-14 | 13F | Frec Markets, Inc. | 1.209 | 313 | ||||||
| 2026-02-13 | 13F | Mml Investors Services, Llc | 177.329 | 0,81 | 45.891 | -15,77 | ||||
| 2026-02-13 | 13F | Healthcare Of Ontario Pension Plan Trust Fund | 22.651 | -60,71 | 5.862 | -67,18 | ||||
| 2026-01-12 | 13F | CVA Family Office, LLC | 183 | 84,85 | 47 | 56,67 | ||||
| 2026-02-14 | 13F | Howe & Rusling Inc | 921 | 238 | ||||||
| 2026-01-27 | 13F | Journey Advisory Group, LLC | 16.945 | -10,36 | 4.385 | -25,09 | ||||
| 2026-02-13 | 13F | Kcm Investment Advisors Llc | 1.145 | 1,60 | 296 | -15,19 | ||||
| 2025-11-14 | 13F | Alpine Global Management, LLC | 0 | -100,00 | 0 | |||||
| 2026-02-10 | 13F | Intech Investment Management Llc | 11.488 | -18,07 | 2.973 | -31,55 | ||||
| 2026-02-10 | 13F | DT Investment Partners, LLC | 152 | 0,00 | 39 | -17,02 | ||||
| 2026-01-12 | 13F | VisionPoint Advisory Group, LLC | 853 | -23,36 | 221 | -36,05 | ||||
| 2025-10-30 | 13F | Avidian Wealth Solutions, LLC | 0 | -100,00 | 0 | |||||
| 2026-02-13 | 13F | Seneschal Advisors, LLC | 2 | 0,00 | 1 | |||||
| 2026-02-12 | 13F | Triumph Capital Management | 3 | -83,33 | 1 | -100,00 | ||||
| 2026-01-23 | 13F | Aspect Partners, LLC | 31 | 19,23 | 8 | 0,00 | ||||
| 2025-11-14 | 13F | Axiom International Investors Llc /de | 0 | -100,00 | 0 | |||||
| 2026-01-29 | 13F | Teachers Retirement System Of The State Of Kentucky | 46.507 | 3,86 | 12 | -7,69 | ||||
| 2026-02-02 | 13F | Truist Financial Corp | 108.143 | -3,97 | 27.986 | -19,76 | ||||
| 2025-09-25 | NP | DFSU - Dimensional US Sustainability Core 1 ETF | 3.893 | 13,07 | 1.118 | 1,27 | ||||
| 2026-02-02 | 13F | Truist Financial Corp | Put | 10.000 | 0,00 | 2.588 | -16,47 | |||
| 2025-10-24 | 13F | Opal Wealth Advisors, LLC | 0 | -100,00 | 0 | |||||
| 2026-01-29 | 13F | Financial Life Planners | 0 | -100,00 | 0 | |||||
| 2025-09-26 | NP | QRFT - QRAFT AI-Enhanced U.S. Large Cap ETF | 58 | -19,44 | 17 | -30,43 | ||||
| 2026-02-03 | 13F | Generali Asset Management SPA SGR | 2.276 | -11,27 | 589 | -25,82 | ||||
| 2026-01-09 | 13F | BOS Asset Management, LLC | 808 | 0,00 | 209 | -16,40 | ||||
| 2026-02-05 | 13F | Atria Investments Llc | 17.874 | -16,91 | 4.626 | -30,59 | ||||
| 2025-09-26 | NP | FDMO - Fidelity Momentum Factor ETF This fund is a listed as child fund of Fmr Llc and if that institution has disclosed ownership in this security, then these positions will not be double counted when calculating total shares and total value | 8.874 | 78,80 | 2.549 | 118,99 | ||||
| 2026-02-03 | 13F | RFG Advisory, LLC | 4.839 | -37,24 | 1.252 | -47,55 | ||||
| 2026-02-12 | 13F | StoneX Group Inc. | 3.364 | 417,54 | 871 | 332,84 | ||||
| 2026-02-17 | 13F | Bank Of America Corp /de/ | Put | 0 | -100,00 | 0 | ||||
| 2026-01-15 | 13F | Westend Capital Management LLC | 7 | 2 | ||||||
| 2025-10-16 | 13F | VCI Wealth Management LLC | 0 | -100,00 | 0 | |||||
| 2026-02-11 | 13F | Vestor Capital, Llc | 3.679 | 79,90 | 1 | |||||
| 2026-01-09 | 13F | Dynamic Advisor Solutions LLC | 1.745 | -3,06 | 451 | -19,03 | ||||
| 2026-02-05 | 13F | Bessemer Group Inc | 14.191 | -97,34 | 4 | -98,18 | ||||
| 2026-02-10 | 13F | Syntegra Private Wealth Group, LLC | 1.132 | -9,29 | 293 | -24,35 | ||||
| 2026-02-13 | 13F | Potomac Fund Management Inc /adv | 5.848 | 5,81 | 1.513 | -11,62 | ||||
| 2026-01-28 | 13F | Philo Smith Capital Corp | 87.725 | 12,87 | 22.702 | -5,70 | ||||
| 2026-02-12 | 13F | Swiss National Bank | 702.620 | -4,83 | 181.831 | -20,49 | ||||
| 2026-02-10 | 13F | Commonwealth Of Pennsylvania Public School Empls Retrmt Sys | 59.734 | -2,97 | 15.459 | -18,93 | ||||
| 2026-01-16 | 13F | Marino, Stram & Associates Llc | 3.605 | -3,76 | 933 | -19,66 | ||||
| 2026-02-17 | 13F | Cape Investment Advisory, Inc. | 100 | 316,67 | 26 | 257,14 | ||||
| 2026-02-12 | 13F | Advocate Investing Services LLC | 33 | 9 | ||||||
| 2026-02-17 | 13F | Berkshire Bank | 0 | -100,00 | 0 | |||||
| 2026-02-09 | 13F | Atlantic Trust, LLC | 245 | 295,16 | 63 | 231,58 | ||||
| 2026-02-13 | 13F | Chevy Chase Trust Holdings, Inc. | 131.099 | 0,16 | 33.927 | -16,31 | ||||
| 2025-09-26 | NP | BKLC - BNY Mellon US Large Cap Core Equity ETF | 16.551 | 29,66 | 4.754 | 16,15 | ||||
| 2026-01-28 | 13F | Davis Capital Management | 2 | 0,00 | 1 | |||||
| 2026-02-17 | 13F | Ibex Wealth Advisors | 0 | -100,00 | 0 | |||||
| 2026-02-04 | 13F | Oxbow Advisors, LLC | 14.320 | -0,72 | 3.706 | -17,06 | ||||
| 2026-02-10 | 13F | Shepherd Street Advisors LLC | 2.165 | 560 | ||||||
| 2026-01-15 | 13F | Capital Advisors Inc/ok | 1.003 | -0,10 | 260 | -16,45 | ||||
| 2025-11-13 | 13F | Promus Capital, LLC | 3.780 | 2,27 | 1.171 | -1,10 | ||||
| 2026-02-06 | 13F | Banque Cantonale Vaudoise | 0 | -100,00 | 0 | |||||
| 2026-02-10 | 13F | Central Securities Corp | 105.000 | 0,00 | 27.173 | -16,45 | ||||
| 2026-02-11 | 13F | Inceptionr Llc | 4.005 | 151,25 | 1.036 | 110,14 | ||||
| 2026-02-11 | 13F | Dearborn Partners Llc | 133.936 | 6,31 | 34.661 | -11,18 | ||||
| 2026-01-12 | 13F | Contravisory Investment Management, Inc. | 0 | -100,00 | 0 | -100,00 | ||||
| 2026-01-12 | 13F | Avanza Fonder AB | 24.193 | 18,79 | 6.261 | -0,76 | ||||
| 2026-01-16 | 13F | Crewe Advisors LLC | 33 | 0,00 | 8 | -20,00 | ||||
| 2026-02-05 | 13F | Avantax Planning Partners, Inc. | 1.875 | -0,05 | 485 | -16,38 | ||||
| 2025-09-24 | NP | BlackRock ETF Trust - BlackRock U.S. Industry Rotation ETF This fund is a listed as child fund of BlackRock, Inc. and if that institution has disclosed ownership in this security, then these positions will not be double counted when calculating total shares and total value | 221 | 116,67 | 63 | 96,88 | ||||
| 2026-02-09 | 13F | Wcm Investment Management, Llc | 2.380.294 | -2,13 | 623.232 | -16,17 | ||||
| 2025-09-26 | NP | PDAVX - PineBridge Dynamic Asset Allocation Fund Investor Servicing Shares | 178 | -36,43 | 51 | -42,70 | ||||
| 2026-02-11 | 13F | CenterBook Partners LP | 2.007 | 519 | ||||||
| 2026-01-22 | 13F | Ifrah Financial Services, Inc. | 1.449 | -0,75 | 375 | -17,26 | ||||
| 2026-02-23 | 13F | Mv Capital Management, Inc. | 132 | -6,38 | 34 | -24,44 | ||||
| 2026-02-17 | 13F | Credit Agricole S A | 306.388 | -0,46 | 79.290 | -16,83 | ||||
| 2025-11-17 | 13F | Silicon Valley Capital Partners | 0 | -100,00 | 0 | -100,00 | ||||
| 2025-09-26 | NP | ULPIX - Ultrabull Profund Investor Class | 572 | 12,82 | 164 | 1,23 | ||||
| 2026-02-11 | 13F | Lifestyle Asset Management, Inc. | 1.189 | 1,97 | 308 | -14,96 | ||||
| 2026-02-12 | 13F | Cincinnati Financial Corp | 186.259 | 34,72 | 48.202 | 12,56 | ||||
| 2026-02-13 | 13F | Elwood Capital Partners Lp | 5.000 | 1.294 | ||||||
| 2026-02-12 | 13F | Xponance, Inc. | 40.491 | 6,02 | 10.479 | -11,42 | ||||
| 2025-09-26 | NP | INVESCO ACTIVELY MANAGED EXCHANGE-TRADED FUND TRUST - Invesco S&P 500 Equal Weight Income Advantage ETF | 1.956 | 39,42 | 562 | 24,94 | ||||
| 2026-01-15 | 13F | Lodestone Wealth Management LLC | 123 | 32 | ||||||
| 2026-02-25 | 13F | Kw Wealth Management Llc | 0 | -100,00 | 0 | |||||
| 2026-02-13 | 13F | Bollard Group LLC | 11.799 | -2,79 | 3 | 0,00 | ||||
| 2026-01-21 | 13F | Y.D. More Investments Ltd | 185 | -9,31 | 0 | |||||
| 2026-02-12 | 13F | Penserra Capital Management LLC | 1.403 | -0,07 | 0 | |||||
| 2026-02-11 | 13F | Allianz Asset Management GmbH | 394.219 | -30,91 | 102.020 | -42,27 | ||||
| 2026-02-13 | 13F | Pinnacle Wealth Planning Services, Inc. | 6.224 | -11,64 | 1.611 | -26,18 | ||||
| 2025-11-13 | 13F | Eschler Asset Management LLP | 0 | -100,00 | 0 | |||||
| 2026-01-28 | 13F | Old National Bancorp /in/ | 0 | -100,00 | 0 | |||||
| 2026-02-11 | 13F | Allianz Asset Management GmbH | Put | 12.200 | 24,49 | 3.157 | 4,02 | |||
| 2026-02-11 | 13F | EULAV Asset Management | 25.400 | 0,00 | 6.573 | -16,45 | ||||
| 2026-02-11 | 13F | Allianz Asset Management GmbH | Call | 8.000 | 77,78 | 2.070 | 48,60 | |||
| 2026-02-17 | 13F | Dark Forest Capital Management Lp | 0 | -100,00 | 0 | -100,00 | ||||
| 2026-02-17 | 13F | Capstone Investment Advisors, Llc | 0 | -100,00 | 0 | -100,00 | ||||
| 2025-10-21 | 13F | Brown Miller Wealth Management, LLC | 0 | -100,00 | 0 | |||||
| 2025-11-14 | 13F | Occudo Quantitative Strategies Lp | 0 | -100,00 | 0 | |||||
| 2026-02-06 | 13F | Vestmark Advisory Solutions, Inc. | 4.754 | -63,22 | 1.230 | -69,27 | ||||
| 2025-09-29 | NP | UPSD - Aptus Large Cap Upside ETF | 2.251 | 104,08 | 647 | 83,00 | ||||
| 2026-01-27 | 13F | MASTERINVEST Kapitalanlage GmbH | 1.013 | 0,00 | 265 | -15,34 | ||||
| 2026-01-30 | 13F | State of New Jersey Common Pension Fund D | 88.298 | -1,39 | 22.851 | -17,61 | ||||
| 2025-09-24 | NP | PLFMX - LargeCap S&P 500 Index Fund R-3 | 44.280 | -1,18 | 12.719 | -11,49 | ||||
| 2026-02-04 | 13F | Tsfg, Llc | 0 | -100,00 | 0 | |||||
| 2026-02-10 | 13F | Lido Advisors, LLC | 8.558 | -11,24 | 2.607 | -12,73 | ||||
| 2026-02-03 | 13F | K.J. Harrison & Partners Inc | 1.004 | 260 | ||||||
| 2026-02-02 | 13F | Chung Wu Investment Group, LLC | 0 | -100,00 | 0 | |||||
| 2026-02-12 | 13F | JPL Wealth Management, LLC | 0 | -100,00 | 0 | |||||
| 2026-02-17 | 13F | Quantitative Investment Management, LLC | 8.208 | 372,27 | 2 | |||||
| 2025-09-24 | NP | TOK - iShares MSCI Kokusai ETF | 795 | 4,33 | 228 | -6,56 | ||||
| 2026-01-29 | 13F | Directional Asset Management | 4.911 | 1.271 | ||||||
| 2026-02-17 | 13F | Keebeck Wealth Management, LLC | 15.468 | -6,25 | 4.003 | -21,68 | ||||
| 2026-02-02 | 13F | Robertson Stephens Wealth Management, LLC | 1.857 | 481 | ||||||
| 2026-01-08 | 13F | Occidental Asset Management, LLC | 2.960 | 1,09 | 766 | -15,45 | ||||
| 2026-02-11 | 13F | PBU - The Pension Fund of Early Childhood & Youth Educators | 36.233 | 9.377 | ||||||
| 2026-01-30 | 13F | Ares Financial Consulting, LLC | 15 | 4 | ||||||
| 2026-02-18 | 13F | EP Wealth Advisors, Inc. | 3.219 | -49,46 | 833 | -59,13 | ||||
| 2025-09-26 | NP | AIM EQUITY FUNDS (INVESCO EQUITY FUNDS) - Invesco Oppenheimer Main Street Fund Class C | 373.958 | 22,74 | 107.419 | 9,94 | ||||
| 2025-09-26 | NP | FEQHX - Fidelity Hedged Equity Fund | 4.834 | -7,25 | 1.389 | -16,94 | ||||
| 2025-09-24 | NP | SWLGX - Schwab U.S. Large-Cap Growth Index Fund This fund is a listed as child fund of Charles Schwab Investment Management Inc and if that institution has disclosed ownership in this security, then these positions will not be double counted when calculating total shares and total value | 2.029 | 0,00 | 583 | -10,46 | ||||
| 2026-02-13 | 13F | Towarzystwo Funduszy Inwestycyjnych Pzu Sa | 0 | -100,00 | 0 | |||||
| 2026-02-12 | 13F | Steward Partners Investment Advisory, Llc | 7.424 | 15,44 | 1.921 | -3,56 | ||||
| 2026-02-12 | 13F | Voya Investment Management Llc | 136.262 | -0,16 | 35.263 | -16,58 | ||||
| 2026-01-26 | 13F | Whittier Trust Co Of Nevada Inc | 3.928 | -0,05 | 1.032 | -15,41 | ||||
| 2026-02-13 | 13F | Ossiam | 0 | -100,00 | 0 | |||||
| 2025-10-21 | 13F | DMKC Advisory Services, LLC | 0 | -100,00 | 0 | |||||
| 2026-02-05 | 13F | Baader Bank INC | 0 | -100,00 | 0 | |||||
| 2026-02-06 | 13F | Larson Financial Group LLC | 233 | -41,90 | 60 | -51,61 | ||||
| 2025-09-29 | NP | RSP - Invesco S&P 500 Equal Weight ETF This fund is a listed as child fund of Invesco Ltd. and if that institution has disclosed ownership in this security, then these positions will not be double counted when calculating total shares and total value | 451.809 | 4,33 | 129.782 | -6,55 | ||||
| 2026-01-22 | 13F | Maseco Llp | 1 | 0 | ||||||
| 2026-01-23 | 13F | Trust Co Of Virginia /va | 1.343 | 0,00 | 348 | -16,39 | ||||
| 2026-01-29 | 13F | Calamos Advisors LLC | 85.528 | -3,51 | 22.134 | -19,38 | ||||
| 2026-02-02 | 13F | Cerro Pacific Wealth Advisors LLC | 1.157 | 6,54 | 299 | -11,01 | ||||
| 2026-02-09 | 13F | Kingsview Wealth Management, LLC | 1.418 | -2,00 | 367 | -18,30 | ||||
| 2026-02-06 | 13F | First Business Financial Services, Inc. | 1.037 | 0,00 | 268 | -16,51 | ||||
| 2026-01-14 | 13F | Pathway Financial Advisors LLC | 2.100 | 0,00 | 552 | -15,23 | ||||
| 2025-09-26 | NP | AIM EQUITY FUNDS (INVESCO EQUITY FUNDS) - Invesco Oppenheimer Main Street All Cap Fund Class R6 | 52.429 | 0,00 | 15.060 | -10,43 | ||||
| 2026-01-26 | 13F | PDS Planning, Inc | 1.064 | -5,17 | 275 | -20,75 | ||||
| 2025-09-23 | NP | MLAAX - MainStay Large Cap Growth Fund Class A | 0 | -100,00 | 0 | -100,00 | ||||
| 2026-02-09 | 13F | New Age Alpha Advisors, LLC | 12.558 | -1,82 | 3.250 | -17,98 | ||||
| 2026-02-13 | 13F | Umb Bank N A/mo | 9.222 | 0,01 | 2.387 | -16,46 | ||||
| 2026-02-06 | 13F | GPS Wealth Strategies Group, LLC | 765 | -77,92 | 198 | -81,62 | ||||
| 2025-10-15 | 13F | Defined Financial Planning LLC | 800 | 0,00 | 246 | -0,41 | ||||
| 2026-01-29 | 13F | Ashton Thomas Private Wealth, LLC | 3.319 | -9,96 | 859 | -24,80 | ||||
| 2025-11-06 | 13F | Plan A Wealth LLC | 0 | -100,00 | 0 | -100,00 | ||||
| 2026-02-13 | 13F | Missouri Trust & Investment Co | 0 | -100,00 | 0 | |||||
| 2026-02-12 | 13F | Grey Fox Wealth Advisors, LLC | 0 | -100,00 | 0 | |||||
| 2025-11-18 | 13F/A | Silvant Capital Management LLC | 0 | -100,00 | 0 | -100,00 | ||||
| 2026-02-06 | 13F | Yanni & Associates Investment Advisors, LLC | 908 | 235 | ||||||
| 2026-01-08 | 13F | Asempa Wealth Advisors | 3.026 | 783 | ||||||
| 2026-02-13 | 13F | Dodge & Cox | 880.585 | 227.887 | ||||||
| 2026-02-17 | 13F | Hilltop Holdings Inc. | 10.253 | -13,78 | 2.653 | -27,97 | ||||
| 2026-02-17 | 13F | Game Creek Capital, LP | 9.000 | -10,00 | 2.329 | -24,80 | ||||
| 2026-02-11 | 13F | Everett Harris & Co /ca/ | 5.032 | 20,73 | 1.302 | 0,93 | ||||
| 2026-02-17 | 13F | Coastal Bridge Advisors, LLC | 5.518 | 20,59 | 1.428 | 0,71 | ||||
| 2026-02-13 | 13F | RFP Financial Group LLC | 1.000 | 0,00 | 259 | -16,50 | ||||
| 2026-01-29 | 13F | UBS Group AG | Call | 11.300 | 5.550,00 | 2.924 | 4.693,44 | |||
| 2026-02-06 | 13F | Cumberland Partners Ltd | 19.022 | -76,97 | 4.923 | -80,76 | ||||
| 2026-01-29 | 13F | UBS Group AG | 1.078.443 | 28,34 | 279.090 | 7,23 | ||||
| 2025-11-14 | 13F | Virtu Financial LLC | 0 | -100,00 | 0 | |||||
| 2026-01-22 | 13F | Massachusetts Financial Services Co /ma/ | 134.912 | -89,88 | 34.914 | -91,55 | ||||
| 2026-01-23 | 13F | Schwab Charitable Fund | 24.290 | -12,80 | 6.286 | -27,14 | ||||
| 2026-02-02 | 13F | Sachetta, LLC | 20 | -41,18 | 5 | -50,00 | ||||
| 2025-11-14 | 13F | Wolverine Trading, Llc | 7.104 | -11,20 | 2.172 | -14,56 | ||||
| 2026-02-06 | 13F/A | Rathbone Brothers plc | 34.349 | -0,15 | 8.889 | -16,57 | ||||
| 2025-11-14 | 13F | Wolverine Trading, Llc | Call | 61.400 | 52,36 | 18.771 | 46,59 | |||
| 2026-02-10 | 13F | Natixis Advisors, L.p. | 313.122 | -6,60 | 81 | -21,36 | ||||
| 2025-11-14 | 13F | Wolverine Trading, Llc | Put | 4.500 | -65,12 | 1.376 | -66,45 | |||
| 2026-02-17 | 13F | Alliancebernstein L.p. | 793.108 | -23,42 | 205.248 | -36,02 | ||||
| 2026-02-12 | 13F | Colonial Trust Advisors | 2.110 | 0,00 | 546 | -16,39 | ||||
| 2026-01-16 | 13F | Trust Co Of Vermont | 1.328 | 0,00 | 344 | -16,55 | ||||
| 2026-02-02 | 13F | Mutual Advisors, LLC | 2.227 | 3,20 | 576 | -5,42 | ||||
| 2026-02-13 | 13F | Quattro Advisors LLC | 2 | 1 | ||||||
| 2026-02-10 | 13F | Connor, Clark & Lunn Investment Management Ltd. | 89.423 | 1.112,84 | 23.142 | 913,62 | ||||
| 2026-02-18 | 13F | GWM Advisors LLC | 43.090 | -79,37 | 11.151 | -82,77 | ||||
| 2026-02-11 | 13F | Jessup Wealth Management, Inc | 40 | 10 | ||||||
| 2025-11-07 | 13F | SMART Wealth LLC | 0 | -100,00 | 0 | |||||
| 2026-02-11 | 13F | Illinois Municipal Retirement Fund | 0 | -100,00 | 0 | -100,00 | ||||
| 2026-02-11 | 13F | Los Angeles Capital Management Llc | 1.152 | -28,98 | 302 | -40,04 | ||||
| 2025-09-26 | NP | ESUM - Eventide US Market ETF | 3.083 | 78,52 | 886 | 60,04 | ||||
| 2026-02-17 | 13F | Sovereign's Capital Management, LLC | 11.074 | -4,93 | 2.866 | -20,57 | ||||
| 2025-09-26 | NP | DSPIX - BNY Mellon Institutional S&P 500 Stock Index Fund Class I | 7.323 | -3,68 | 2.104 | -13,74 | ||||
| 2026-01-28 | 13F | Builder Investment Group Inc /adv | 5.496 | 0,00 | 1.422 | -16,45 | ||||
| 2026-01-12 | 13F | Moody National Bank Trust Division | 4.516 | -35,79 | 1.169 | -46,37 | ||||
| 2026-02-13 | 13F | Pin Oak Investment Advisors Inc | 103 | 0,00 | 0 | -100,00 | ||||
| 2026-02-11 | 13F | Deseret Mutual Benefit Administrators | 289 | 0,00 | 75 | -16,85 | ||||
| 2026-02-13 | 13F | Royal London Asset Management Ltd | 147.765 | -1,87 | 38.240 | -18,01 | ||||
| 2026-01-15 | 13F | Trust Co | 1.043 | 40,76 | 270 | 17,47 | ||||
| 2026-01-28 | 13F | Turtle Creek Wealth Advisors, LLC | 0 | -100,00 | 0 | |||||
| 2026-01-23 | 13F | Bridgewater Advisors Inc. | 941 | 3,29 | 211 | 3,45 | ||||
| 2026-02-12 | 13F | Dimensional Fund Advisors Lp | 805.604 | 15,82 | 208.506 | -3,20 | ||||
| 2026-02-09 | 13F | Cary Street Partners Financial Llc | 224 | -51,41 | 58 | -59,86 | ||||
| 2026-02-17 | 13F | Quantinno Capital Management LP | 117.057 | 14,97 | 30.293 | -3,94 | ||||
| 2026-02-23 | 13F | Beaird Harris Wealth Management, LLC | 74 | -6,33 | 19 | -20,83 | ||||
| 2026-02-17 | 13F | Blair William & Co/il | 88.738 | -21,99 | 22.965 | -34,82 | ||||
| 2026-02-19 | 13F | WealthPoint Financial, LLC | 1.146 | 297 | ||||||
| 2025-09-24 | NP | SNXFX - Schwab 1000 Index Fund This fund is a listed as child fund of Charles Schwab Investment Management Inc and if that institution has disclosed ownership in this security, then these positions will not be double counted when calculating total shares and total value | 83.610 | 0,87 | 24.017 | -9,65 | ||||
| 2026-02-12 | 13F | Bradley Foster & Sargent Inc/ct | 12.832 | -6,42 | 3.321 | -21,83 | ||||
| 2026-02-17 | 13F | Prosperity Consulting Group, LLC | 9.527 | -16,35 | 2.465 | -30,11 | ||||
| 2025-09-25 | NP | BBUS - JPMorgan BetaBuilders U.S. Equity ETF | 23.849 | 11,10 | 6.851 | -0,48 | ||||
| 2026-02-17 | 13F | Price T Rowe Associates Inc /md/ | 567.739 | 43,20 | 147 | 19,67 | ||||
| 2025-11-17 | 13F/A | Proficio Capital Partners LLC | 0 | -100,00 | 0 | -100,00 | ||||
| 2025-09-29 | NP | DUBS - Aptus Large Cap Enhanced Yield ETF | 936 | -1,89 | 269 | -12,13 | ||||
| 2025-10-09 | 13F | Voya Financial Advisors, Inc. | 0 | -100,00 | 0 | |||||
| 2026-02-12 | 13F | Pitcairn Co | 0 | -100,00 | 0 | |||||
| 2025-09-26 | NP | FLVCX - Fidelity Leveraged Company Stock Fund This fund is a listed as child fund of Fmr Llc and if that institution has disclosed ownership in this security, then these positions will not be double counted when calculating total shares and total value | 421.400 | 15,26 | 121.047 | 3,24 | ||||
| 2026-02-13 | 13F | Ceredex Value Advisors LLC | 163.317 | 118,05 | 42.265 | 82,18 | ||||
| 2025-11-13 | 13F | Texas Capital Bancshares Inc/tx | 1.588 | -34,08 | 492 | -36,32 | ||||
| 2026-01-14 | 13F | Wolff Wiese Magana Llc | 1.624 | -13,20 | 420 | -27,46 | ||||
| 2026-01-12 | 13F | Abound Wealth Management | 31 | -20,51 | 8 | -33,33 | ||||
| 2025-09-25 | NP | JGLO - JPMorgan Global Select Equity ETF | 117.090 | 45,59 | 33.634 | 30,41 | ||||
| 2026-01-30 | 13F | Kohmann Bosshard Financial Services, LLC | 51 | 13 | ||||||
| 2026-01-05 | 13F | Legacy Wealth Management, LLC / MS | 13.491 | 28,69 | 3.491 | 7,51 | ||||
| 2025-09-26 | NP | RSEAX - U.S. Strategic Equity Fund Class A | 33.952 | 20,69 | 9.753 | 8,10 | ||||
| 2025-11-14 | 13F | Full Sail Capital, LLC | 2.350 | -10,68 | 728 | -13,66 | ||||
| 2025-09-26 | NP | MSTQX - Morningstar U.S. Equity Fund | 3.964 | -7,75 | 1.139 | -17,42 | ||||
| 2026-01-16 | 13F | Standard Life Aberdeen plc | 184.399 | -1,09 | 47.721 | -16,27 | ||||
| 2026-02-13 | 13F | Arete Wealth Advisors, LLC | 4.396 | 26,72 | 1 | 0,00 | ||||
| 2026-01-07 | 13F | Retirement Wealth Solutions LLC | 103 | 0,00 | 27 | -16,13 | ||||
| 2026-02-13 | 13F | Pathstone Holdings, LLC | 37.713 | -19,40 | 9.760 | -32,65 | ||||
| 2026-02-06 | 13F | EverSource Wealth Advisors, LLC | 2.795 | -19,48 | 723 | -32,74 | ||||
| 2026-02-17 | 13F | Boreal Capital Management LLC | 170 | 0,00 | 44 | -17,31 | ||||
| 2025-09-25 | NP | HELO - JPMorgan Hedged Equity Laddered Overlay ETF | 59.516 | 3,67 | 17.096 | -7,15 | ||||
| 2026-02-05 | 13F | Amalgamated Bank | 47.654 | -3,99 | 12 | -20,00 | ||||
| 2025-10-15 | 13F | Stephens Consulting, LLC | 0 | -100,00 | 0 | -100,00 | ||||
| 2026-02-09 | 13F | Fidelis Capital Partners, LLC | 1.830 | -4,84 | 474 | -20,50 | ||||
| 2026-02-17 | 13F | Private Advisor Group, LLC | 32.899 | 2,62 | 8.514 | -14,26 | ||||
| 2026-01-21 | 13F | Aaron Wealth Advisors LLC | 1.662 | 17,04 | 430 | -2,05 | ||||
| 2026-02-03 | 13F | Broadwater Capital Management Llc | 200 | 0,00 | 52 | -16,39 | ||||
| 2026-02-05 | 13F | Allworth Financial LP | 4.979 | -54,99 | 1.288 | -62,41 | ||||
| 2026-01-28 | 13F | DekaBank Deutsche Girozentrale | 109.639 | 0,00 | 28 | -15,15 | ||||
| 2026-02-09 | 13F/A | Swedbank AB | 93.323 | -0,39 | 24.151 | -16,78 | ||||
| 2026-02-10 | 13F | Rothschild Investment Llc | 1.718 | 3,74 | 445 | -13,28 | ||||
| 2026-02-13 | 13F | PCM Encore, LLC | 2.402 | 621 | ||||||
| 2026-02-17 | 13F | Ameriprise Financial Inc | 238.587 | -0,38 | 61.755 | -16,75 | ||||
| 2026-02-09 | 13F | Old Republic International Corp | 190.800 | 0,00 | 49 | -16,95 | ||||
| 2026-02-13 | 13F | Manufacturers Life Insurance Company, The | 0 | -100,00 | 0 | |||||
| 2026-01-30 | 13F | Bogart Wealth, LLC | 83 | -11,70 | 21 | -27,59 | ||||
| 2025-09-29 | 13F | Summit Financial Wealth Advisors, LLC | 0 | -100,00 | 0 | |||||
| 2026-02-10 | 13F | Resolute Capital, Llc | 1.142 | 295 | ||||||
| 2025-09-25 | NP | DFAU - Dimensional US Core Equity Market ETF | 28.838 | 11,60 | 8.284 | -0,04 | ||||
| 2026-01-30 | 13F | Valued Wealth Advisors LLC | 16 | 0,00 | 4 | 0,00 | ||||
| 2026-02-11 | 13F | J.Safra Asset Management Corp | 3.231 | 2.734,21 | 836 | 2.288,57 | ||||
| 2026-02-06 | 13F | Empirical Asset Management, LLC | 0 | -100,00 | 0 | |||||
| 2026-02-12 | 13F | Johnson Financial Group, Inc. | 872 | -72,63 | 226 | -77,18 | ||||
| 2026-01-26 | 13F | Asset Dedication, LLC | 66 | 0,00 | 17 | -15,00 | ||||
| 2026-01-12 | 13F | E. Ohman J:or Asset Management AB | 9.063 | -18,17 | 2.345 | -31,63 | ||||
| 2026-01-09 | 13F | SG Americas Securities, LLC | 31.215 | 373,67 | 8 | 300,00 | ||||
| 2026-02-12 | 13F | Bank of Jackson Hole Trust | 0 | -100,00 | 0 | |||||
| 2025-11-24 | 13F/A | Fulcrum Asset Management LLP | Put | 0 | -100,00 | 0 | -100,00 | |||
| 2025-10-29 | 13F | McAdam, LLC | 0 | -100,00 | 0 | |||||
| 2025-11-13 | 13F | Qsemble Capital Management, LP | 0 | -100,00 | 0 | -100,00 | ||||
| 2026-02-10 | 13F | Gulf International Bank (UK) Ltd | 12.509 | 0,00 | 3 | 0,00 | ||||
| 2026-01-29 | 13F | Cornerstone National Bank & Trust Co | 129 | 0,00 | 33 | -15,38 | ||||
| 2026-03-05 | 13F | Bayban | 2.000 | 518 | ||||||
| 2025-11-07 | 13F | Beacon Capital Management, LLC | 0 | -100,00 | 0 | |||||
| 2026-02-03 | 13F | Heartland Bank & Trust Co | 2.905 | -1,89 | 752 | -18,10 | ||||
| 2026-01-26 | 13F | Independent Wealth Network Inc. | 915 | 237 | ||||||
| 2026-01-29 | 13F | RMG Wealth Management LLC | 25 | 6 | ||||||
| 2026-02-17 | 13F | Rakuten Investment Management, Inc. | 33.765 | -15,50 | 8.885 | 354,66 | ||||
| 2026-01-20 | 13F | Jackson Wealth Management, LLC | 26.549 | 0,92 | 6.871 | -15,67 | ||||
| 2026-02-12 | 13F | Skopos Labs, Inc. | 7.161 | 65,00 | 1.884 | 36,72 | ||||
| 2025-09-26 | NP | PEOPX - BNY Mellon S&P 500 Index Fund | 11.661 | -1,88 | 3.350 | -12,12 | ||||
| 2026-02-11 | 13F | Capital International Sarl | 151.289 | 46,25 | 39.152 | 22,19 | ||||
| 2025-09-26 | NP | NULV - Nuveen ESG Large-Cap Value ETF | 52.753 | 4.451,60 | 15.153 | 3.984,37 | ||||
| 2026-02-11 | 13F | IMA Wealth, Inc. | 2 | 0,00 | 1 | |||||
| 2026-01-07 | 13F | Everhart Financial Group, Inc. | 0 | -100,00 | 0 | |||||
| 2026-01-12 | 13F | Seacrest Wealth Management, Llc | 1.130 | -16,73 | 293 | -29,81 | ||||
| 2025-11-14 | 13F | WealthTrak Capital Management LLC | 0 | -100,00 | 0 | |||||
| 2025-10-29 | 13F | Triasima Portfolio Management inc. | 0 | -100,00 | 0 | |||||
| 2026-02-12 | 13F | Fortress Private Ledger, Llc | 845 | -21,54 | 219 | -34,53 | ||||
| 2026-02-04 | 13F | KLCM Advisors, Inc. | 1.022 | -0,97 | 264 | -17,24 | ||||
| 2026-02-13 | 13F | Marshall Wace, Llp | 84.329 | 21.824 | ||||||
| 2026-01-20 | 13F | Tritonpoint Wealth, Llc | 0 | -100,00 | 0 | |||||
| 2026-02-18 | 13F/A | Virtue Capital Management, LLC | 3.286 | -97,50 | 841 | -89,25 | ||||
| 2025-09-24 | NP | EIVPX - Parametric Volatility Risk Premium - Defensive Fund Institutional Class | 7.052 | 0,00 | 2.026 | -10,44 | ||||
| 2026-02-05 | 13F | DnB Asset Management AS | 50.255 | 1,46 | 13.005 | -15,23 | ||||
| 2026-02-13 | 13F | Barclays Plc | 674.285 | -16,88 | 174.498 | -30,55 | ||||
| 2026-02-10 | 13F | Telligent Fund, LP | 0 | -100,00 | 0 | |||||
| 2025-09-26 | NP | FLCPX - Fidelity SAI U.S. Large Cap Index Fund This fund is a listed as child fund of Fmr Llc and if that institution has disclosed ownership in this security, then these positions will not be double counted when calculating total shares and total value | 67.044 | -12,07 | 19.258 | -21,24 | ||||
| 2026-01-08 | 13F | Versant Capital Management, Inc | 276 | 7,39 | 71 | -10,13 | ||||
| 2026-01-20 | 13F | Lawson Kroeker Investment Management Inc/ne | 64.329 | 1,84 | 16.648 | -14,91 | ||||
| 2026-01-08 | 13F | Regent Peak Wealth Advisors LLC | 0 | -100,00 | 0 | -100,00 | ||||
| 2026-02-13 | 13F | Barclays Plc | Call | 16.900 | 4.374 | |||||
| 2026-01-16 | 13F | West Branch Capital LLC | 429 | -14,71 | 111 | -28,39 | ||||
| 2026-02-09 | 13F | Roundview Capital LLC | 2.388 | -55,58 | 618 | -62,94 | ||||
| 2026-02-17 | 13F | Prelude Capital Management, Llc | 1.284 | 332 | ||||||
| 2026-02-11 | 13F | Empowered Funds, LLC | 21.953 | 11,78 | 5.681 | -6,59 | ||||
| 2026-01-26 | 13F | Merit Financial Group, LLC | 7.575 | -5,74 | 1.960 | -21,25 | ||||
| 2026-02-13 | 13F | Storgate, LLC | 1.503 | 389 | ||||||
| 2026-01-21 | 13F | Stock Yards Bank & Trust Co | 2.588 | 13,76 | 670 | -4,97 | ||||
| 2026-01-02 | 13F | Global Wealth Strategies & Associates | 70 | 0,00 | 18 | -14,29 | ||||
| 2026-02-12 | 13F | Cornerstone Capital, Inc. | 98.145 | 0,11 | 25.399 | -16,36 | ||||
| 2026-02-11 | 13F | Capital Analysts, Inc. | 27 | -42,55 | 0 | |||||
| 2026-01-08 | 13F | Wealth Enhancement Advisory Services, Llc | 78.590 | 0,09 | 20.650 | -15,11 | ||||
| 2026-02-10 | 13F | CIBC Asset Management Inc | 84.551 | 48,94 | 21.881 | 24,44 | ||||
| 2026-02-05 | 13F | Cornerstone Wealth Management, LLC | 0 | -100,00 | 0 | |||||
| 2026-01-22 | 13F | Premier Path Wealth Partners, LLC | 0 | -100,00 | 0 | |||||
| 2026-02-12 | 13F | Distillate Capital Partners LLC | 76.243 | 39,55 | 19.731 | 16,59 | ||||
| 2026-02-17 | 13F | Tower Research Capital LLC (TRC) | 9.915 | 297,24 | 2.566 | 231,82 | ||||
| 2026-02-17 | 13F | Centennial Bank/AR/ | 0 | -100,00 | 0 | |||||
| 2026-02-10 | 13F | Garde Capital, Inc. | 2.139 | 0,00 | 554 | -16,47 | ||||
| 2026-02-17 | 13F | Evercore Wealth Management, LLC | 3.684 | 0,00 | 953 | -16,48 | ||||
| 2026-02-17 | 13F | Mairs & Power Inc | 0 | -100,00 | 0 | |||||
| 2025-09-23 | NP | GCEQX - GREEN CENTURY EQUITY FUND Individual Investor Class | 6.665 | 1,59 | 1.915 | -9,03 | ||||
| 2026-02-11 | 13F | Capital Group Private Client Services, Inc. | 44.753 | -2,74 | 11.582 | -18,74 | ||||
| 2026-02-11 | 13F | Nemes Rush Group LLC | 390 | 35,42 | 101 | 12,36 | ||||
| 2026-01-13 | 13F | Trust Asset Management LLC | 2.767 | -3,42 | 716 | -19,28 | ||||
| 2026-02-05 | 13F | LGT Fund Management Co Ltd. | 1.533 | -85,99 | 401 | -88,02 | ||||
| 2026-02-03 | 13F | Insight 2811, Inc. | 1.400 | 0,00 | 362 | -16,40 | ||||
| 2025-11-14 | 13F | Twinbeech Capital Lp | 0 | -100,00 | 0 | |||||
| 2026-02-04 | 13F | Independent Advisor Alliance | 4.297 | -3,02 | 1.112 | -19,02 | ||||
| 2026-02-17 | 13F | Ameriflex Group, Inc. | 10 | -93,90 | 3 | -96,00 | ||||
| 2026-01-15 | 13F | McGlone Suttner Wealth Management, Inc. | 1.756 | -0,85 | 454 | -17,15 | ||||
| 2026-02-06 | 13F | Great Diamond Partners, LLC | 0 | -100,00 | 0 | |||||
| 2025-09-25 | NP | DFEOX - U.s. Core Equity 1 Portfolio - Institutional Class This fund is a listed as child fund of Dimensional Fund Advisors Lp and if that institution has disclosed ownership in this security, then these positions will not be double counted when calculating total shares and total value | 94.899 | -4,29 | 27.260 | -14,27 | ||||
| 2026-02-03 | 13F | Legacy Wealth Managment, LLC/ID | 17 | 4 | ||||||
| 2026-02-06 | 13F | Legato Capital Management LLC | 5.210 | 0,00 | 1.348 | -16,43 | ||||
| 2026-02-09 | 13F | Mizuho Securities Usa Llc | 18.699 | 0,14 | 4.630 | -18,08 | ||||
| 2026-01-21 | 13F | West Paces Advisors Inc. | 1.500 | 0,00 | 388 | -16,38 | ||||
| 2026-02-13 | 13F | First Trust Advisors Lp | 16.939 | -61,90 | 4.384 | -68,17 | ||||
| 2026-01-23 | 13F | Sfm, Llc | 3.965 | -12,82 | 1.026 | -27,13 | ||||
| 2026-02-13 | 13F | Resources Investment Advisors, LLC. | 6.872 | -3,90 | 1.778 | -19,73 | ||||
| 2026-02-06 | 13F | Global Retirement Partners, LLC | 445.401 | -11,46 | 115.265 | -26,02 | ||||
| 2026-01-15 | 13F | Archford Capital Strategies, LLC | 1.806 | -0,50 | 467 | -16,90 | ||||
| 2026-02-13 | 13F | Bank Of Nova Scotia | 40.411 | -74,14 | 10.458 | -78,39 | ||||
| 2026-02-24 | 13F | Chelsea Counsel Co | 0 | -100,00 | 0 | |||||
| 2025-09-26 | NP | OWTEX - Old Westbury Total Equity Fund | 5.469 | 0,00 | 1.571 | -10,44 | ||||
| 2026-02-06 | 13F | Tredje AP-fonden | 109.212 | 0,00 | 28.263 | -16,45 | ||||
| 2026-02-09 | 13F | Allstate Corp | 19.529 | 114,27 | 5.054 | 79,06 | ||||
| 2026-01-23 | 13F | Sage Mountain Advisors LLC | 0 | -100,00 | 0 | |||||
| 2026-02-13 | 13F | USS Investment Management Ltd | 41.393 | 0,47 | 10.714 | -16,10 | ||||
| 2025-09-26 | NP | DSEFX - Domini Impact Equity Fund Investor Shares | 8.700 | 2,35 | 2.499 | -8,29 | ||||
| 2026-02-06 | 13F | Mjp Associates Inc /adv | 2.431 | -12,49 | 629 | -26,86 | ||||
| 2026-02-10 | 13F | National Pension Service | 508.412 | 6,45 | 131.572 | -11,06 | ||||
| 2026-01-27 | 13F | Alley Investment Management Company, LLC | 40.745 | -34,87 | 10.544 | -45,58 | ||||
| 2026-02-13 | 13F | Cozad Asset Management Inc | 1.837 | 15,75 | 475 | -3,26 | ||||
| 2025-11-03 | 13F | TradeLink Capital LLC | 0 | -100,00 | 0 | |||||
| 2025-09-26 | NP | ILCG - iShares Morningstar Large-Cap Growth ETF | 17.725 | -20,60 | 5.092 | -28,89 | ||||
| 2026-01-12 | 13F | National Wealth Management Group, LLC | 0 | -100,00 | 0 | |||||
| 2026-01-29 | 13F | Compass Ion Advisors, LLC | 982 | -0,51 | 254 | -16,72 | ||||
| 2026-02-10 | 13F/A | Guinness Atkinson Asset Management Inc | 3.366 | -2,80 | 886 | -16,35 | ||||
| 2026-02-12 | 13F | Great Valley Advisor Group, Inc. | 1.370 | -64,99 | 354 | -70,79 | ||||
| 2026-02-02 | 13F | Sun Financial Inc | 2.306 | 597 | ||||||
| 2026-02-26 | 13F/A | Sculptor Capital LP | 0 | -100,00 | 0 | |||||
| 2026-02-05 | 13F | Clarendon Private LLC | 1.647 | -17,69 | 426 | -31,18 | ||||
| 2026-02-11 | 13F | Capital Research Global Investors | 1.548.473 | 0,51 | 400.729 | -16,02 | ||||
| 2025-09-26 | NP | FSUVX - Fidelity SAI U.S. Low Volatility Index Fund This fund is a listed as child fund of Fmr Llc and if that institution has disclosed ownership in this security, then these positions will not be double counted when calculating total shares and total value | 302.683 | 5,25 | 86.946 | -5,73 | ||||
| 2025-11-12 | 13F | Quantbot Technologies LP | 0 | -100,00 | 0 | |||||
| 2026-02-17 | 13F | National Asset Management, Inc. | 1.618 | -52,69 | 419 | -60,53 | ||||
| 2026-02-13 | 13F | American Century Companies Inc | 282.937 | -22,83 | 73.221 | -35,53 | ||||
| 2026-02-12 | 13F | Sit Investment Associates Inc | 0 | -100,00 | 0 | |||||
| 2026-02-12 | 13F | Advisors Asset Management, Inc. | 893 | 106,24 | 231 | 72,39 | ||||
| 2025-10-24 | 13F | Bayforest Capital Ltd | 0 | -100,00 | 0 | -100,00 | ||||
| 2026-02-10 | 13F | Vantus Wealth LLC | 1.319 | 341 | ||||||
| 2026-01-28 | 13F | CAPROCK Group, Inc. | 34.445 | 5,58 | 8.914 | -9,75 | ||||
| 2026-01-28 | 13F | Quaker Wealth Management, LLC | 6 | 50,00 | 2 | 0,00 | ||||
| 2025-11-12 | 13F | NewSquare Capital LLC | 0 | -100,00 | 0 | |||||
| 2025-09-26 | NP | SUNAMERICA SERIES TRUST - SA JPMorgan Diversified Balanced Portfolio Class 1 | 5.155 | 8,57 | 1.481 | -2,76 | ||||
| 2026-01-12 | 13F | Horizon Financial Services, Llc | 21 | -60,38 | 5 | -68,75 | ||||
| 2026-01-20 | 13F | Cromwell Holdings LLC | 493 | 0,00 | 128 | -16,45 | ||||
| 2026-01-20 | 13F | Pflug Koory, LLC | 648 | 0,00 | 168 | -16,50 | ||||
| 2026-02-13 | 13F | Trillium Asset Management, Llc | 33.268 | -30,43 | 8.822 | -40,45 | ||||
| 2026-01-15 | 13F | Frank, Rimerman Advisors LLC | 5.935 | -1,92 | 1.536 | -18,09 | ||||
| 2025-09-26 | NP | FDGFX - Fidelity Dividend Growth Fund This fund is a listed as child fund of Fmr Llc and if that institution has disclosed ownership in this security, then these positions will not be double counted when calculating total shares and total value | 110.400 | -3,75 | 31.712 | -13,79 | ||||
| 2026-02-09 | 13F | Keating Financial Advisory Services, Inc. | 560 | 145 | ||||||
| 2026-01-29 | 13F | Resonant Capital Advisors, LLC | 0 | -100,00 | 0 | |||||
| 2026-02-03 | 13F | ASR Vermogensbeheer N.V. | 145.001 | 17,36 | 37.525 | -1,95 | ||||
| 2025-09-25 | NP | AWSHX - WASHINGTON MUTUAL INVESTORS FUND Class A | 5.857.614 | 0,00 | 1.682.600 | -10,43 | ||||
| 2026-01-27 | 13F | Checchi Capital Advisers, LLC | 2.074 | -10,49 | 537 | -25,24 | ||||
| 2026-02-05 | 13F | IMG Wealth Management, Inc. | 29 | 70,59 | 8 | 40,00 | ||||
| 2026-02-10 | 13F | SCS Capital Management LLC | 2.337 | 0,99 | 605 | -15,64 | ||||
| 2026-02-11 | 13F | Clifford Swan Investment Counsel Llc | 2.799 | 0,00 | 724 | -16,40 | ||||
| 2026-01-22 | 13F | Quotient Wealth Partners, LLC | 1.922 | -6,88 | 497 | -22,22 | ||||
| 2026-02-17 | 13F | Merrion Investment Management Co, LLC | 5.000 | 0,00 | 1.294 | -16,47 | ||||
| 2026-02-13 | 13F | Glen Eagle Advisors, LLC | 130 | 0,00 | 34 | -17,50 | ||||
| 2025-09-26 | NP | FFLG - Fidelity Growth Opportunities ETF | 11.380 | 33,65 | 3.269 | 19,71 | ||||
| 2026-02-03 | 13F | Strengthening Families & Communities, LLC | 0 | -100,00 | 0 | |||||
| 2026-02-04 | 13F | Freedom Day Solutions, LLC | 15.146 | 0,00 | 3.920 | -16,46 | ||||
| 2025-11-13 | 13F | Glenmede Investment Management, LP | 8.844 | -2,97 | 2.739 | -6,10 | ||||
| 2026-02-10 | 13F | Bruce G. Allen Investments, LLC | 279 | -13,08 | 72 | -27,27 | ||||
| 2025-09-26 | NP | SUNAMERICA SERIES TRUST - SA Large Cap Value Index Portfolio Class 1 | 3.704 | 0,68 | 1.064 | -9,84 | ||||
| 2026-01-23 | 13F | TFC Financial Management | 7 | 16,67 | 2 | 0,00 | ||||
| 2026-02-12 | 13F | Rench Wealth Management, Inc. | 51.168 | 1,45 | 13.242 | -15,24 | ||||
| 2026-02-13 | 13F | OMERS ADMINISTRATION Corp | 7.725 | 0,00 | 1.999 | -16,43 | ||||
| 2026-01-29 | 13F | Concurrent Investment Advisors, LLC | 10.594 | 31,07 | 2.742 | 9,51 | ||||
| 2026-02-17 | 13F | Signature Equity Partners, LLC | 587 | 152 | ||||||
| 2026-01-13 | 13F | Trinity Financial Advisors LLC | 1.000 | 0,00 | 259 | -16,50 | ||||
| 2026-01-14 | 13F | Cox Capital Mgt LLC | 0 | -100,00 | 0 | |||||
| 2026-02-06 | 13F | Aviance Capital Partners, LLC | 1.500 | 0,00 | 388 | -16,38 | ||||
| 2026-02-17 | 13F | Imprint Wealth LLC | 51 | -39,29 | 13 | -50,00 | ||||
| 2026-02-13 | 13F | Lavaca Capital Llc | 205 | 0,00 | 53 | -15,87 | ||||
| 2026-02-12 | 13F | Elo Mutual Pension Insurance Co | 24.612 | 7,88 | 6.369 | -9,86 | ||||
| 2026-01-23 | 13F | Webster Bank, N. A. | 2.850 | 0,00 | 738 | -16,44 | ||||
| 2026-02-09 | 13F | HBK Sorce Advisory LLC | 1.528 | 30,26 | 369 | 6,34 | ||||
| 2026-02-12 | 13F | Renaissance Technologies Llc | 4.320 | -98,92 | 1.118 | -99,10 | ||||
| 2026-01-07 | 13F | Northside Capital Management, LLC | 1.891 | 0,00 | 489 | -16,41 | ||||
| 2026-02-13 | 13F | SRS Capital Advisors, Inc. | 1.854 | -39,59 | 480 | -49,58 | ||||
| 2026-02-11 | 13F | Manchester Capital Management LLC | 334 | 86 | ||||||
| 2026-01-27 | 13F | Financial Management Professionals, Inc. | 45 | -2,17 | 12 | -21,43 | ||||
| 2026-02-05 | 13F/A | Fulcrum Asset Management LLP | 7.346 | -2,88 | 1.923 | -17,89 | ||||
| 2025-09-22 | NP | TBLRX - Transamerica Balanced II R | 761 | -5,93 | 219 | -15,83 | ||||
| 2026-02-02 | 13F | Oppenheimer Asset Management Inc. | 22.339 | -47,93 | 5.781 | -56,50 | ||||
| 2026-02-17 | 13F | Adage Capital Partners Gp, L.l.c. | 159.803 | -45,48 | 41.355 | -54,45 | ||||
| 2026-01-14 | 13F | Lantz Financial LLC | 2.077 | -0,53 | 538 | -16,87 | ||||
| 2026-02-02 | 13F | Pittenger & Anderson Inc | 12.190 | -34,72 | 3.155 | -45,46 | ||||
| 2025-09-26 | NP | FZROX - Fidelity ZERO Total Market Index Fund This fund is a listed as child fund of Fmr Llc and if that institution has disclosed ownership in this security, then these positions will not be double counted when calculating total shares and total value | 120.076 | 3,32 | 34.492 | -7,46 | ||||
| 2026-01-16 | 13F | Perigon Wealth Management, LLC | 1.365 | -17,22 | 353 | -30,78 | ||||
| 2026-01-26 | 13F | Clean Yield Group | 451 | 0,00 | 117 | -16,55 | ||||
| 2026-02-17 | 13F | Angeles Wealth Management, Llc | 1.248 | 0,32 | 323 | -16,36 | ||||
| 2026-02-12 | 13F | Alpha Family Trust | 0 | -100,00 | 0 | |||||
| 2026-02-05 | 13F | Cambridge Investment Research Advisors, Inc. | 19.990 | 2,07 | 5 | -16,67 | ||||
| 2026-01-12 | 13F | DAVENPORT & Co LLC | 17.281 | -3,18 | 4.472 | -19,10 | ||||
| 2025-09-26 | NP | PRF - Invesco FTSE RAFI US 1000 ETF This fund is a listed as child fund of Invesco Ltd. and if that institution has disclosed ownership in this security, then these positions will not be double counted when calculating total shares and total value | 15.007 | -13,03 | 4.311 | -22,10 | ||||
| 2026-01-28 | 13F | B. Metzler seel. Sohn & Co. AG | 11.679 | 2,75 | 3.022 | -14,15 | ||||
| 2026-02-11 | 13F | Hughes Financial Services, LLC | 24 | 1.100,00 | 6 | |||||
| 2026-01-08 | 13F | Gryphon Financial Partners LLC | 0 | -100,00 | 0 | |||||
| 2026-02-13 | 13F/A | Newport Capital Group, LLC | 51.338 | 0,01 | 13.286 | -16,44 | ||||
| 2026-02-17 | 13F | Bank Of America Corp /de/ | 1.508.079 | -3,70 | 390.276 | -19,54 | ||||
| 2026-02-09 | 13F | Choate Investment Advisors | 2.336 | 0,17 | 605 | -16,34 | ||||
| 2026-02-17 | 13F | Lombard Odier Asset Management (USA) Corp | 6.862 | -10,74 | 1.776 | -25,45 | ||||
| 2025-10-22 | 13F | Daymark Wealth Partners, Llc | 0 | -100,00 | 0 | |||||
| 2026-02-03 | 13F | International Assets Investment Management, Llc | 643 | -29,26 | 166 | -42,76 | ||||
| 2026-02-13 | 13F | Wells Fargo & Company/mn | 481.532 | 7,59 | 124.616 | -10,11 | ||||
| 2026-01-29 | 13F | Pictet Asset Management Holding SA | 154.404 | 40,91 | 39.965 | 17,75 | ||||
| 2026-01-20 | 13F | Stratos Wealth Advisors, LLC | 1.332 | -10,90 | 345 | -25,70 | ||||
| 2026-02-17 | 13F | Beacon Investment Advisors Llc | 1.053 | 9,12 | 273 | -9,03 | ||||
| 2026-02-03 | 13F | Tranquility Partners, LLC | 1.026 | -29,68 | 266 | -41,24 | ||||
| 2026-01-26 | 13F | Annex Advisory Services, LLC | 102.631 | 7,86 | 26.560 | -9,88 | ||||
| 2026-01-30 | 13F | Torren Management, LLC | 25 | 7 | ||||||
| 2026-02-13 | 13F | Wells Fargo & Company/mn | Call | 20.000 | 5.176 | |||||
| 2026-01-07 | 13F | Harbor Investment Advisory, Llc | 2.157 | 14,55 | 558 | -4,29 | ||||
| 2025-09-29 | NP | CVSIX - Calamos Market Neutral Income Fund Class A | 88.636 | 0,00 | 25.461 | -10,43 | ||||
| 2026-02-26 | 13F | TD Capital Management LLC | 0 | -100,00 | 0 | |||||
| 2026-02-13 | 13F | 1832 Asset Management L.P. | 0 | -100,00 | 0 | |||||
| 2026-01-14 | 13F | Accurate Wealth Management, LLC | 2.751 | 4,13 | 728 | -9,35 | ||||
| 2026-02-17 | 13F | Crawford Investment Counsel Inc | 0 | -100,00 | 0 | |||||
| 2025-11-17 | 13F | Kestra Investment Management, LLC | 0 | -100,00 | 0 | -100,00 | ||||
| 2026-02-17 | 13F | VestGen Advisors, LLC | 1.910 | -28,46 | 494 | -40,27 | ||||
| 2026-01-15 | 13F | J. Safra Sarasin Holding AG | 1.082 | 61,25 | 280 | 35,27 | ||||
| 2026-02-17 | 13F | Clark Capital Management Group, Inc. | 1.026 | -99,35 | 266 | -99,46 | ||||
| 2026-01-22 | 13F | Fiduciary Alliance LLC | 3.827 | -0,03 | 990 | -16,46 | ||||
| 2025-11-13 | 13F | Dynamic Technology Lab Private Ltd | 0 | -100,00 | 0 | |||||
| 2026-02-11 | 13F | Miller Investment Management, LP | 1.672 | 0,00 | 433 | -16,44 | ||||
| 2026-01-28 | 13F | Loring Wolcott & Coolidge Fiduciary Advisors Llp/ma | 295 | -26,25 | 71 | -36,61 | ||||
| 2026-02-10 | 13F | SBI Okasan Asset Management Co.Ltd. | 5.210 | 1.371 | ||||||
| 2026-02-06 | 13F | Cullen/frost Bankers, Inc. | 107.158 | -15,00 | 27.731 | -28,98 | ||||
| 2025-10-28 | 13F | Pinnacle Financial Partners Inc | 3.777 | 5,12 | 1.170 | 1,65 | ||||
| 2026-01-14 | 13F | Spire Wealth Management | 1.095 | -31,13 | 283 | -42,48 | ||||
| 2025-11-14 | 13F | Challenger Wealth Management | 0 | -100,00 | 0 | |||||
| 2026-02-13 | 13F | Brown Advisory Inc | 2.027.929 | -19,46 | 524.814 | -32,71 | ||||
| 2026-02-05 | 13F | Canada Post Corp Registered Pension Plan | 6.479 | 26,57 | 1.677 | 7,16 | ||||
| 2026-02-17 | 13F | Tudor Investment Corp Et Al | Call | 2.100 | 543 | |||||
| 2026-02-17 | 13F | Tudor Investment Corp Et Al | Put | 800 | 207 | |||||
| 2026-02-13 | 13F | LGT Financial Advisors LLC | 21 | -47,50 | 6 | -58,33 | ||||
| 2026-01-20 | 13F | Quintet Private Bank (Europe) S.A. | 0 | -100,00 | 0 | |||||
| 2026-02-13 | 13F | TritonPoint Partners, LLC | 2.786 | 721 | ||||||
| 2026-01-27 | 13F | Penobscot Investment Management Company, Inc. | 4.135 | -9,22 | 1.070 | -24,11 | ||||
| 2026-02-13 | 13F | Change Path, LLC | 1.407 | -2,29 | 364 | -18,39 | ||||
| 2026-02-13 | 13F | Findlay Park Partners LLP | 1.025.521 | -4,15 | 265.395 | -19,92 | ||||
| 2025-11-04 | 13F | Pineridge Advisors LLC | 25 | 0,00 | 8 | -12,50 | ||||
| 2026-01-13 | 13F | West Financial Advisors, LLC | 50 | 4,17 | 13 | -20,00 | ||||
| 2026-01-23 | 13F | Avion Wealth | 27 | -18,18 | 0 | |||||
| 2026-02-09 | 13F | Leavell Investment Management, Inc. | 9.771 | 13,16 | 2.529 | -5,46 | ||||
| 2025-11-04 | 13F | Guerra Advisors Inc | 47 | 15 | ||||||
| 2026-02-17 | 13F | Investment Management Corp of Ontario | 112.834 | 10,57 | 29.200 | -7,62 | ||||
| 2026-01-23 | 13F | Sumitomo Mitsui Trust Holdings, Inc. | 575.690 | -3,30 | 148.983 | -19,21 | ||||
| 2026-01-30 | 13F | Wealthfront Advisers Llc | 32.367 | -4,87 | 8.376 | -20,52 | ||||
| 2026-02-10 | 13F | MUFG Securities EMEA plc | 10.522 | 114,43 | 2.723 | 79,20 | ||||
| 2025-09-25 | NP | GAOAX - JPMorgan Global Allocation Fund Class A | 9.334 | 41,75 | 2.681 | 27,00 | ||||
| 2025-09-23 | NP | MXCCX - Federated Max-Cap Index Fund Class C Shares This fund is a listed as child fund of Federated Hermes, Inc. and if that institution has disclosed ownership in this security, then these positions will not be double counted when calculating total shares and total value | 767 | -31,40 | 220 | -38,55 | ||||
| 2025-09-29 | NP | XYLG - Global X S&P 500 Covered Call & Growth ETF This fund is a listed as child fund of Mirae Asset Global Investments Co., Ltd. and if that institution has disclosed ownership in this security, then these positions will not be double counted when calculating total shares and total value | 262 | -8,39 | 75 | -17,58 | ||||
| 2026-02-02 | 13F | Horizon Investments, LLC | 4.481 | 2,75 | 1.160 | -14,15 | ||||
| 2026-02-06 | 13F | Van Hulzen Asset Management, LLC | 95.470 | 7,94 | 24.707 | -9,81 | ||||
| 2025-10-03 | NP | RUNN - RUNNING OAK EFFICIENT GROWTH ETF | 20.547 | 10,66 | 6.221 | -3,57 | ||||
| 2026-02-09 | 13F | Cary Street Partner Investment Advisory Llc | 1.873 | -9,87 | 485 | -24,73 | ||||
| 2026-01-21 | 13F | Yousif Capital Management, Llc | 28.161 | -4,68 | 7.178 | -21,56 | ||||
| 2026-02-19 | 13F | Atomi Financial Group, Inc. | 1.306 | -15,85 | 338 | -29,79 | ||||
| 2026-02-11 | 13F | Prudent Man Advisors, LLC | 0 | -100,00 | 0 | -100,00 | ||||
| 2025-11-05 | 13F | Fullcircle Wealth Llc | 928 | 17,02 | 234 | 3,56 | ||||
| 2025-10-07 | 13F | Union Bancaire Privee, UBP SA | 0 | -100,00 | 0 | |||||
| 2025-09-29 | NP | PWS - Pacer WealthShield ETF | 181 | 23,97 | 52 | 15,91 | ||||
| 2026-02-10 | 13F | Fideuram Asset Management (Ireland) dac | 1.771 | 589 | ||||||
| 2026-02-12 | 13F | Cincinnati Specialty Underwriters Insurance CO | 8.428 | 2.181 | ||||||
| 2026-03-12 | 13F | Nalls Sherbakoff Group, Llc | 20 | 5 | ||||||
| 2025-09-24 | NP | SEEKX - Steward Large Cap Enhanced Index Fund Class A | 1.588 | 0,00 | 456 | -10,41 | ||||
| 2026-02-13 | 13F | Ingalls & Snyder Llc | 2.110 | -2,31 | 1 | |||||
| 2026-02-06 | 13F | Covestor Ltd | 237 | 3,04 | 0 | |||||
| 2026-02-09 | 13F | Harbour Investments, Inc. | 1.300 | 7,97 | 336 | -9,68 | ||||
| 2026-01-30 | 13F | American Capital Advisory, LLC | 7 | 133,33 | 2 | |||||
| 2026-01-07 | 13F | Sagespring Wealth Partners, Llc | 2.025 | 12,56 | 524 | -6,10 | ||||
| 2026-02-10 | 13F | Gw Henssler & Associates Ltd | 0 | -100,00 | 0 | |||||
| 2025-11-14 | 13F | Polar Capital Holdings Plc | 0 | -100,00 | 0 | |||||
| 2025-10-21 | 13F | Financiere des Professionnels - Fonds d,investissement inc. | 0 | -100,00 | 0 | |||||
| 2026-02-12 | 13F | Ci Investments Inc. | 51.803 | -67,36 | 13.406 | 27.259,18 | ||||
| 2026-02-13 | 13F | Boston Partners | 830.159 | -19,58 | 214.765 | -32,80 | ||||
| 2026-02-13 | 13F | Charles Schwab Investment Management Inc | 2.043.640 | 0,72 | 528.876 | -15,84 | ||||
| 2026-02-10 | 13F | Welch & Forbes Llc | 294.278 | 0,52 | 76.156 | -16,02 | ||||
| 2025-09-26 | NP | FAGIX - Fidelity Capital & Income Fund | 211.900 | 0,00 | 60.868 | -10,43 | ||||
| 2026-01-15 | 13F | Boston Common Asset Management, LLC | 1.748 | 0,00 | 452 | -16,45 | ||||
| 2025-10-07 | 13F | Oak Thistle LLC | 0 | -100,00 | 0 | |||||
| 2026-02-05 | 13F | Thrivent Financial For Lutherans | 20.702 | -59,54 | 5 | -66,67 | ||||
| 2025-11-10 | 13F | Wrapmanager Inc | 0 | -100,00 | 0 | |||||
| 2026-02-13 | 13F | Prudential Financial Inc | 126.160 | -12,59 | 32.649 | -26,97 | ||||
| 2026-02-13 | 13F | Treasurer of the State of North Carolina | 106.254 | -6,81 | 27 | -22,86 | ||||
| 2026-02-06 | 13F | Profund Advisors Llc | 2.673 | -23,82 | 692 | -36,37 | ||||
| 2025-09-25 | NP | WMLIX - Wilmington Large-Cap Strategy Fund Class I Shares | 2.530 | 0,00 | 727 | -10,48 | ||||
| 2026-02-11 | 13F | Horizon Kinetics Asset Management Llc | 1.953 | -0,20 | 505 | -16,67 | ||||
| 2026-02-17 | 13F | Silvercrest Asset Management Group Llc | 17.733 | -19,73 | 4.589 | -32,93 | ||||
| 2026-01-29 | 13F | Comerica Bank | 198.341 | -10,75 | 51.329 | -25,43 | ||||
| 2026-02-10 | 13F | Verity & Verity, LLC | 40.198 | -1,43 | 10.403 | -17,65 |