Grundlæggende statistik
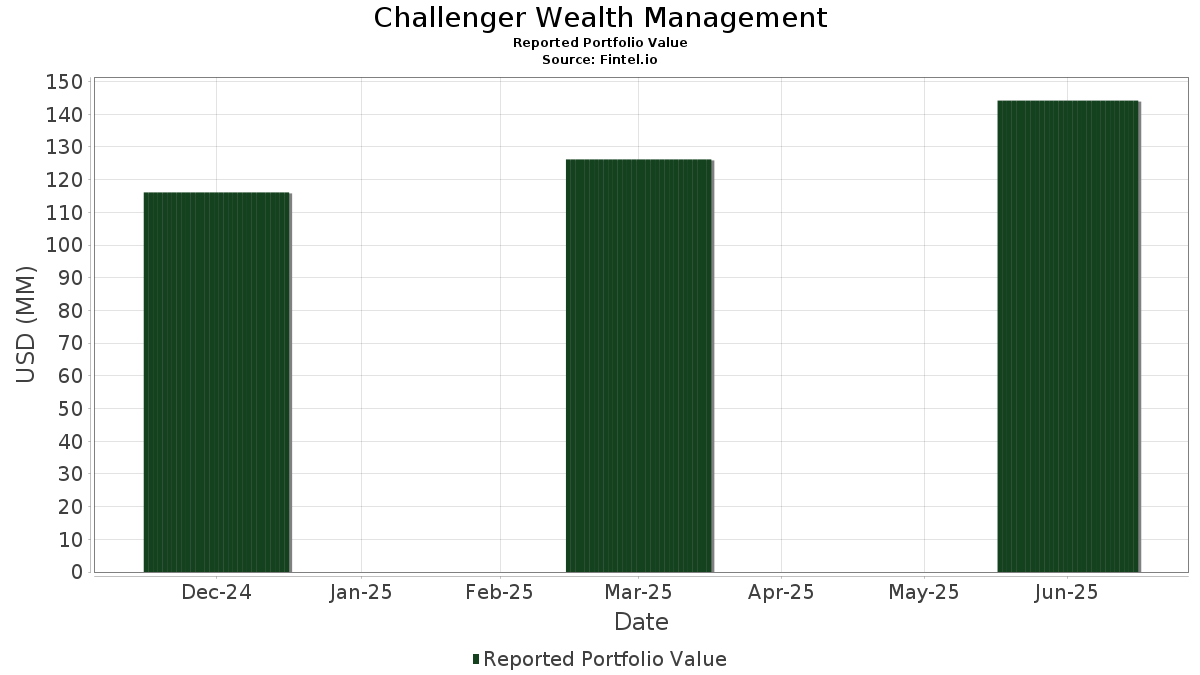
| Porteføljeværdi | $ 144.195.890 |
| Nuværende stillinger | 109 |
Seneste beholdninger, ydeevne, AUM (fra 13F, 13D)
Challenger Wealth Management har afsløret 109 samlede besiddelser i deres seneste SEC-arkivering. Den seneste porteføljeværdi er beregnet til at være $ 144.195.890 USD. Faktiske aktiver under forvaltning (AUM) er denne værdi plus kontanter (som ikke er oplyst). Challenger Wealth Managements største beholdninger er Capital Group Dividend Value ETF (US:CGDV) , Capital Group Growth ETF (US:CGGR) , Capital Group Core Equity ETF (US:CGUS) , Ares Capital Corporation (US:ARCC) , and Apple Inc. (US:AAPL) . Challenger Wealth Managements nye stillinger omfatter General Electric Company (US:GE) , Royal Caribbean Cruises Ltd. (US:RCL) , Applied Materials, Inc. (US:AMAT) , Freeport-McMoRan Inc. (MX:FCX) , and TC Energy Corporation (CA:TRP) .
Top øger dette kvartal
Vi bruger ændringen i porteføljeallokeringen, fordi dette er den mest meningsfulde metrik. Ændringer kan skyldes handler eller ændringer i aktiekurser.
| Sikkerhed | Aktier (MM) |
Værdi (MM$) |
Portefølje % | ΔPortefølje % |
|---|---|---|---|---|
| 0,43 | 17,63 | 12,2271 | 1,6395 | |
| 0,02 | 3,83 | 2,6564 | 1,2341 | |
| 0,01 | 2,28 | 1,5809 | 1,1161 | |
| 0,02 | 4,07 | 2,8217 | 0,6980 | |
| 0,48 | 19,06 | 13,2214 | 0,4330 | |
| 0,01 | 4,67 | 3,2353 | 0,3855 | |
| 0,01 | 1,30 | 0,9003 | 0,3397 | |
| 0,27 | 10,07 | 6,9816 | 0,2895 | |
| 0,00 | 0,39 | 0,2725 | 0,2725 | |
| 0,00 | 1,61 | 1,1142 | 0,2617 |
Top falder i dette kvartal
Vi bruger ændringen i porteføljeallokeringen, fordi dette er den mest meningsfulde metrik. Ændringer kan skyldes handler eller ændringer i aktiekurser.
| Sikkerhed | Aktier (MM) |
Værdi (MM$) |
Portefølje % | ΔPortefølje % |
|---|---|---|---|---|
| 0,02 | 4,80 | 3,3302 | -0,6075 | |
| 0,02 | 3,08 | 2,1335 | -0,5960 | |
| 0,00 | 0,29 | 0,2038 | -0,4250 | |
| 0,25 | 5,48 | 3,8024 | -0,3756 | |
| 0,01 | 2,19 | 1,5190 | -0,3466 | |
| 0,03 | 3,40 | 2,3552 | -0,3463 | |
| 0,11 | 3,65 | 2,5338 | -0,3218 | |
| 0,00 | 0,46 | 0,3217 | -0,3210 | |
| 0,01 | 1,66 | 1,1540 | -0,2125 | |
| 0,01 | 1,31 | 0,9104 | -0,1792 |
13F og Fondsarkivering
Denne formular blev indsendt den 2025-08-14 for rapporteringsperioden 2025-06-30. Klik på linkikonet for at se den fulde transaktionshistorik.
Opgrader for at låse op for premium-data og eksportere til Excel ![]() .
.
| Sikkerhed | Type | Gennemsnitlig aktiekurs | Aktier (MM) |
Δ Aktier (%) |
Δ Aktier (%) |
Værdi ($MM) |
Portefølje (%) |
ΔPortefølje (%) |
|
|---|---|---|---|---|---|---|---|---|---|
| CGDV / Capital Group Dividend Value ETF | 0,48 | 6,61 | 19,06 | 18,12 | 13,2214 | 0,4330 | |||
| CGGR / Capital Group Growth ETF | 0,43 | 11,18 | 17,63 | 31,96 | 12,2271 | 1,6395 | |||
| CGUS / Capital Group Core Equity ETF | 0,27 | 7,81 | 10,07 | 19,21 | 6,9816 | 0,2895 | |||
| ARCC / Ares Capital Corporation | 0,25 | 4,93 | 5,48 | 3,98 | 3,8024 | -0,3756 | |||
| AAPL / Apple Inc. | 0,02 | 4,62 | 4,80 | -3,38 | 3,3302 | -0,6075 | |||
| MSFT / Microsoft Corporation | 0,01 | -2,11 | 4,67 | 29,73 | 3,2353 | 0,3855 | |||
| TSLA / Tesla, Inc. | 0,01 | 0,69 | 4,46 | 23,43 | 3,0910 | 0,2294 | |||
| AMZN / Amazon.com, Inc. | 0,02 | 31,65 | 4,07 | 51,79 | 2,8217 | 0,6980 | |||
| NVDA / NVIDIA Corporation | 0,02 | 46,39 | 3,83 | 113,37 | 2,6564 | 1,2341 | |||
| CGBL / Capital Group Core Balanced ETF | 0,11 | -6,08 | 3,65 | 1,39 | 2,5338 | -0,3218 | |||
| XOM / Exxon Mobil Corporation | 0,03 | 9,90 | 3,40 | -0,38 | 2,3552 | -0,3463 | |||
| CVX / Chevron Corporation | 0,02 | 4,34 | 3,08 | -10,69 | 2,1335 | -0,5960 | |||
| COST / Costco Wholesale Corporation | 0,00 | 7,65 | 2,70 | 12,68 | 1,8739 | -0,0266 | |||
| V / Visa Inc. | 0,01 | 6,12 | 2,33 | 7,51 | 1,6176 | -0,1013 | |||
| AVGO / Broadcom Inc. | 0,01 | 136,02 | 2,28 | 288,91 | 1,5809 | 1,1161 | |||
| GOOGL / Alphabet Inc. | 0,01 | 7,50 | 2,20 | 22,49 | 1,5226 | 0,1025 | |||
| GJR / Strats Trust For Procter & Gambel Security - Preferred Security | 0,01 | -0,48 | 2,19 | -6,97 | 1,5190 | -0,3466 | |||
| ADP / Automatic Data Processing, Inc. | 0,01 | 12,89 | 1,82 | 13,98 | 1,2610 | -0,0035 | |||
| TMUS / T-Mobile US, Inc. | 0,01 | 8,01 | 1,66 | -3,54 | 1,1540 | -0,2125 | |||
| TT / Trane Technologies plc | 0,00 | 15,03 | 1,61 | 49,40 | 1,1142 | 0,2617 | |||
| MA / Mastercard Incorporated | 0,00 | -0,33 | 1,53 | 2,20 | 1,0613 | -0,1253 | |||
| HD / The Home Depot, Inc. | 0,00 | 1,29 | 1,47 | 1,31 | 1,0165 | -0,1297 | |||
| LMT / Lockheed Martin Corporation | 0,00 | 0,26 | 1,45 | 3,87 | 1,0048 | -0,0999 | |||
| DVY / iShares Trust - iShares Select Dividend ETF | 0,01 | -3,47 | 1,31 | -4,51 | 0,9104 | -0,1792 | |||
| TSM / Taiwan Semiconductor Manufacturing Company Limited - Depositary Receipt (Common Stock) | 0,01 | 34,49 | 1,30 | 83,59 | 0,9003 | 0,3397 | |||
| JPM / JPMorgan Chase & Co. | 0,00 | -0,20 | 1,29 | 18,01 | 0,8956 | 0,0281 | |||
| TJX / The TJX Companies, Inc. | 0,01 | 1,23 | 1,28 | 2,65 | 0,8866 | -0,1004 | |||
| DUK / Duke Energy Corporation | 0,01 | 0,45 | 1,17 | -2,83 | 0,8091 | -0,1423 | |||
| CTAS / Cintas Corporation | 0,00 | 3,07 | 1,11 | 11,75 | 0,7723 | -0,0172 | |||
| BRK.B / Berkshire Hathaway Inc. | 0,00 | -1,05 | 0,92 | -9,74 | 0,6364 | -0,1692 | |||
| META / Meta Platforms, Inc. | 0,00 | 2,18 | 0,90 | 30,86 | 0,6240 | 0,0793 | |||
| WMT / Walmart Inc. | 0,01 | -2,34 | 0,85 | 8,85 | 0,5889 | -0,0297 | |||
| HIG / The Hartford Insurance Group, Inc. | 0,01 | 0,56 | 0,84 | 3,08 | 0,5810 | -0,0628 | |||
| HCA / HCA Healthcare, Inc. | 0,00 | 0,24 | 0,80 | 11,31 | 0,5527 | -0,0154 | |||
| MPC / Marathon Petroleum Corporation | 0,00 | -5,80 | 0,77 | 7,53 | 0,5347 | -0,0342 | |||
| NOC / Northrop Grumman Corporation | 0,00 | 4,91 | 0,72 | 2,44 | 0,4964 | -0,0574 | |||
| OKE / ONEOK, Inc. | 0,01 | 0,71 | 0,67 | -17,12 | 0,4669 | -0,1770 | |||
| KO / The Coca-Cola Company | 0,01 | -0,11 | 0,67 | -1,32 | 0,4658 | -0,0735 | |||
| PWR / Quanta Services, Inc. | 0,00 | -2,28 | 0,66 | 45,39 | 0,4605 | 0,0986 | |||
| ASML / ASML Holding N.V. - Depositary Receipt (Common Stock) | 0,00 | -29,67 | 0,65 | -15,01 | 0,4518 | -0,1551 | |||
| CAT / Caterpillar Inc. | 0,00 | 0,44 | 0,62 | 18,22 | 0,4326 | 0,0145 | |||
| MET / MetLife, Inc. | 0,01 | -5,78 | 0,58 | -5,69 | 0,4027 | -0,0849 | |||
| ADBE / Adobe Inc. | 0,00 | -14,03 | 0,57 | -13,22 | 0,3963 | -0,1258 | |||
| CB / Chubb Limited | 0,00 | 5,63 | 0,55 | 1,28 | 0,3848 | -0,0490 | |||
| IBM / International Business Machines Corporation | 0,00 | 0,33 | 0,53 | 18,93 | 0,3707 | 0,0147 | |||
| WMB / The Williams Companies, Inc. | 0,01 | -1,49 | 0,52 | 3,59 | 0,3600 | -0,0373 | |||
| DE / Deere & Company | 0,00 | 0,00 | 0,51 | 8,32 | 0,3526 | -0,0193 | |||
| IVV / iShares Trust - iShares Core S&P 500 ETF | 0,00 | -10,06 | 0,49 | -0,61 | 0,3390 | -0,0505 | |||
| PH / Parker-Hannifin Corporation | 0,00 | -0,44 | 0,48 | 14,15 | 0,3307 | 0,0001 | |||
| UNH / UnitedHealth Group Incorporated | 0,00 | -4,00 | 0,46 | -42,91 | 0,3217 | -0,3210 | |||
| ING / ING Groep N.V. - Depositary Receipt (Common Stock) | 0,02 | 0,00 | 0,46 | 11,68 | 0,3185 | -0,0075 | |||
| PAYX / Paychex, Inc. | 0,00 | 0,45 | 0,46 | -5,19 | 0,3170 | -0,0654 | |||
| NET / Cloudflare, Inc. | 0,00 | 0,78 | 0,45 | 74,90 | 0,3148 | 0,1094 | |||
| MO / Altria Group, Inc. | 0,01 | 0,23 | 0,45 | -2,16 | 0,3144 | -0,0525 | |||
| DASH / DoorDash, Inc. | 0,00 | 0,74 | 0,43 | 36,05 | 0,3014 | 0,0480 | |||
| CNQ / Canadian Natural Resources Limited | 0,01 | -3,89 | 0,43 | -1,83 | 0,2982 | -0,0495 | |||
| COF / Capital One Financial Corporation | 0,00 | -0,50 | 0,43 | 18,06 | 0,2951 | 0,0095 | |||
| RTX / RTX Corporation | 0,00 | 1,90 | 0,41 | 12,47 | 0,2820 | -0,0048 | |||
| PHYS / Sprott Physical Gold Trust | 0,02 | 0,00 | 0,39 | 5,35 | 0,2738 | -0,0231 | |||
| GE / General Electric Company | 0,00 | 0,39 | 0,2725 | 0,2725 | |||||
| CEG / Constellation Energy Corporation | 0,00 | 0,33 | 0,39 | 61,00 | 0,2695 | 0,0778 | |||
| FLEX / Flex Ltd. | 0,01 | 0,00 | 0,37 | 50,81 | 0,2596 | 0,0631 | |||
| AJG / Arthur J. Gallagher & Co. | 0,00 | -8,06 | 0,37 | -14,81 | 0,2556 | -0,0871 | |||
| MCD / McDonald's Corporation | 0,00 | -10,41 | 0,36 | -16,32 | 0,2529 | -0,0920 | |||
| SONY / Sony Group Corporation - Depositary Receipt (Common Stock) | 0,01 | 0,00 | 0,35 | 2,63 | 0,2437 | -0,0279 | |||
| ROP / Roper Technologies, Inc. | 0,00 | -4,12 | 0,34 | -8,06 | 0,2378 | -0,0571 | |||
| CARR / Carrier Global Corporation | 0,00 | 0,74 | 0,34 | 16,49 | 0,2352 | 0,0041 | |||
| APD / Air Products and Chemicals, Inc. | 0,00 | 50,00 | 0,34 | 43,83 | 0,2347 | 0,0478 | |||
| MU / Micron Technology, Inc. | 0,00 | 0,65 | 0,32 | 43,11 | 0,2237 | 0,0447 | |||
| AIG / American International Group, Inc. | 0,00 | 0,00 | 0,32 | -1,56 | 0,2196 | -0,0353 | |||
| VZ / Verizon Communications Inc. | 0,01 | -3,22 | 0,31 | -7,72 | 0,2163 | -0,0514 | |||
| NFLX / Netflix, Inc. | 0,00 | 2,73 | 0,30 | 47,32 | 0,2099 | 0,0473 | |||
| TMO / Thermo Fisher Scientific Inc. | 0,00 | 3,09 | 0,30 | -15,82 | 0,2067 | -0,0743 | |||
| PGR / The Progressive Corporation | 0,00 | 0,82 | 0,30 | -5,14 | 0,2052 | -0,0414 | |||
| ACN / Accenture plc | 0,00 | -61,34 | 0,29 | -63,05 | 0,2038 | -0,4250 | |||
| XPO / XPO, Inc. | 0,00 | 0,26 | 0,29 | 17,67 | 0,2037 | 0,0059 | |||
| GM / General Motors Company | 0,01 | 0,32 | 0,29 | 5,05 | 0,2020 | -0,0179 | |||
| CMG / Chipotle Mexican Grill, Inc. | 0,01 | -11,84 | 0,28 | -1,41 | 0,1948 | -0,0310 | |||
| UNM / Unum Group | 0,00 | 0,09 | 0,28 | -0,71 | 0,1947 | -0,0295 | |||
| AFRM / Affirm Holdings, Inc. | 0,00 | 0,28 | 0,1928 | 0,1928 | |||||
| KMB / Kimberly-Clark Corporation | 0,00 | -0,97 | 0,28 | -10,36 | 0,1925 | -0,0526 | |||
| IP / International Paper Company | 0,01 | -0,03 | 0,27 | -12,46 | 0,1905 | -0,0576 | |||
| SHOP / Shopify Inc. | 0,00 | 0,27 | 0,1861 | 0,1861 | |||||
| HON / Honeywell International Inc. | 0,00 | 0,00 | 0,27 | 10,29 | 0,1861 | -0,0071 | |||
| URI / United Rentals, Inc. | 0,00 | 0,00 | 0,26 | 20,09 | 0,1829 | 0,0091 | |||
| EPD / Enterprise Products Partners L.P. - Limited Partnership | 0,01 | 0,27 | 0,26 | -9,09 | 0,1810 | -0,0460 | |||
| RCL / Royal Caribbean Cruises Ltd. | 0,00 | 0,26 | 0,1783 | 0,1783 | |||||
| AMAT / Applied Materials, Inc. | 0,00 | 0,25 | 0,1719 | 0,1719 | |||||
| CHTR / Charter Communications, Inc. | 0,00 | 0,67 | 0,25 | 11,31 | 0,1712 | -0,0040 | |||
| AVA / Avista Corporation | 0,01 | 0,00 | 0,25 | -9,56 | 0,1711 | -0,0446 | |||
| WFC / Wells Fargo & Company | 0,00 | 0,81 | 0,24 | 12,26 | 0,1655 | -0,0026 | |||
| GOOGL / Alphabet Inc. | 0,00 | 3,97 | 0,24 | 18,00 | 0,1642 | 0,0052 | |||
| T / AT&T Inc. | 0,01 | -2,70 | 0,23 | -0,43 | 0,1612 | -0,0238 | |||
| CVE / Cenovus Energy Inc. | 0,02 | 0,48 | 0,23 | -1,69 | 0,1611 | -0,0263 | |||
| WELL / Welltower Inc. | 0,00 | 0,47 | 0,23 | 0,88 | 0,1588 | -0,0212 | |||
| FDX / FedEx Corporation | 0,00 | 0,00 | 0,23 | -6,58 | 0,1576 | -0,0355 | |||
| FCX / Freeport-McMoRan Inc. | 0,01 | 0,23 | 0,1572 | 0,1572 | |||||
| TRP / TC Energy Corporation | 0,00 | 0,22 | 0,1556 | 0,1556 | |||||
| TFII / TFI International Inc. | 0,00 | 0,22 | 0,1555 | 0,1555 | |||||
| LIN / Linde plc | 0,00 | -34,59 | 0,22 | -34,04 | 0,1519 | -0,1116 | |||
| AIZ / Assurant, Inc. | 0,00 | 0,00 | 0,22 | -5,65 | 0,1507 | -0,0322 | |||
| ODFL / Old Dominion Freight Line, Inc. | 0,00 | 0,53 | 0,22 | -1,38 | 0,1495 | -0,0238 | |||
| BA / The Boeing Company | 0,00 | 0,21 | 0,1484 | 0,1484 | |||||
| BURL / Burlington Stores, Inc. | 0,00 | 0,44 | 0,21 | -1,87 | 0,1458 | -0,0241 | |||
| IR / Ingersoll Rand Inc. | 0,00 | 0,68 | 0,21 | 4,50 | 0,1452 | -0,0133 | |||
| COP / ConocoPhillips | 0,00 | 0,09 | 0,21 | -14,52 | 0,1434 | -0,0482 | |||
| NOW / ServiceNow, Inc. | 0,00 | 0,21 | 0,1426 | 0,1426 | |||||
| ANET / Arista Networks Inc | 0,00 | 0,21 | 0,1425 | 0,1425 | |||||
| XEL / Xcel Energy Inc. | 0,00 | -25,07 | 0,20 | -27,92 | 0,1417 | -0,0829 | |||
| BKR / Baker Hughes Company | 0,00 | -100,00 | 0,00 | 0,0000 | |||||
| ETR / Entergy Corporation | 0,00 | -100,00 | 0,00 | 0,0000 | |||||
| PEP / PepsiCo, Inc. | 0,00 | -100,00 | 0,00 | 0,0000 | |||||
| PYPL / PayPal Holdings, Inc. | 0,00 | -100,00 | 0,00 | 0,0000 | |||||
| SAIA / Saia, Inc. | 0,00 | -100,00 | 0,00 | 0,0000 | |||||
| FITB / Fifth Third Bancorp | 0,00 | -100,00 | 0,00 | 0,0000 | |||||
| FI / Fiserv, Inc. | 0,00 | -100,00 | 0,00 | 0,0000 | |||||
| EPAM / EPAM Systems, Inc. | 0,00 | -100,00 | 0,00 | 0,0000 | |||||
| CRM / Salesforce, Inc. | 0,00 | -100,00 | 0,00 | 0,0000 | |||||
| UBER / Uber Technologies, Inc. | 0,00 | -100,00 | 0,00 | 0,0000 | |||||
| NXPI / NXP Semiconductors N.V. | 0,00 | -100,00 | 0,00 | 0,0000 |