Grundlæggende statistik
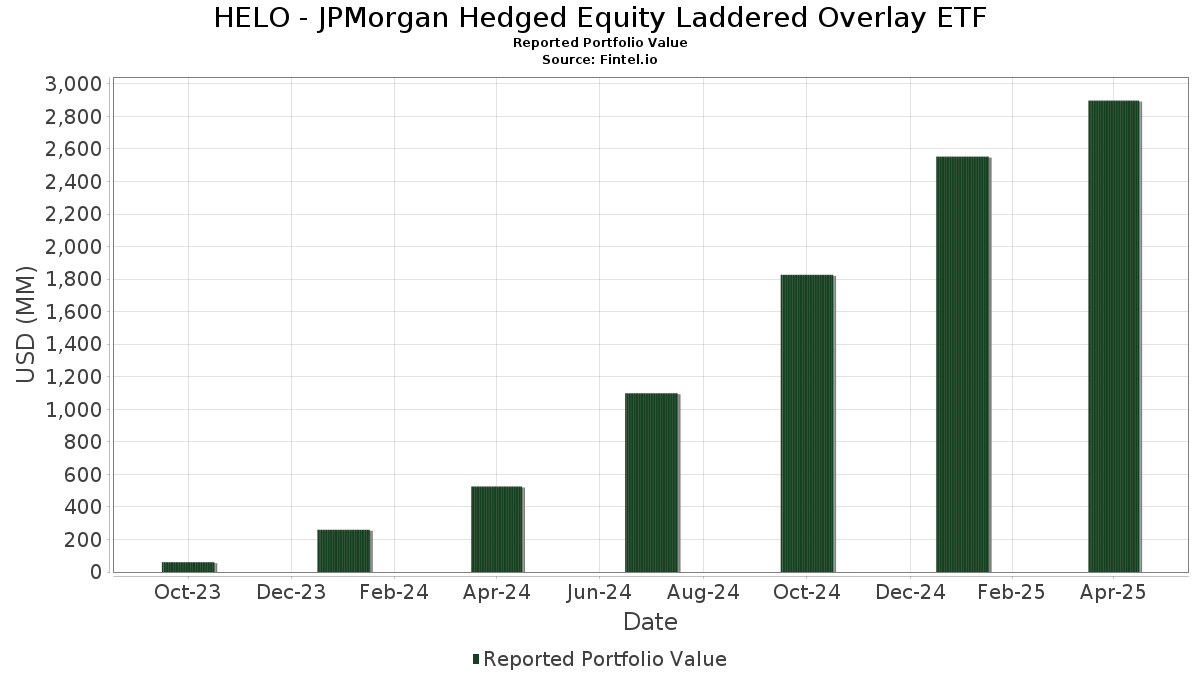
| Porteføljeværdi | $ 2.897.060.087 |
| Nuværende stillinger | 169 |
Seneste beholdninger, ydeevne, AUM (fra 13F, 13D)
HELO - JPMorgan Hedged Equity Laddered Overlay ETF har afsløret 169 samlede besiddelser i deres seneste SEC-arkivering. Den seneste porteføljeværdi er beregnet til at være $ 2.897.060.087 USD. Faktiske aktiver under forvaltning (AUM) er denne værdi plus kontanter (som ikke er oplyst). HELO - JPMorgan Hedged Equity Laddered Overlay ETFs største beholdninger er Microsoft Corporation (US:MSFT) , Apple Inc. (US:AAPL) , NVIDIA Corporation (US:NVDA) , Amazon.com, Inc. (US:AMZN) , and Meta Platforms, Inc. (US:META) . HELO - JPMorgan Hedged Equity Laddered Overlay ETFs nye stillinger omfatter 3M Company (US:MMM) , Apollo Global Management, Inc. (US:APO) , Palantir Technologies Inc. (US:PLTR) , Toast, Inc. (US:TOST) , and Equifax Inc. (US:EFX) .
Top øger dette kvartal
Vi bruger ændringen i porteføljeallokeringen, fordi dette er den mest meningsfulde metrik. Ændringer kan skyldes handler eller ændringer i aktiekurser.
| Sikkerhed | Aktier (MM) |
Værdi (MM$) |
Portefølje % | ΔPortefølje % |
|---|---|---|---|---|
| 30,29 | 1,0472 | 1,0472 | ||
| 19,68 | 0,6805 | 0,6805 | ||
| 18,63 | 0,6440 | 0,6440 | ||
| 0,14 | 17,05 | 0,5895 | 0,5895 | |
| 0,09 | 11,84 | 0,4094 | 0,4094 | |
| 0,01 | 11,42 | 0,3949 | 0,3310 | |
| 0,07 | 9,55 | 0,3302 | 0,3302 | |
| 0,01 | 14,95 | 0,5170 | 0,3215 | |
| 0,10 | 52,26 | 1,8070 | 0,3170 | |
| 0,07 | 8,40 | 0,2904 | 0,2904 |
Top falder i dette kvartal
Vi bruger ændringen i porteføljeallokeringen, fordi dette er den mest meningsfulde metrik. Ændringer kan skyldes handler eller ændringer i aktiekurser.
| Sikkerhed | Aktier (MM) |
Værdi (MM$) |
Portefølje % | ΔPortefølje % |
|---|---|---|---|---|
| 0,64 | 117,60 | 4,0660 | -0,8612 | |
| 0,16 | 44,97 | 1,5549 | -0,5125 | |
| 0,16 | 85,87 | 2,9691 | -0,4955 | |
| 0,19 | 30,38 | 1,0505 | -0,4779 | |
| 0,36 | 56,58 | 1,9561 | -0,4377 | |
| -9,44 | -0,3264 | -0,3264 | ||
| -9,44 | -0,3264 | -0,3264 | ||
| 0,00 | 10,61 | 0,3670 | -0,3029 | |
| 1,59 | 173,38 | 5,9946 | -0,2710 | |
| 0,08 | 34,28 | 1,1852 | -0,2617 |
13F og Fondsarkivering
Denne formular blev indsendt den 2025-06-24 for rapporteringsperioden 2025-04-30. Klik på linkikonet for at se den fulde transaktionshistorik.
Opgrader for at låse op for premium-data og eksportere til Excel ![]() .
.
| Sikkerhed | Type | Gennemsnitlig aktiekurs | Aktier (MM) |
Δ Aktier (%) |
Δ Aktier (%) |
Værdi ($MM) |
Portefølje (%) |
ΔPortefølje (%) |
|
|---|---|---|---|---|---|---|---|---|---|
| MSFT / Microsoft Corporation | 0,52 | 21,75 | 203,97 | 15,95 | 7,0524 | 0,1755 | |||
| AAPL / Apple Inc. | 0,89 | 21,24 | 188,18 | 9,17 | 6,5063 | -0,2318 | |||
| NVDA / NVIDIA Corporation | 1,59 | 19,24 | 173,38 | 8,17 | 5,9946 | -0,2710 | |||
| AMZN / Amazon.com, Inc. | 0,64 | 20,24 | 117,60 | -6,70 | 4,0660 | -0,8612 | |||
| META / Meta Platforms, Inc. | 0,16 | 21,63 | 85,87 | -3,11 | 2,9691 | -0,4955 | |||
| GOOGL / Alphabet Inc. | 0,36 | 18,69 | 56,58 | -7,61 | 1,9561 | -0,4377 | |||
| AVGO / Broadcom Inc. | 0,28 | 34,99 | 54,04 | 17,42 | 1,8683 | 0,0693 | |||
| BRK.B / Berkshire Hathaway Inc. | 0,10 | 20,51 | 52,26 | 37,12 | 1,8070 | 0,3170 | |||
| MA / Mastercard Incorporated | 0,09 | 10,67 | 50,63 | 9,20 | 1,7504 | -0,0618 | |||
| V / Visa Inc. | 0,14 | 13,05 | 48,81 | 14,27 | 1,6875 | 0,0179 | |||
| TSLA / Tesla, Inc. | 0,16 | 21,93 | 44,97 | -14,97 | 1,5549 | -0,5125 | |||
| XOM / Exxon Mobil Corporation | 0,42 | 20,45 | 43,99 | 19,10 | 1,5209 | 0,0771 | |||
| LLY / Eli Lilly and Company | 0,04 | 20,12 | 37,51 | 33,13 | 1,2970 | 0,1955 | |||
| ABBV / AbbVie Inc. | 0,19 | 18,21 | 37,13 | 25,41 | 1,2839 | 0,1264 | |||
| UNH / UnitedHealth Group Incorporated | 0,08 | 22,11 | 34,28 | -7,39 | 1,1852 | -0,2617 | |||
| BAC / Bank of America Corporation | 0,79 | 19,17 | 31,47 | 2,65 | 1,0881 | -0,1104 | |||
| GOOG / Alphabet Inc. | 0,19 | -0,69 | 30,38 | -22,29 | 1,0505 | -0,4779 | |||
| MCD / McDonald's Corporation | 0,09 | 18,55 | 30,37 | 31,26 | 1,0499 | 0,1456 | |||
| SPDR S&P 500 ETF Trust / DE (N/A) | 30,29 | 1,0472 | 1,0472 | ||||||
| WFC / Wells Fargo & Company | 0,41 | 22,94 | 29,28 | 10,79 | 1,0123 | -0,0208 | |||
| TT / Trane Technologies plc | 0,07 | 24,75 | 28,30 | 31,82 | 0,9785 | 0,1392 | |||
| PEP / PepsiCo, Inc. | 0,21 | 31,31 | 27,85 | 18,15 | 0,9628 | 0,0414 | |||
| LOW / Lowe's Companies, Inc. | 0,12 | 20,63 | 27,06 | 3,70 | 0,9357 | -0,0844 | |||
| SO / The Southern Company | 0,29 | 17,88 | 26,51 | 29,02 | 0,9164 | 0,1134 | |||
| JNJ / Johnson & Johnson | 0,17 | 51,82 | 26,12 | 55,98 | 0,9030 | 0,2484 | |||
| CRM / Salesforce, Inc. | 0,10 | 22,91 | 25,96 | -3,34 | 0,8977 | -0,1523 | |||
| PGR / The Progressive Corporation | 0,09 | 21,95 | 25,66 | 39,42 | 0,8873 | 0,1677 | |||
| LIN / Linde plc | 0,06 | 20,34 | 25,03 | 22,26 | 0,8653 | 0,0651 | |||
| TMO / Thermo Fisher Scientific Inc. | 0,06 | 29,09 | 23,61 | -7,35 | 0,8162 | -0,1798 | |||
| SYK / Stryker Corporation | 0,06 | 27,54 | 23,34 | 21,88 | 0,8072 | 0,0584 | |||
| NEE / NextEra Energy, Inc. | 0,35 | 20,48 | 23,10 | 12,60 | 0,7986 | -0,0032 | |||
| HWM / Howmet Aerospace Inc. | 0,17 | 20,50 | 23,10 | 31,92 | 0,7986 | 0,1142 | |||
| NOW / ServiceNow, Inc. | 0,02 | 21,05 | 22,95 | 13,52 | 0,7936 | 0,0032 | |||
| ORCL / Oracle Corporation | 0,15 | 56,71 | 21,37 | 29,68 | 0,7389 | 0,0947 | |||
| COP / ConocoPhillips | 0,24 | 23,68 | 21,04 | 11,53 | 0,7275 | -0,0100 | |||
| ADI / Analog Devices, Inc. | 0,10 | 20,30 | 20,40 | 10,67 | 0,7053 | -0,0153 | |||
| SPDR S&P 500 ETF Trust / DE (N/A) | 19,68 | 0,6805 | 0,6805 | ||||||
| MDLZ / Mondelez International, Inc. | 0,29 | 0,66 | 19,54 | 18,25 | 0,6757 | 0,0297 | |||
| TXN / Texas Instruments Incorporated | 0,12 | 20,52 | 19,44 | 4,49 | 0,6723 | -0,0552 | |||
| KO / The Coca-Cola Company | 0,26 | 11,12 | 18,92 | 27,01 | 0,6540 | 0,0718 | |||
| SPDR S&P 500 ETF Trust / DE (N/A) | 18,63 | 0,6440 | 0,6440 | ||||||
| BSX / Boston Scientific Corporation | 0,18 | 20,57 | 18,52 | 21,16 | 0,6402 | 0,0428 | |||
| AJG / Arthur J. Gallagher & Co. | 0,06 | 39,75 | 18,41 | 48,49 | 0,6366 | 0,1519 | |||
| NXPI / NXP Semiconductors N.V. | 0,10 | 20,67 | 17,96 | 6,65 | 0,6211 | -0,0373 | |||
| DE / Deere & Company | 0,04 | -3,65 | 17,65 | -6,28 | 0,6101 | -0,1259 | |||
| TDG / TransDigm Group Incorporated | 0,01 | 21,36 | 17,55 | 26,71 | 0,6068 | 0,0654 | |||
| UBER / Uber Technologies, Inc. | 0,22 | 10,91 | 17,54 | 34,40 | 0,6064 | 0,0963 | |||
| BMY / Bristol-Myers Squibb Company | 0,34 | 16,60 | 17,26 | -0,71 | 0,5968 | -0,0827 | |||
| RTX / RTX Corporation | 0,14 | 17,05 | 0,5895 | 0,5895 | |||||
| SCHW / The Charles Schwab Corporation | 0,21 | 38,51 | 16,99 | 36,29 | 0,5876 | 0,1002 | |||
| CMCSA / Comcast Corporation | 0,48 | 26,89 | 16,41 | 28,93 | 0,5675 | 0,0699 | |||
| ROST / Ross Stores, Inc. | 0,12 | 21,33 | 16,07 | 12,01 | 0,5555 | -0,0052 | |||
| YUM / Yum! Brands, Inc. | 0,11 | 14,76 | 16,03 | 32,30 | 0,5542 | 0,0806 | |||
| COST / Costco Wholesale Corporation | 0,02 | 16,62 | 15,88 | 18,36 | 0,5489 | 0,0246 | |||
| MGMXX / JPMorgan Trust II - JPMorgan U.S. Government Money Market Fund IM | 15,69 | 71,32 | 15,69 | 71,33 | 0,5425 | 0,1845 | |||
| VTR / Ventas, Inc. | 0,22 | 17,75 | 15,29 | 36,57 | 0,5285 | 0,0910 | |||
| MDT / Medtronic plc | 0,18 | 11,73 | 15,18 | 4,27 | 0,5250 | -0,0442 | |||
| CMG / Chipotle Mexican Grill, Inc. | 0,30 | 33,15 | 15,12 | 15,28 | 0,5229 | 0,0101 | |||
| NFLX / Netflix, Inc. | 0,01 | 286,54 | 14,95 | 596,41 | 0,5170 | 0,3215 | |||
| CME / CME Group Inc. | 0,05 | -16,29 | 14,82 | -1,93 | 0,5126 | -0,0784 | |||
| GS / The Goldman Sachs Group, Inc. | 0,03 | 1,76 | 14,63 | -12,99 | 0,5059 | -0,1515 | |||
| DIS / The Walt Disney Company | 0,16 | 61,81 | 14,60 | 30,16 | 0,5048 | 0,0663 | |||
| VRTX / Vertex Pharmaceuticals Incorporated | 0,03 | 7,40 | 14,32 | 18,52 | 0,4951 | 0,0228 | |||
| KDP / Keurig Dr Pepper Inc. | 0,41 | 109,37 | 14,26 | 125,63 | 0,4929 | 0,2459 | |||
| OTIS / Otis Worldwide Corporation | 0,14 | 14,24 | 13,93 | 15,25 | 0,4818 | 0,0092 | |||
| T / AT&T Inc. | 0,50 | 26,73 | 13,87 | 47,94 | 0,4794 | 0,1130 | |||
| CTSH / Cognizant Technology Solutions Corporation | 0,19 | 14,17 | 13,80 | 1,68 | 0,4772 | -0,0534 | |||
| AON / Aon plc | 0,04 | 6,68 | 13,53 | 2,07 | 0,4679 | -0,0504 | |||
| FLT / Corpay, Inc. | 0,04 | 20,97 | 13,19 | 3,44 | 0,4560 | -0,0424 | |||
| PM / Philip Morris International Inc. | 0,08 | 20,68 | 13,02 | 58,85 | 0,4503 | 0,1298 | |||
| CI / The Cigna Group | 0,04 | 40,18 | 12,97 | 62,03 | 0,4483 | 0,1355 | |||
| HLT / Hilton Worldwide Holdings Inc. | 0,06 | 20,76 | 12,71 | 6,33 | 0,4394 | -0,0278 | |||
| LRCX / Lam Research Corporation | 0,18 | 40,43 | 12,61 | 24,17 | 0,4359 | 0,0390 | |||
| STX / Seagate Technology Holdings plc | 0,14 | 20,41 | 12,54 | 13,75 | 0,4334 | 0,0026 | |||
| FIS / Fidelity National Information Services, Inc. | 0,15 | -5,31 | 12,16 | -8,32 | 0,4205 | -0,0981 | |||
| CARR / Carrier Global Corporation | 0,19 | 23,27 | 11,93 | 17,91 | 0,4127 | 0,0170 | |||
| EOG / EOG Resources, Inc. | 0,11 | 21,20 | 11,90 | 6,31 | 0,4115 | -0,0261 | |||
| REGN / Regeneron Pharmaceuticals, Inc. | 0,02 | 13,14 | 11,86 | 0,66 | 0,4099 | -0,0505 | |||
| MMM / 3M Company | 0,09 | 11,84 | 0,4094 | 0,4094 | |||||
| UPS / United Parcel Service, Inc. | 0,12 | 20,52 | 11,77 | 0,55 | 0,4068 | -0,0506 | |||
| C / Citigroup Inc. | 0,17 | 33,52 | 11,70 | 12,12 | 0,4046 | -0,0034 | |||
| BKNG / Booking Holdings Inc. | 0,00 | -3,68 | 11,60 | 3,66 | 0,4011 | -0,0363 | |||
| WMT / Walmart Inc. | 0,12 | 1.259,43 | 11,54 | 700,14 | 0,3990 | -0,1557 | |||
| EQIX / Equinix, Inc. | 0,01 | 642,47 | 11,42 | 599,75 | 0,3949 | 0,3310 | |||
| ETN / Eaton Corporation plc | 0,04 | 43,03 | 11,17 | 28,99 | 0,3861 | 0,0477 | |||
| AXP / American Express Company | 0,04 | 48,26 | 11,02 | 24,42 | 0,3809 | 0,0348 | |||
| AMP / Ameriprise Financial, Inc. | 0,02 | 20,80 | 10,97 | 4,72 | 0,3793 | -0,0302 | |||
| LDOS / Leidos Holdings, Inc. | 0,07 | 20,65 | 10,91 | 25,03 | 0,3772 | 0,0361 | |||
| AZO / AutoZone, Inc. | 0,00 | -44,85 | 10,61 | -38,06 | 0,3670 | -0,3029 | |||
| FITB / Fifth Third Bancorp | 0,29 | 45,43 | 10,49 | 17,96 | 0,3627 | 0,0151 | |||
| SBAC / SBA Communications Corporation | 0,04 | 20,64 | 10,45 | 48,62 | 0,3614 | 0,0865 | |||
| CHTR / Charter Communications, Inc. | 0,03 | 32,83 | 10,15 | 50,67 | 0,3510 | 0,0876 | |||
| CAT / Caterpillar Inc. | 0,03 | 38,86 | 10,11 | 15,63 | 0,3494 | 0,0077 | |||
| TFC / Truist Financial Corporation | 0,26 | -12,12 | 10,05 | -29,24 | 0,3476 | -0,2078 | |||
| MU / Micron Technology, Inc. | 0,13 | 12,47 | 9,79 | -5,15 | 0,3383 | -0,0649 | |||
| APO / Apollo Global Management, Inc. | 0,07 | 9,55 | 0,3302 | 0,3302 | |||||
| PLD / Prologis, Inc. | 0,09 | 5,42 | 9,29 | -9,66 | 0,3212 | -0,0808 | |||
| WELL / Welltower Inc. | 0,06 | 20,48 | 9,28 | 34,70 | 0,3209 | 0,0516 | |||
| PCG / PG&E Corporation | 0,53 | 16,23 | 8,78 | 22,69 | 0,3036 | 0,0238 | |||
| EXPE / Expedia Group, Inc. | 0,05 | 36,24 | 8,63 | 25,07 | 0,2982 | 0,0286 | |||
| USB / U.S. Bancorp | 0,21 | 26,09 | 8,56 | 6,46 | 0,2959 | -0,0183 | |||
| INTU / Intuit Inc. | 0,01 | -0,71 | 8,46 | 3,56 | 0,2924 | -0,0268 | |||
| PLTR / Palantir Technologies Inc. | 0,07 | 8,40 | 0,2904 | 0,2904 | |||||
| BURL / Burlington Stores, Inc. | 0,04 | 49,39 | 8,25 | 18,41 | 0,2851 | 0,0129 | |||
| EW / Edwards Lifesciences Corporation | 0,11 | 47,76 | 8,19 | 53,97 | 0,2832 | 0,0752 | |||
| CSX / CSX Corporation | 0,27 | -7,79 | 7,60 | -21,26 | 0,2628 | -0,1145 | |||
| VST / Vistra Corp. | 0,06 | 228,63 | 7,46 | 153,52 | 0,2580 | 0,1429 | |||
| PPG / PPG Industries, Inc. | 0,07 | 50,16 | 7,41 | 41,67 | 0,2563 | 0,0518 | |||
| PCAR / PACCAR Inc | 0,08 | 106,47 | 7,40 | 67,97 | 0,2560 | 0,0837 | |||
| FANG / Diamondback Energy, Inc. | 0,05 | 21,30 | 6,83 | -2,57 | 0,2362 | -0,0379 | |||
| BKR / Baker Hughes Company | 0,18 | 15,10 | 6,41 | -11,78 | 0,2217 | -0,0624 | |||
| MAS / Masco Corporation | 0,10 | 20,35 | 6,33 | -7,99 | 0,2189 | -0,0501 | |||
| KVUE / Kenvue Inc. | 0,26 | -4,17 | 6,25 | 6,24 | 0,2161 | -0,0139 | |||
| FDX / FedEx Corporation | 0,03 | 0,87 | 6,10 | -19,89 | 0,2110 | -0,0868 | |||
| MO / Altria Group, Inc. | 0,10 | 20,32 | 6,07 | 36,27 | 0,2098 | 0,0357 | |||
| ANET / Arista Networks Inc | 0,07 | 41,78 | 6,02 | 1,23 | 0,2082 | -0,0243 | |||
| TXT / Textron Inc. | 0,08 | 20,39 | 5,96 | 10,73 | 0,2059 | -0,0043 | |||
| AMD / Advanced Micro Devices, Inc. | 0,06 | -18,70 | 5,80 | -31,74 | 0,2004 | -0,1316 | |||
| MCK / McKesson Corporation | 0,01 | 20,28 | 5,63 | 44,17 | 0,1948 | 0,0420 | |||
| RCL / Royal Caribbean Cruises Ltd. | 0,02 | 10,89 | 5,33 | -10,60 | 0,1843 | -0,0488 | |||
| DASH / DoorDash, Inc. | 0,03 | 64,67 | 5,30 | 68,24 | 0,1832 | 0,0601 | |||
| CHD / Church & Dwight Co., Inc. | 0,05 | -30,80 | 5,08 | -34,85 | 0,1755 | -0,1291 | |||
| IR / Ingersoll Rand Inc. | 0,07 | 20,36 | 5,05 | -3,22 | 0,1747 | -0,0294 | |||
| MLM / Martin Marietta Materials, Inc. | 0,01 | 21,16 | 5,03 | 16,69 | 0,1738 | 0,0054 | |||
| LYB / LyondellBasell Industries N.V. | 0,08 | 20,32 | 4,82 | -7,48 | 0,1668 | -0,0370 | |||
| HUM / Humana Inc. | 0,02 | 20,36 | 4,65 | 7,64 | 0,1608 | -0,0081 | |||
| DAL / Delta Air Lines, Inc. | 0,11 | 20,58 | 4,48 | -25,37 | 0,1548 | -0,0797 | |||
| MSI / Motorola Solutions, Inc. | 0,01 | 17,40 | 4,38 | 10,18 | 0,1516 | -0,0040 | |||
| COF / Capital One Financial Corporation | 0,02 | 147,96 | 4,17 | 119,52 | 0,1443 | 0,0699 | |||
| CDNS / Cadence Design Systems, Inc. | 0,01 | 20,05 | 4,15 | 20,11 | 0,1435 | 0,0084 | |||
| ELS / Equity LifeStyle Properties, Inc. | 0,06 | -8,82 | 3,95 | -9,77 | 0,1367 | -0,0346 | |||
| TOST / Toast, Inc. | 0,11 | 3,81 | 0,1318 | 0,1318 | |||||
| ABT / Abbott Laboratories | 0,03 | -31,39 | 3,69 | -29,89 | 0,1275 | -0,0781 | |||
| SHW / The Sherwin-Williams Company | 0,01 | 55,15 | 3,68 | 52,89 | 0,1274 | 0,0332 | |||
| DOW / Dow Inc. | 0,12 | -38,78 | 3,68 | -52,04 | 0,1273 | -0,1728 | |||
| URI / United Rentals, Inc. | 0,01 | 74,84 | 3,68 | 45,62 | 0,1272 | 0,0284 | |||
| MRK / Merck & Co., Inc. | 0,04 | -12,54 | 3,67 | -24,59 | 0,1267 | -0,0633 | |||
| D / Dominion Energy, Inc. | 0,07 | -35,59 | 3,66 | -37,00 | 0,1264 | -0,1004 | |||
| EFX / Equifax Inc. | 0,01 | 3,66 | 0,1264 | 0,1264 | |||||
| ADBE / Adobe Inc. | 0,01 | 21,43 | 3,56 | 4,09 | 0,1232 | -0,0106 | |||
| DELL / Dell Technologies Inc. | 0,04 | 3,48 | 0,1204 | 0,1204 | |||||
| RJF / Raymond James Financial, Inc. | 0,03 | 3,47 | 0,1199 | 0,1199 | |||||
| CCL / Carnival Corporation & plc | 0,19 | 20,37 | 3,43 | -20,20 | 0,1187 | -0,0495 | |||
| HCA / HCA Healthcare, Inc. | 0,01 | 20,50 | 3,38 | 26,04 | 0,1170 | 0,0120 | |||
| BBY / Best Buy Co., Inc. | 0,05 | -8,05 | 3,38 | -28,59 | 0,1168 | -0,0681 | |||
| LEN / Lennar Corporation | 0,03 | 20,31 | 3,22 | -0,43 | 0,1112 | -0,0151 | |||
| FICO / Fair Isaac Corporation | 0,00 | 22,14 | 3,21 | 29,70 | 0,1108 | 0,0142 | |||
| FCX / Freeport-McMoRan Inc. | 0,09 | 3,12 | 0,1078 | 0,1078 | |||||
| TE Connectivity plc / EC (IE000IVNQZ81) | 0,02 | 21,10 | 2,81 | 19,80 | 0,0973 | 0,0055 | |||
| WMG / Warner Music Group Corp. | 0,09 | 8,29 | 2,64 | 3,70 | 0,0912 | -0,0082 | |||
| NUE / Nucor Corporation | 0,02 | 19,98 | 2,62 | 11,48 | 0,0907 | -0,0013 | |||
| ETR / Entergy Corporation | 0,03 | 38,32 | 2,61 | 41,86 | 0,0901 | 0,0183 | |||
| Aptiv plc / EC (JE00BTDN8H13) | 0,04 | 20,18 | 2,26 | 9,85 | 0,0783 | -0,0023 | |||
| NBIX / Neurocrine Biosciences, Inc. | 0,02 | 21,31 | 2,05 | -13,95 | 0,0710 | -0,0223 | |||
| ACN / Accenture plc | 0,01 | -53,66 | 1,73 | -63,99 | 0,0598 | -0,1279 | |||
| BAX / Baxter International Inc. | 0,05 | 20,69 | 1,70 | 15,57 | 0,0588 | 0,0013 | |||
| NRG / NRG Energy, Inc. | 0,01 | 21,46 | 1,46 | 29,88 | 0,0504 | 0,0065 | |||
| ARE / Alexandria Real Estate Equities, Inc. | 0,02 | 21,20 | 1,11 | -9,51 | 0,0385 | -0,0096 | |||
| WEX / WEX Inc. | 0,01 | 19,53 | 1,07 | -15,23 | 0,0371 | -0,0124 | |||
| WDC / Western Digital Corporation | 0,02 | -59,60 | 1,05 | -72,81 | 0,0362 | -0,1143 | |||
| SRPT / Sarepta Therapeutics, Inc. | 0,01 | 21,85 | 0,59 | -33,14 | 0,0202 | -0,0140 | |||
| SNDK / Sandisk Corporation | 0,01 | 0,25 | 0,0088 | 0,0088 | |||||
| SLB / Schlumberger Limited | 0,00 | 0,11 | 0,0038 | 0,0038 | |||||
| BIIB / Biogen Inc. | 0,00 | -100,00 | 0,00 | -100,00 | -0,1021 | ||||
| MRVL / Marvell Technology, Inc. | 0,00 | -100,00 | 0,00 | -100,00 | -0,0768 | ||||
| SIRI / Sirius XM Holdings Inc. | 0,00 | -100,00 | 0,00 | -100,00 | -0,0599 | ||||
| SPDR S&P 500 ETF Trust / DE (N/A) | -0,20 | -0,0070 | -0,0070 | ||||||
| SPDR S&P 500 ETF Trust / DE (N/A) | -2,09 | -0,0721 | -0,0721 | ||||||
| SPDR S&P 500 ETF Trust / DE (N/A) | -3,04 | -0,1049 | -0,1049 | ||||||
| SPDR S&P 500 ETF Trust / DE (N/A) | -4,02 | -0,1389 | -0,1389 | ||||||
| SPDR S&P 500 ETF Trust / DE (N/A) | -9,44 | -0,3264 | -0,3264 | ||||||
| SPDR S&P 500 ETF Trust / DE (N/A) | -9,44 | -0,3264 | -0,3264 |