Grundlæggende statistik
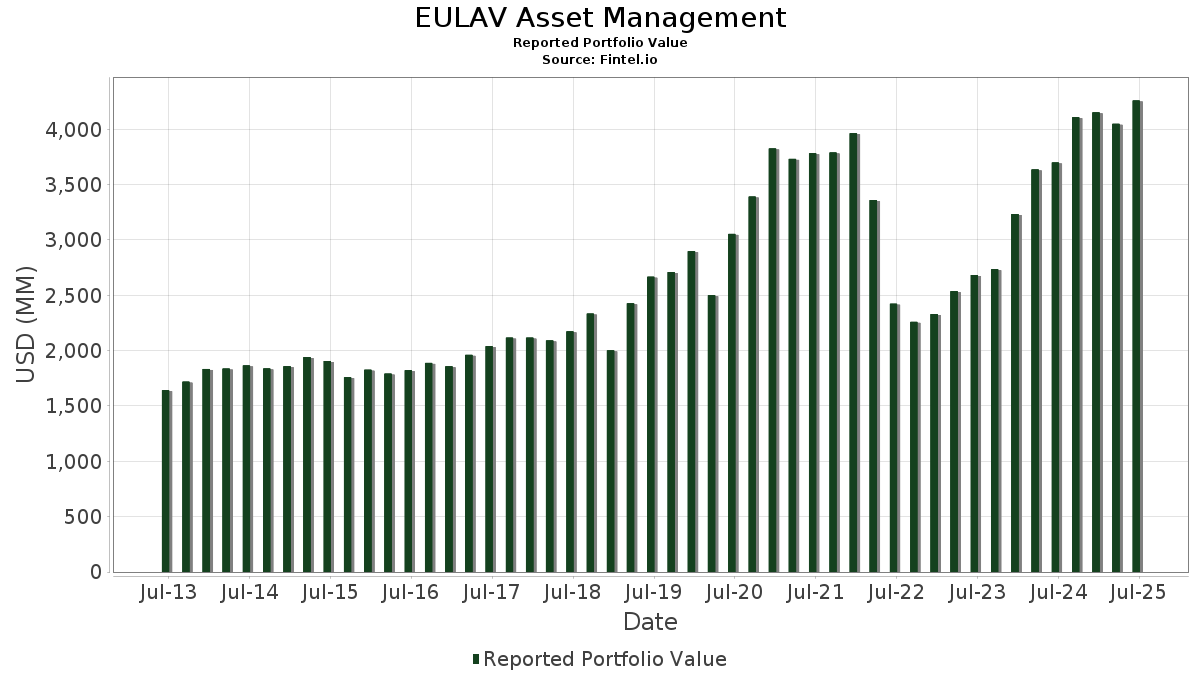
| Porteføljeværdi | $ 4.259.348.107 |
| Nuværende stillinger | 160 |
Seneste beholdninger, ydeevne, AUM (fra 13F, 13D)
EULAV Asset Management har afsløret 160 samlede besiddelser i deres seneste SEC-arkivering. Den seneste porteføljeværdi er beregnet til at være $ 4.259.348.107 USD. Faktiske aktiver under forvaltning (AUM) er denne værdi plus kontanter (som ikke er oplyst). EULAV Asset Managements største beholdninger er HEICO Corporation (US:HEI) , Tyler Technologies, Inc. (US:TYL) , MSCI Inc. (US:MSCI) , Waste Connections, Inc. (US:WCN) , and Cintas Corporation (US:CTAS) .
Top øger dette kvartal
Vi bruger ændringen i porteføljeallokeringen, fordi dette er den mest meningsfulde metrik. Ændringer kan skyldes handler eller ændringer i aktiekurser.
| Sikkerhed | Aktier (MM) |
Værdi (MM$) |
Portefølje % | ΔPortefølje % |
|---|---|---|---|---|
| 0,13 | 71,11 | 1,6694 | 0,6138 | |
| 0,46 | 151,44 | 3,5554 | 0,5087 | |
| 0,06 | 20,66 | 0,4850 | 0,3868 | |
| 0,18 | 84,00 | 1,9720 | 0,3753 | |
| 0,38 | 60,22 | 1,4137 | 0,3427 | |
| 0,12 | 85,04 | 1,9966 | 0,3311 | |
| 0,12 | 70,50 | 1,6551 | 0,3276 | |
| 0,09 | 24,81 | 0,5826 | 0,2889 | |
| 0,13 | 67,70 | 1,5893 | 0,2803 | |
| 0,29 | 89,15 | 2,0930 | 0,2758 |
Top falder i dette kvartal
Vi bruger ændringen i porteføljeallokeringen, fordi dette er den mest meningsfulde metrik. Ændringer kan skyldes handler eller ændringer i aktiekurser.
| Sikkerhed | Aktier (MM) |
Værdi (MM$) |
Portefølje % | ΔPortefølje % |
|---|---|---|---|---|
| 0,04 | 64,87 | 1,5229 | -1,4923 | |
| 0,12 | 60,14 | 1,4121 | -0,4647 | |
| 0,62 | 115,90 | 2,7211 | -0,2713 | |
| 1,30 | 95,18 | 2,2346 | -0,2618 | |
| 0,08 | 24,55 | 0,5763 | -0,2184 | |
| 0,44 | 49,33 | 1,1581 | -0,2088 | |
| 0,31 | 48,70 | 1,1433 | -0,2022 | |
| 0,19 | 54,58 | 1,2815 | -0,1908 | |
| 0,22 | 87,80 | 2,0613 | -0,1903 | |
| 0,05 | 2,98 | 0,0699 | -0,1781 |
13F og Fondsarkivering
Denne formular blev indsendt den 2025-08-12 for rapporteringsperioden 2025-06-30. Klik på linkikonet for at se den fulde transaktionshistorik.
Opgrader for at låse op for premium-data og eksportere til Excel ![]() .
.
| Sikkerhed | Type | Gennemsnitlig aktiekurs | Aktier (MM) |
Δ Aktier (%) |
Δ Aktier (%) |
Værdi ($MM) |
Portefølje (%) |
ΔPortefølje (%) |
|
|---|---|---|---|---|---|---|---|---|---|
| HEI / HEICO Corporation | 0,46 | 0,00 | 151,44 | 22,76 | 3,5554 | 0,5087 | |||
| TYL / Tyler Technologies, Inc. | 0,25 | -0,00 | 147,67 | 1,97 | 3,4669 | -0,1097 | |||
| MSCI / MSCI Inc. | 0,20 | 0,01 | 117,64 | 1,99 | 2,7619 | -0,0867 | |||
| WCN / Waste Connections, Inc. | 0,62 | -0,00 | 115,90 | -4,34 | 2,7211 | -0,2713 | |||
| CTAS / Cintas Corporation | 0,50 | -8,92 | 111,80 | -1,23 | 2,6248 | -0,1707 | |||
| LII / Lennox International Inc. | 0,19 | 0,37 | 107,43 | 2,59 | 2,5221 | -0,0640 | |||
| FICO / Fair Isaac Corporation | 0,06 | 0,00 | 104,01 | -0,88 | 2,4419 | -0,1496 | |||
| WRB / W. R. Berkley Corporation | 1,30 | -8,80 | 95,18 | -5,84 | 2,2346 | -0,2618 | |||
| CDNS / Cadence Design Systems, Inc. | 0,29 | 0,00 | 89,15 | 21,16 | 2,0930 | 0,2758 | |||
| CASY / Casey's General Stores, Inc. | 0,17 | 2,11 | 88,89 | 20,04 | 2,0869 | 0,2582 | |||
| IT / Gartner, Inc. | 0,22 | 0,00 | 87,80 | -3,70 | 2,0613 | -0,1903 | |||
| MPWR / Monolithic Power Systems, Inc. | 0,12 | 0,00 | 85,04 | 26,10 | 1,9966 | 0,3311 | |||
| CACI / CACI International Inc | 0,18 | 0,00 | 84,00 | 29,92 | 1,9720 | 0,3753 | |||
| RSG / Republic Services, Inc. | 0,32 | -3,00 | 79,81 | -1,22 | 1,8737 | -0,1217 | |||
| MSI / Motorola Solutions, Inc. | 0,18 | 0,00 | 74,04 | -3,96 | 1,7384 | -0,1658 | |||
| FIX / Comfort Systems USA, Inc. | 0,13 | 0,00 | 71,11 | 66,36 | 1,6694 | 0,6138 | |||
| ROP / Roper Technologies, Inc. | 0,12 | 36,42 | 70,50 | 31,15 | 1,6551 | 0,3276 | |||
| IDXX / IDEXX Laboratories, Inc. | 0,13 | 0,00 | 67,70 | 27,72 | 1,5893 | 0,2803 | |||
| NOW / ServiceNow, Inc. | 0,06 | -2,72 | 66,17 | 25,62 | 1,5536 | 0,2526 | |||
| TDG / TransDigm Group Incorporated | 0,04 | -51,67 | 64,87 | -46,87 | 1,5229 | -1,4923 | |||
| AFG / American Financial Group, Inc. | 0,50 | 0,00 | 62,94 | -3,91 | 1,4778 | -0,1399 | |||
| CDW / CDW Corporation | 0,34 | 0,00 | 61,39 | 11,44 | 1,4412 | 0,0808 | |||
| NVDA / NVIDIA Corporation | 0,38 | -4,75 | 60,22 | 38,85 | 1,4137 | 0,3427 | |||
| CHE / Chemed Corporation | 0,12 | 0,02 | 60,14 | -20,85 | 1,4121 | -0,4647 | |||
| META / Meta Platforms, Inc. | 0,08 | -4,56 | 55,66 | 22,22 | 1,3069 | 0,1821 | |||
| COST / Costco Wholesale Corporation | 0,06 | -1,75 | 55,54 | 2,83 | 1,3039 | -0,0299 | |||
| ICE / Intercontinental Exchange, Inc. | 0,30 | 0,00 | 54,64 | 6,36 | 1,2829 | 0,0141 | |||
| POOL / Pool Corporation | 0,19 | 0,00 | 54,58 | -8,44 | 1,2815 | -0,1908 | |||
| BRO / Brown & Brown, Inc. | 0,44 | 0,00 | 49,33 | -10,88 | 1,1581 | -0,2088 | |||
| IQV / IQVIA Holdings Inc. | 0,31 | 0,00 | 48,70 | -10,61 | 1,1433 | -0,2022 | |||
| ATR / AptarGroup, Inc. | 0,31 | -0,00 | 48,22 | 5,42 | 1,1320 | 0,0025 | |||
| SYK / Stryker Corporation | 0,12 | 0,00 | 48,19 | 6,28 | 1,1315 | 0,0116 | |||
| TDY / Teledyne Technologies Incorporated | 0,09 | 17,42 | 47,64 | 20,87 | 1,1186 | 0,1451 | |||
| INTU / Intuit Inc. | 0,05 | -0,37 | 42,93 | 27,81 | 1,0080 | 0,1784 | |||
| GIB / CGI Inc. | 0,40 | 0,00 | 41,63 | 5,01 | 0,9774 | -0,0017 | |||
| SPGI / S&P Global Inc. | 0,07 | 0,00 | 35,96 | 3,78 | 0,8442 | -0,0115 | |||
| NFLX / Netflix, Inc. | 0,02 | -4,30 | 32,82 | 37,43 | 0,7704 | 0,1807 | |||
| AMZN / Amazon.com, Inc. | 0,15 | -1,67 | 32,37 | 13,39 | 0,7600 | 0,0549 | |||
| AMD / Advanced Micro Devices, Inc. | 0,23 | 17,53 | 32,35 | 62,33 | 0,7596 | 0,2673 | |||
| UBER / Uber Technologies, Inc. | 0,33 | -27,77 | 31,07 | -7,50 | 0,7294 | -0,1001 | |||
| WST / West Pharmaceutical Services, Inc. | 0,14 | 0,00 | 30,11 | -2,27 | 0,7069 | -0,0540 | |||
| CHDN / Churchill Downs Incorporated | 0,30 | 0,00 | 29,97 | -9,07 | 0,7037 | -0,1104 | |||
| RLI / RLI Corp. | 0,41 | 0,00 | 29,90 | -10,09 | 0,7020 | -0,1194 | |||
| MMC / Marsh & McLennan Companies, Inc. | 0,13 | 0,00 | 28,86 | -10,40 | 0,6776 | -0,1180 | |||
| GOOGL / Alphabet Inc. | 0,16 | 10,34 | 28,20 | 25,75 | 0,6620 | 0,1082 | |||
| MSFT / Microsoft Corporation | 0,06 | 2,73 | 28,12 | 36,12 | 0,6602 | 0,1500 | |||
| WWD / Woodward, Inc. | 0,11 | 5,58 | 27,84 | 41,80 | 0,6537 | 0,1687 | |||
| HOOD / Robinhood Markets, Inc. | 0,29 | -20,27 | 27,62 | 79,36 | 0,6485 | 0,2682 | |||
| EXEL / Exelixis, Inc. | 0,60 | 12,28 | 26,23 | 34,04 | 0,6158 | 0,1325 | |||
| EXPO / Exponent, Inc. | 0,35 | 0,00 | 25,78 | -7,83 | 0,6053 | -0,0856 | |||
| FSS / Federal Signal Corporation | 0,24 | 0,03 | 25,63 | 44,73 | 0,6018 | 0,1644 | |||
| MSTR / Strategy Inc | 0,06 | -16,67 | 25,26 | 16,85 | 0,5932 | 0,0592 | |||
| RBC / RBC Bearings Incorporated | 0,07 | 15,81 | 25,09 | 38,49 | 0,5890 | 0,1416 | |||
| SNPS / Synopsys, Inc. | 0,05 | -0,01 | 24,92 | 19,54 | 0,5850 | 0,0702 | |||
| AVGO / Broadcom Inc. | 0,09 | 26,75 | 24,81 | 108,69 | 0,5826 | 0,2889 | |||
| WSO / Watsco, Inc. | 0,06 | 0,00 | 24,69 | -13,12 | 0,5796 | -0,1222 | |||
| ACN / Accenture plc | 0,08 | -20,36 | 24,55 | -23,72 | 0,5763 | -0,2184 | |||
| COIN / Coinbase Global, Inc. | 0,07 | -10,39 | 24,19 | 82,37 | 0,5678 | 0,2403 | |||
| EXLS / ExlService Holdings, Inc. | 0,55 | 0,01 | 23,87 | -7,24 | 0,5604 | -0,0751 | |||
| ENSG / The Ensign Group, Inc. | 0,15 | 0,00 | 23,40 | 19,22 | 0,5494 | 0,0646 | |||
| WTS / Watts Water Technologies, Inc. | 0,09 | 15,44 | 22,64 | 39,20 | 0,5315 | 0,1298 | |||
| POST / Post Holdings, Inc. | 0,20 | 0,04 | 22,14 | -6,27 | 0,5198 | -0,0636 | |||
| FN / Fabrinet | 0,07 | 0,00 | 21,13 | 49,20 | 0,4961 | 0,1463 | |||
| TT / Trane Technologies plc | 0,05 | 0,00 | 21,00 | 29,82 | 0,4929 | 0,0935 | |||
| BMI / Badger Meter, Inc. | 0,08 | 3,67 | 20,75 | 33,48 | 0,4871 | 0,1032 | |||
| APP / AppLovin Corporation | 0,06 | 293,09 | 20,66 | 419,44 | 0,4850 | 0,3868 | |||
| V / Visa Inc. | 0,06 | -9,37 | 20,60 | -8,18 | 0,4837 | -0,0705 | |||
| AIT / Applied Industrial Technologies, Inc. | 0,08 | 20,34 | 19,53 | 24,14 | 0,4584 | 0,0700 | |||
| ZTS / Zoetis Inc. | 0,12 | 0,00 | 19,49 | -5,29 | 0,4577 | -0,0506 | |||
| TSLA / Tesla, Inc. | 0,06 | -1,63 | 19,38 | 20,58 | 0,4549 | 0,0580 | |||
| CRWD / CrowdStrike Holdings, Inc. | 0,03 | -18,57 | 17,42 | 17,63 | 0,4089 | 0,0432 | |||
| ROL / Rollins, Inc. | 0,30 | 0,00 | 17,19 | 4,42 | 0,4036 | -0,0030 | |||
| MTD / Mettler-Toledo International Inc. | 0,01 | 0,00 | 16,56 | -0,52 | 0,3889 | -0,0224 | |||
| AAON / AAON, Inc. | 0,21 | 0,00 | 15,38 | -5,61 | 0,3610 | -0,0413 | |||
| EXAS / Exact Sciences Corporation | 0,28 | -15,52 | 15,04 | 3,70 | 0,3531 | -0,0051 | |||
| SPSC / SPS Commerce, Inc. | 0,10 | 0,00 | 14,22 | 2,53 | 0,3339 | -0,0087 | |||
| CRS / Carpenter Technology Corporation | 0,05 | -0,06 | 13,54 | 52,45 | 0,3180 | 0,0986 | |||
| ROKU / Roku, Inc. | 0,15 | 30,43 | 13,18 | 62,75 | 0,3095 | 0,1095 | |||
| DKNG / DraftKings Inc. | 0,30 | 17,31 | 13,08 | 51,51 | 0,3071 | 0,0939 | |||
| CRM / Salesforce, Inc. | 0,05 | -8,65 | 12,95 | -7,18 | 0,3041 | -0,0405 | |||
| APPF / AppFolio, Inc. | 0,06 | 0,00 | 12,77 | 4,72 | 0,2998 | -0,0014 | |||
| MTSI / MACOM Technology Solutions Holdings, Inc. | 0,09 | 0,00 | 12,47 | 42,75 | 0,2928 | 0,0770 | |||
| MA / Mastercard Incorporated | 0,02 | 0,00 | 12,43 | 2,52 | 0,2918 | -0,0076 | |||
| PRI / Primerica, Inc. | 0,04 | 0,00 | 12,15 | -3,82 | 0,2853 | -0,0267 | |||
| RUSHA / Rush Enterprises, Inc. | 0,24 | 20,64 | 12,14 | 16,35 | 0,2851 | 0,0273 | |||
| GATX / GATX Corporation | 0,08 | 66,62 | 12,10 | 64,77 | 0,2841 | 0,1027 | |||
| MSA / MSA Safety Incorporated | 0,07 | 2,85 | 12,10 | 17,46 | 0,2840 | 0,0297 | |||
| JKHY / Jack Henry & Associates, Inc. | 0,07 | 0,00 | 12,02 | -1,33 | 0,2822 | -0,0187 | |||
| TMO / Thermo Fisher Scientific Inc. | 0,03 | 0,00 | 11,92 | -18,52 | 0,2799 | -0,0814 | |||
| GPI / Group 1 Automotive, Inc. | 0,03 | 0,00 | 11,27 | 14,33 | 0,2647 | 0,0212 | |||
| AYI / Acuity Inc. | 0,04 | 0,00 | 11,04 | 13,29 | 0,2592 | 0,0185 | |||
| MMSI / Merit Medical Systems, Inc. | 0,12 | 0,00 | 10,94 | -11,57 | 0,2568 | -0,0487 | |||
| SF / Stifel Financial Corp. | 0,10 | 0,00 | 10,84 | 10,10 | 0,2544 | 0,0113 | |||
| DHR / Danaher Corporation | 0,05 | 0,00 | 10,79 | -3,65 | 0,2532 | -0,0232 | |||
| KAI / Kadant Inc. | 0,03 | 0,00 | 10,67 | -5,78 | 0,2504 | -0,0292 | |||
| EME / EMCOR Group, Inc. | 0,02 | -46,43 | 10,49 | -22,48 | 0,2462 | -0,0879 | |||
| BKNG / Booking Holdings Inc. | 0,00 | -34,52 | 10,43 | -17,72 | 0,2449 | -0,0682 | |||
| VRTX / Vertex Pharmaceuticals Incorporated | 0,02 | -20,35 | 10,11 | -26,86 | 0,2373 | -0,1040 | |||
| PLUS / ePlus inc. | 0,14 | 0,00 | 10,02 | 18,13 | 0,2353 | 0,0258 | |||
| SHOP / Shopify Inc. | 0,08 | -11,58 | 9,69 | 6,82 | 0,2275 | 0,0035 | |||
| SIGI / Selective Insurance Group, Inc. | 0,11 | 0,00 | 9,55 | -5,34 | 0,2242 | -0,0250 | |||
| MDGL / Madrigal Pharmaceuticals, Inc. | 0,03 | 210,00 | 9,38 | 183,24 | 0,2203 | 0,1385 | |||
| SLGN / Silgan Holdings Inc. | 0,17 | 0,00 | 9,35 | 5,98 | 0,2196 | 0,0016 | |||
| CVCO / Cavco Industries, Inc. | 0,02 | 0,00 | 9,04 | -16,40 | 0,2121 | -0,0548 | |||
| WDAY / Workday, Inc. | 0,04 | -14,29 | 8,64 | -11,91 | 0,2028 | -0,0394 | |||
| RIVN / Rivian Automotive, Inc. | 0,62 | -8,82 | 8,52 | 0,61 | 0,2000 | -0,0091 | |||
| AJG / Arthur J. Gallagher & Co. | 0,03 | 0,00 | 8,13 | -7,28 | 0,1909 | -0,0257 | |||
| G / Genpact Limited | 0,18 | 0,00 | 7,92 | -12,65 | 0,1860 | -0,0380 | |||
| BLD / TopBuild Corp. | 0,02 | 0,00 | 7,90 | 6,17 | 0,1855 | 0,0017 | |||
| TXRH / Texas Roadhouse, Inc. | 0,04 | 0,00 | 7,80 | 12,48 | 0,1830 | 0,0118 | |||
| FFIN / First Financial Bankshares, Inc. | 0,21 | 0,00 | 7,43 | 0,16 | 0,1744 | -0,0088 | |||
| LLY / Eli Lilly and Company | 0,01 | 7,41 | 0,1739 | 0,1739 | |||||
| WING / Wingstop Inc. | 0,02 | 0,00 | 7,34 | 49,28 | 0,1723 | 0,0509 | |||
| CROX / Crocs, Inc. | 0,07 | 0,03 | 7,26 | -4,61 | 0,1705 | -0,0175 | |||
| CSL / Carlisle Companies Incorporated | 0,02 | 0,00 | 7,24 | 9,66 | 0,1701 | 0,0069 | |||
| FANG / Diamondback Energy, Inc. | 0,05 | -22,39 | 7,14 | -33,30 | 0,1677 | -0,0968 | |||
| JJSF / J&J Snack Foods Corp. | 0,06 | -31,59 | 7,12 | -41,10 | 0,1672 | -0,1314 | |||
| MEDP / Medpace Holdings, Inc. | 0,02 | 0,02 | 6,94 | 3,03 | 0,1629 | -0,0034 | |||
| NSIT / Insight Enterprises, Inc. | 0,05 | 0,01 | 6,89 | -7,93 | 0,1617 | -0,0230 | |||
| MU / Micron Technology, Inc. | 0,06 | 44,74 | 6,78 | 105,33 | 0,1591 | 0,0776 | |||
| AAPL / Apple Inc. | 0,03 | -35,30 | 6,78 | -40,24 | 0,1591 | -0,1210 | |||
| PGR / The Progressive Corporation | 0,03 | 0,00 | 6,75 | -5,71 | 0,1585 | -0,0183 | |||
| SAIC / Science Applications International Corporation | 0,06 | 0,05 | 6,71 | 0,34 | 0,1577 | -0,0076 | |||
| ANSS / ANSYS, Inc. | 0,02 | 0,00 | 6,64 | 10,97 | 0,1558 | 0,0081 | |||
| ACIW / ACI Worldwide, Inc. | 0,14 | -0,02 | 6,51 | -16,10 | 0,1528 | -0,0388 | |||
| SITE / SiteOne Landscape Supply, Inc. | 0,05 | 0,00 | 6,18 | -0,40 | 0,1451 | -0,0082 | |||
| ECL / Ecolab Inc. | 0,02 | 0,00 | 5,95 | 6,28 | 0,1398 | 0,0014 | |||
| GS / The Goldman Sachs Group, Inc. | 0,01 | -20,00 | 5,38 | 3,64 | 0,1263 | -0,0019 | |||
| AGO / Assured Guaranty Ltd. | 0,06 | 0,00 | 5,23 | -1,14 | 0,1227 | -0,0079 | |||
| BAC / Bank of America Corporation | 0,11 | -4,35 | 5,21 | 8,48 | 0,1222 | 0,0037 | |||
| BCPC / Balchem Corporation | 0,03 | 0,00 | 5,17 | -4,10 | 0,1215 | -0,0118 | |||
| BX / Blackstone Inc. | 0,03 | 13,33 | 5,09 | 21,27 | 0,1194 | 0,0158 | |||
| LSTR / Landstar System, Inc. | 0,03 | 0,00 | 4,70 | -7,45 | 0,1103 | -0,0151 | |||
| TNET / TriNet Group, Inc. | 0,06 | 0,03 | 4,63 | -7,66 | 0,1087 | -0,0151 | |||
| AWR / American States Water Company | 0,06 | 0,00 | 4,59 | -2,57 | 0,1078 | -0,0086 | |||
| IBKR / Interactive Brokers Group, Inc. | 0,07 | 204,82 | 4,05 | 1,99 | 0,0952 | -0,0030 | |||
| FELE / Franklin Electric Co., Inc. | 0,04 | -0,12 | 4,02 | -4,51 | 0,0944 | -0,0096 | |||
| SNAP / Snap Inc. | 0,46 | -30,30 | 4,00 | -30,46 | 0,0939 | -0,0481 | |||
| LYFT / Lyft, Inc. | 0,24 | 0,03 | 3,78 | 32,83 | 0,0888 | 0,0185 | |||
| JPM / JPMorgan Chase & Co. | 0,01 | -13,35 | 3,77 | 2,39 | 0,0885 | -0,0024 | |||
| DIS / The Walt Disney Company | 0,03 | 0,00 | 3,72 | 25,63 | 0,0873 | 0,0142 | |||
| TREX / Trex Company, Inc. | 0,06 | 0,00 | 3,48 | -6,40 | 0,0817 | -0,0101 | |||
| BABA / Alibaba Group Holding Limited - Depositary Receipt (Common Stock) | 0,03 | -3,33 | 3,29 | -17,10 | 0,0772 | -0,0208 | |||
| CXT / Crane NXT, Co. | 0,06 | 0,00 | 3,28 | 4,86 | 0,0769 | -0,0002 | |||
| HLT / Hilton Worldwide Holdings Inc. | 0,01 | -7,66 | 3,20 | 8,07 | 0,0751 | 0,0020 | |||
| DAL / Delta Air Lines, Inc. | 0,06 | -14,67 | 3,15 | -3,76 | 0,0739 | -0,0069 | |||
| QLYS / Qualys, Inc. | 0,02 | 0,04 | 3,10 | 13,51 | 0,0728 | 0,0053 | |||
| CMG / Chipotle Mexican Grill, Inc. | 0,05 | -73,50 | 2,98 | -70,37 | 0,0699 | -0,1781 | |||
| SNX / TD SYNNEX Corporation | 0,02 | 0,00 | 2,90 | 30,53 | 0,0682 | 0,0132 | |||
| WD / Walker & Dunlop, Inc. | 0,04 | 0,00 | 2,74 | -17,44 | 0,0644 | -0,0176 | |||
| NPO / Enpro Inc. | 0,01 | 0,00 | 2,53 | 18,41 | 0,0594 | 0,0066 | |||
| QCOM / QUALCOMM Incorporated | 0,02 | -16,51 | 2,39 | -13,42 | 0,0562 | -0,0121 | |||
| PYPL / PayPal Holdings, Inc. | 0,03 | 0,00 | 2,38 | 13,89 | 0,0558 | 0,0043 | |||
| DXCM / DexCom, Inc. | 0,03 | 0,00 | 2,36 | 27,87 | 0,0554 | 0,0098 | |||
| BMRN / BioMarin Pharmaceutical Inc. | 0,04 | -63,81 | 2,09 | -71,87 | 0,0490 | -0,1343 | |||
| PBH / Prestige Consumer Healthcare Inc. | 0,02 | 0,00 | 1,55 | -7,08 | 0,0364 | -0,0048 | |||
| HRI / Herc Holdings Inc. | 0,01 | 0,00 | 1,07 | -1,93 | 0,0250 | -0,0018 | |||
| ASGN / ASGN Incorporated | 0,02 | 0,00 | 1,00 | -20,77 | 0,0236 | -0,0077 | |||
| WK / Workiva Inc. | 0,01 | -84,42 | 0,81 | -85,96 | 0,0191 | -0,1241 | |||
| LFUS / Littelfuse, Inc. | 0,00 | 0,43 | 0,68 | 15,76 | 0,0160 | 0,0015 | |||
| ADBE / Adobe Inc. | 0,00 | -100,00 | 0,00 | 0,0000 | |||||
| LULU / lululemon athletica inc. | 0,00 | -100,00 | 0,00 | 0,0000 | |||||
| EPAM / EPAM Systems, Inc. | 0,00 | -100,00 | 0,00 | 0,0000 | |||||
| FCN / FTI Consulting, Inc. | 0,00 | -100,00 | 0,00 | 0,0000 | |||||
| USPH / U.S. Physical Therapy, Inc. | 0,00 | -100,00 | 0,00 | 0,0000 | |||||
| STZ / Constellation Brands, Inc. | 0,00 | -100,00 | 0,00 | 0,0000 |