Grundlæggende statistik
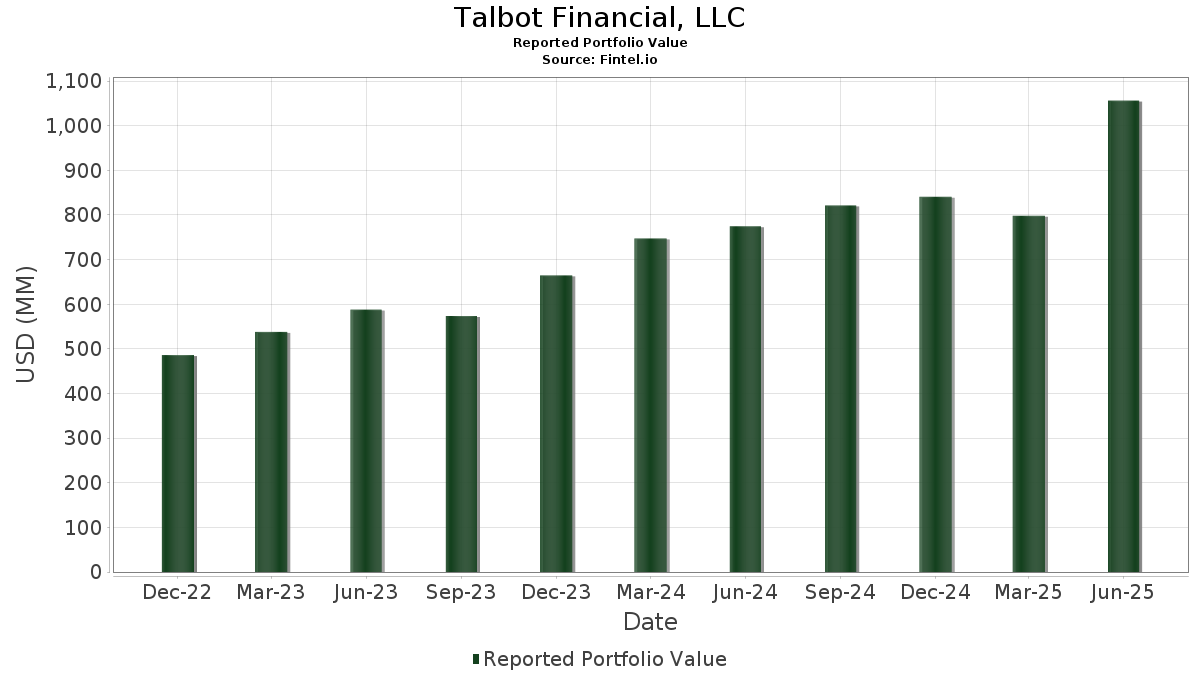
| Porteføljeværdi | $ 1.056.378.632 |
| Nuværende stillinger | 63 |
Seneste beholdninger, ydeevne, AUM (fra 13F, 13D)
Talbot Financial, LLC har afsløret 63 samlede besiddelser i deres seneste SEC-arkivering. Den seneste porteføljeværdi er beregnet til at være $ 1.056.378.632 USD. Faktiske aktiver under forvaltning (AUM) er denne værdi plus kontanter (som ikke er oplyst). Talbot Financial, LLCs største beholdninger er Microsoft Corporation (US:MSFT) , Apple Inc. (US:AAPL) , Amazon.com, Inc. (US:AMZN) , NVIDIA Corporation (US:NVDA) , and Alphabet Inc. (US:GOOGL) . Talbot Financial, LLCs nye stillinger omfatter BlackRock, Inc. (US:BLK) , Meta Platforms, Inc. (US:META) , .
Top øger dette kvartal
Vi bruger ændringen i porteføljeallokeringen, fordi dette er den mest meningsfulde metrik. Ændringer kan skyldes handler eller ændringer i aktiekurser.
| Sikkerhed | Aktier (MM) |
Værdi (MM$) |
Portefølje % | ΔPortefølje % |
|---|---|---|---|---|
| 0,24 | 119,12 | 11,2762 | 1,5340 | |
| 0,01 | 14,97 | 1,4175 | 1,4175 | |
| 0,27 | 42,42 | 4,0156 | 0,8741 | |
| 0,07 | 18,28 | 1,7303 | 0,6595 | |
| 0,05 | 33,52 | 3,1733 | 0,3961 | |
| 0,15 | 26,64 | 2,5157 | 0,3730 | |
| 0,02 | 22,74 | 2,1526 | 0,3529 | |
| 0,02 | 12,62 | 1,1918 | 0,3527 | |
| 0,04 | 28,69 | 2,7091 | 0,2550 | |
| 0,01 | 14,85 | 1,4062 | 0,2320 |
Top falder i dette kvartal
Vi bruger ændringen i porteføljeallokeringen, fordi dette er den mest meningsfulde metrik. Ændringer kan skyldes handler eller ændringer i aktiekurser.
| Sikkerhed | Aktier (MM) |
Værdi (MM$) |
Portefølje % | ΔPortefølje % |
|---|---|---|---|---|
| 0,42 | 85,92 | 8,1336 | -2,0613 | |
| 0,12 | 21,60 | 2,0395 | -0,4338 | |
| 0,15 | 21,06 | 1,9932 | -0,3871 | |
| 0,04 | 12,19 | 1,1515 | -0,2716 | |
| 0,06 | 18,68 | 1,7639 | -0,2632 | |
| 0,05 | 14,75 | 1,3928 | -0,2525 | |
| 0,06 | 22,31 | 2,1123 | -0,2317 | |
| 0,13 | 20,21 | 1,9127 | -0,2070 | |
| 0,02 | 19,51 | 1,8427 | -0,1815 | |
| 0,03 | 21,11 | 1,9988 | -0,1756 |
13F og Fondsarkivering
Denne formular blev indsendt den 2025-07-22 for rapporteringsperioden 2025-06-30. Klik på linkikonet for at se den fulde transaktionshistorik.
Opgrader for at låse op for premium-data og eksportere til Excel ![]() .
.
| Sikkerhed | Type | Gennemsnitlig aktiekurs | Aktier (MM) |
Δ Aktier (%) |
Δ Aktier (%) |
Værdi ($MM) |
Portefølje (%) |
ΔPortefølje (%) |
|
|---|---|---|---|---|---|---|---|---|---|
| MSFT / Microsoft Corporation | 0,24 | 15,60 | 119,12 | 53,17 | 11,2762 | 1,5340 | |||
| AAPL / Apple Inc. | 0,42 | 14,31 | 85,92 | 5,58 | 8,1336 | -2,0613 | |||
| AMZN / Amazon.com, Inc. | 0,27 | 17,85 | 59,67 | 35,89 | 5,6352 | 0,1345 | |||
| NVDA / NVIDIA Corporation | 0,27 | 16,04 | 42,42 | 69,16 | 4,0156 | 0,8741 | |||
| GOOGL / Alphabet Inc. | 0,23 | 19,61 | 40,65 | 35,86 | 3,8484 | 0,0997 | |||
| GS / The Goldman Sachs Group, Inc. | 0,05 | 16,71 | 33,52 | 51,21 | 3,1733 | 0,3961 | |||
| JPM / JPMorgan Chase & Co. | 0,11 | 14,43 | 31,10 | 35,24 | 2,9439 | 0,0634 | |||
| INTU / Intuit Inc. | 0,04 | 14,15 | 28,69 | 46,43 | 2,7091 | 0,2550 | |||
| AMAT / Applied Materials, Inc. | 0,15 | 23,46 | 26,64 | 55,74 | 2,5157 | 0,3730 | |||
| NFLX / Netflix, Inc. | 0,02 | 10,22 | 22,74 | 58,28 | 2,1526 | 0,3529 | |||
| V / Visa Inc. | 0,06 | 17,71 | 22,31 | 19,25 | 2,1123 | -0,2317 | |||
| ABBV / AbbVie Inc. | 0,12 | 23,47 | 21,60 | 9,39 | 2,0395 | -0,4338 | |||
| CRM / Salesforce, Inc. | 0,08 | 28,90 | 21,50 | 30,99 | 2,0348 | -0,0210 | |||
| SYK / Stryker Corporation | 0,05 | 22,37 | 21,26 | 30,06 | 2,0129 | -0,0352 | |||
| LLY / Eli Lilly and Company | 0,03 | 28,89 | 21,11 | 21,65 | 1,9988 | -0,1756 | |||
| CVX / Chevron Corporation | 0,15 | 29,46 | 21,06 | 10,81 | 1,9932 | -0,3871 | |||
| HON / Honeywell International Inc. | 0,09 | 20,76 | 20,38 | 32,81 | 1,9296 | 0,0069 | |||
| JNJ_KZ / Johnson & Johnson | 0,13 | 29,65 | 20,21 | 19,41 | 1,9127 | -0,2070 | |||
| COST / Costco Wholesale Corporation | 0,02 | 15,37 | 19,51 | 20,76 | 1,8427 | -0,1815 | |||
| CB / Chubb Limited | 0,06 | 20,31 | 18,68 | 15,43 | 1,7639 | -0,2632 | |||
| AVGO / Broadcom Inc. | 0,07 | 29,88 | 18,28 | 113,85 | 1,7303 | 0,6595 | |||
| ADBE / Adobe Inc. | 0,05 | 26,03 | 17,86 | 27,13 | 1,6904 | -0,0692 | |||
| HD / The Home Depot, Inc. | 0,05 | 26,13 | 17,64 | 26,18 | 1,6657 | -0,0854 | |||
| SCHW / The Charles Schwab Corporation | 0,18 | 16,33 | 16,84 | 35,60 | 1,5904 | 0,0345 | |||
| NOC / Northrop Grumman Corporation | 0,03 | 22,43 | 15,67 | 19,55 | 1,4800 | -0,1622 | |||
| MDT / Medtronic plc | 0,18 | 32,12 | 15,52 | 28,17 | 1,4689 | -0,0477 | |||
| CSCO / Cisco Systems, Inc. | 0,22 | 20,04 | 15,45 | 34,97 | 1,4627 | 0,0285 | |||
| SNPS / Synopsys, Inc. | 0,03 | 23,51 | 15,21 | 47,67 | 1,4365 | 0,1460 | |||
| BLK / BlackRock, Inc. | 0,01 | 14,97 | 1,4175 | 1,4175 | |||||
| NOW / ServiceNow, Inc. | 0,01 | 22,73 | 14,85 | 58,49 | 1,4062 | 0,2320 | |||
| AMGN / Amgen Inc. | 0,05 | 25,30 | 14,75 | 12,30 | 1,3928 | -0,2525 | |||
| GJR / Strats Trust For Procter & Gambel Security - Preferred Security | 0,09 | 28,53 | 14,10 | 20,16 | 1,3311 | -0,1384 | |||
| EMR / Emerson Electric Co. | 0,10 | 32,76 | 13,48 | 61,44 | 1,2728 | 0,2270 | |||
| GEV / GE Vernova Inc. | 0,02 | 8,70 | 12,62 | 88,41 | 1,1918 | 0,3527 | |||
| AJG / Arthur J. Gallagher & Co. | 0,04 | 15,76 | 12,19 | 7,33 | 1,1515 | -0,2716 | |||
| TRV / The Travelers Companies, Inc. | 0,04 | 17,19 | 11,82 | 18,55 | 1,1165 | -0,1327 | |||
| UBER / Uber Technologies, Inc. | 0,12 | 17,67 | 11,44 | 50,69 | 1,0803 | 0,1292 | |||
| T / AT&T Inc. | 0,39 | 17,86 | 11,25 | 20,61 | 1,0649 | -0,1035 | |||
| MRK / Merck & Co., Inc. | 0,14 | 40,32 | 11,16 | 23,76 | 1,0539 | -0,0758 | |||
| MA / Mastercard Incorporated | 0,02 | 21,14 | 10,67 | 24,20 | 1,0101 | -0,0662 | |||
| PFE / Pfizer Inc. | 0,43 | 29,93 | 10,38 | 24,29 | 0,9823 | -0,0636 | |||
| ROK / Rockwell Automation, Inc. | 0,03 | 16,31 | 9,93 | 49,52 | 0,9404 | 0,1081 | |||
| TMO / Thermo Fisher Scientific Inc. | 0,02 | 40,78 | 9,93 | 14,73 | 0,9403 | -0,1444 | |||
| PEP / PepsiCo, Inc. | 0,07 | 33,18 | 9,87 | 17,29 | 0,9344 | -0,1199 | |||
| MCD / McDonald's Corporation | 0,03 | 26,35 | 9,64 | 18,18 | 0,9126 | -0,1093 | |||
| NVO / Novo Nordisk A/S - Depositary Receipt (Common Stock) | 0,12 | 22,72 | 8,63 | 21,98 | 0,8146 | -0,0713 | |||
| FFIV / F5, Inc. | 0,02 | 0,00 | 4,64 | 10,53 | 0,4393 | -0,0866 | |||
| WAFD / WaFd, Inc | 0,08 | 0,00 | 2,27 | 2,44 | 0,2145 | -0,0632 | |||
| XOM / Exxon Mobil Corporation | 0,01 | 247,37 | 1,42 | 215,30 | 0,1347 | 0,0781 | |||
| SHW / The Sherwin-Williams Company | 0,00 | 0,00 | 1,09 | -1,71 | 0,1030 | -0,0359 | |||
| WK / Workiva Inc. | 0,01 | 0,00 | 0,72 | -9,91 | 0,0679 | -0,0320 | |||
| IBM / International Business Machines Corporation | 0,00 | 0,00 | 0,68 | 18,56 | 0,0640 | -0,0076 | |||
| BRK.B / Berkshire Hathaway Inc. | 0,00 | 0,00 | 0,63 | -8,82 | 0,0597 | -0,0271 | |||
| CDNS / Cadence Design Systems, Inc. | 0,00 | 0,00 | 0,31 | 21,26 | 0,0291 | -0,0028 | |||
| UNP / Union Pacific Corporation | 0,00 | 0,00 | 0,30 | -2,61 | 0,0282 | -0,0102 | |||
| AXP / American Express Company | 0,00 | 0,00 | 0,29 | 18,60 | 0,0272 | -0,0032 | |||
| ORCL / Oracle Corporation | 0,00 | 0,28 | 0,0269 | 0,0269 | |||||
| ADP / Automatic Data Processing, Inc. | 0,00 | 0,00 | 0,28 | 1,09 | 0,0263 | -0,0082 | |||
| PROV / Provident Financial Holdings, Inc. | 0,02 | 0,00 | 0,28 | 6,15 | 0,0261 | -0,0065 | |||
| WMT / Walmart Inc. | 0,00 | 0,00 | 0,27 | 11,67 | 0,0253 | -0,0048 | |||
| MCK / McKesson Corporation | 0,00 | 0,00 | 0,26 | 8,90 | 0,0243 | -0,0053 | |||
| BSX / Boston Scientific Corporation | 0,00 | 0,00 | 0,22 | 6,40 | 0,0205 | -0,0050 | |||
| META / Meta Platforms, Inc. | 0,00 | 0,20 | 0,0194 | 0,0194 | |||||
| C.WSA / Citigroup, Inc. | 0,00 | -100,00 | 0,00 | 0,0000 | |||||
| EXPD / Expeditors International of Washington, Inc. | 0,00 | -100,00 | 0,00 | 0,0000 |