Grundlæggende statistik
| Institutionelle aktier (lange) | 237.938.284 - 67,76% (ex 13D/G) - change of -40,46MM shares -14,53% MRQ |
| Institutionel værdi (lang) | $ 11.117.470 USD ($1000) |
Institutionelt ejerskab og aktionærer
Yum China Holdings, Inc. (US:YUMC) har 763 institutionelle ejere og aktionærer, der har indsendt 13D/G- eller 13F-formularer til Securities Exchange Commission (SEC). Disse institutioner har i alt 237,967,842 aktier. Største aktionærer omfatter Jpmorgan Chase & Co, Principal Financial Group Inc, Vanguard Group Inc, Bls Capital Fondsmaeglerselskab A/s, Primavera Capital Management Ltd, Royal Bank Of Canada, Dodge & Cox, Mondrian Investment Partners LTD, Guardcap Asset Management Ltd, and London & Capital Asset Management Ltd .
Yum China Holdings, Inc. (NYSE:YUMC) institutionel ejerskabsstruktur viser aktuelle positioner i virksomheden efter institutioner og fonde, samt seneste ændringer i positionsstørrelse. Større aktionærer kan omfatte individuelle investorer, investeringsforeninger, hedgefonde eller institutioner. Skema 13D angiver, at investoren besidder (eller besidder) mere end 5 % af virksomheden og har til hensigt (eller har til hensigt at) aktivt at forfølge en ændring i forretningsstrategi. Skema 13G indikerer en passiv investering på over 5%.
The share price as of March 20, 2026 is 51,74 / share. Previously, on March 21, 2025, the share price was 52,26 / share. This represents a decline of 1,00% over that period.

Fondens stemningsscore
Fund Sentiment Score (fka Ownership Accumulation Score) finder de aktier, der bliver mest købt af fonde. Det er resultatet af en sofistikeret, multi-faktor kvantitativ model, der identificerer virksomheder med de højeste niveauer af institutionel akkumulering. Scoringsmodellen bruger en kombination af den samlede stigning i oplyste ejere, ændringerne i porteføljeallokeringer i disse ejere og andre målinger. Tallet går fra 0 til 100, hvor højere tal indikerer et højere niveau af akkumulering for sine jævnaldrende, og 50 er gennemsnittet.
Opdateringsfrekvens: Dagligt
Se Ownership Explorer, som giver en liste over højest rangerende virksomheder.
AI+ Ask Fintel’s AI assistant about Yum China Holdings, Inc..
Select a question to share a public post with an AI-crafted answer.
Thinking of good questions…
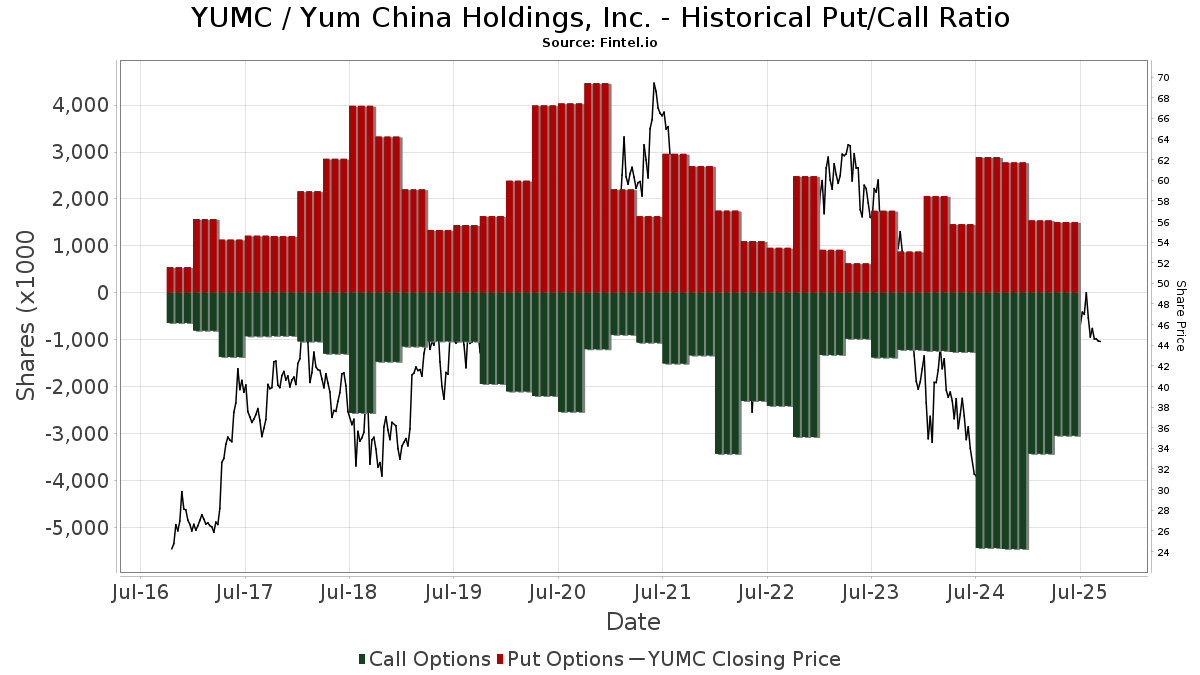
Institutionel Put/Call-forhold
Ud over at indberette standardaktie- og gældsudstedelser skal institutter med mere end 100 mill. aktiver under forvaltning også oplyse deres put- og call-optionsbeholdninger. Da salgsoptioner generelt indikerer negativ stemning, og købsoptioner indikerer positiv stemning, kan vi få en fornemmelse af den overordnede institutionelle stemning ved at plotte forholdet mellem put og kald. Diagrammet til højre viser det historiske put/call-forhold for dette instrument.
Brug af Put/Call Ratio som en indikator for investorernes stemning overvinder en af de vigtigste mangler ved at bruge totalt institutionelt ejerskab, som er, at en betydelig mængde af aktiver under forvaltning investeres passivt for at spore indekser. Passivt forvaltede fonde køber typisk ikke optioner, så indikatoren for put/call-forholdet følger mere nøje følelsen af aktivt forvaltede fonde.
13D/G-arkivering
Vi præsenterer 13D/G ansøgninger separat fra 13F ansøgninger på grund af den forskellige behandling af SEC. 13D/G-ansøgninger kan indgives af grupper af investorer (med én ledende), hvorimod 13F-ansøgninger ikke kan. Dette resulterer i situationer, hvor en investor kan indsende en 13D/G, der rapporterer én værdi for de samlede aktier (der repræsenterer alle de aktier, der ejes af investorgruppen), men derefter indsender en 13F, der rapporterer en anden værdi for de samlede aktier (der udelukkende repræsenterer deres egne) ejendomsret). Det betyder, at aktieejerskab af 13D/G-arkiver og 13F-arkiveringer ofte ikke er direkte sammenlignelige, så vi præsenterer dem separat.
Bemærk: Fra den 16. maj 2021 viser vi ikke længere ejere, der ikke har indsendt en 13D/G inden for det seneste år. Tidligere viste vi den fulde historie af 13D/G-arkiver. Generelt skal enheder, der er forpligtet til at indgive 13D/G-ansøgninger, indgive mindst årligt, før de indsender en afsluttende ansøgning. Dog forlader fonde nogle gange positioner uden at indsende en afsluttende ansøgning (dvs. de afvikler), så visning af den fulde historie resulterede nogle gange i forvirring om det nuværende ejerskab. For at undgå forvirring viser vi nu kun 'aktuelle' ejere - det vil sige - ejere, der har anmeldt inden for det seneste år.
Upgrade to unlock premium data.
| Fil dato | Form | Investor | Forrige Aktier |
Seneste Aktier |
Δ Aktier (Procent) |
Ejendomsret (Procent) |
Δ Ejerskab (Procent) |
|
|---|---|---|---|---|---|---|---|---|
| 2025-11-06 | PRINCIPAL GLOBAL INVESTORS | 20,169,911 | 5.50 | |||||
| 2025-07-22 | JPMORGAN CHASE & CO | 23,460,080 | 28,419,252 | 21.14 | 7.60 | 22.58 |
13F og NPORT arkivering
Detaljer om 13F-arkivering er gratis. Detaljer om NP-ansøgninger kræver et premium-medlemskab. Grønne rækker angiver nye positioner. Røde rækker angiver lukkede positioner. Klik på linket ikon for at se den fulde transaktionshistorik.
Opgrader
for at låse premium-data op og eksportere til Excel ![]() .
.
Important Note
In an effort to reduce load times for our mobile users, we are testing some ways to deliver lighter pages.
In this first test, we will deliver only the most recent 750 transactions (out of 949 for this stock). If you are interested in loading *all* the transactions for this company, click the "load all" button below. This is just a test and if you don't like it, please let us know by submitting some gentle feedback via the link at the bottom of this page.
Load All| Fil dato | Kilde | Investor | Type | Gennemsnitlig pris (Øst) |
Aktier | Δ Aktier (%) |
Rapporteret Værdi ($1000) |
Δ Værdi (%) |
Port Alloc (%) |
|
|---|---|---|---|---|---|---|---|---|---|---|
| 2026-02-05 | 13F | E Fund Management (Hong Kong) Co., Ltd. | 148.350 | -1,56 | 58.124 | 780,38 | ||||
| 2026-02-06 | 13F | Pnc Financial Services Group, Inc. | 103.886 | -1,76 | 4.960 | 9,28 | ||||
| 2026-02-12 | 13F | Hrt Financial Lp | 10.310 | -65,76 | 0 | -100,00 | ||||
| 2026-02-13 | 13F | Pinnacle Wealth Planning Services, Inc. | 1.306 | 62 | ||||||
| 2026-02-02 | 13F | Oppenheimer Asset Management Inc. | 4.294 | -18,69 | 205 | -9,73 | ||||
| 2026-02-17 | 13F | LMR Partners LLP | 11.716 | -93,65 | 559 | -92,94 | ||||
| 2026-02-10 | 13F | Winthrop Capital Management, LLC | 7.926 | 0,00 | 0 | |||||
| 2026-02-19 | 13F | Invesco Ltd. | 1.269.505 | -24,03 | 60.606 | -15,50 | ||||
| 2026-01-27 | 13F | Ninety One UK Ltd | 451.714 | 0,00 | 21.565 | 11,23 | ||||
| 2026-02-13 | 13F | Korea Investment CORP | 258.769 | -22,38 | 12.254 | -16,13 | ||||
| 2026-01-30 | 13F/A | M&t Bank Corp | 46.269 | 0,00 | 2.209 | 11,23 | ||||
| 2025-09-25 | NP | GAOAX - JPMorgan Global Allocation Fund Class A | 17.350 | 0,00 | 806 | -0,62 | ||||
| 2026-02-13 | 13F | Squarepoint Ops LLC | Call | 0 | -100,00 | 0 | -100,00 | |||
| 2026-01-30 | 13F | Caldwell Trust Co | 50 | -96,00 | 2 | -96,23 | ||||
| 2025-11-14 | 13F | Natixis | 0 | -100,00 | 0 | |||||
| 2026-01-29 | 13F | Concord Wealth Partners | 1.000 | 0,00 | 48 | 11,90 | ||||
| 2026-02-05 | 13F | 1620 Investment Advisors, Inc. | 300 | 0,00 | 14 | 16,67 | ||||
| 2026-01-16 | 13F | DiNuzzo Private Wealth, Inc. | 200 | 0,00 | 10 | 12,50 | ||||
| 2026-02-18 | 13F | Caitlin John, LLC | 248 | 0,00 | 12 | 10,00 | ||||
| 2026-02-04 | 13F | Community Bank, N.A. | 176 | 0,00 | 8 | 14,29 | ||||
| 2026-02-13 | 13F | Van Eck Associates Corp | 241.716 | -0,42 | 12 | 10,00 | ||||
| 2026-01-08 | 13F | Nordea Investment Management Ab | 1.131.822 | 9,14 | 54.011 | 21,46 | ||||
| 2025-09-25 | NP | VMMSX - Vanguard Emerging Markets Select Stock Fund Investor Shares | 35.040 | 0,00 | 1.627 | -0,61 | ||||
| 2025-09-29 | NP | Calamos Global Total Return Fund | 3.250 | 0,00 | 151 | -0,66 | ||||
| 2026-02-05 | 13F | High Note Wealth, LLC | 3 | 0,00 | 0 | |||||
| 2026-01-14 | 13F | Southland Equity Partners LLC | 4.248 | 203 | ||||||
| 2026-01-28 | 13F | CAPROCK Group, Inc. | 29.975 | -3,24 | 1.431 | 3,32 | ||||
| 2026-02-10 | 13F | Guardcap Asset Management Ltd | 7.538.993 | -14,30 | 359.912 | -4,67 | ||||
| 2026-01-21 | 13F | Flagship Harbor Advisors, Llc | 14 | 1 | ||||||
| 2026-01-08 | 13F | True Wealth Design, LLC | 161 | 3,21 | 8 | 16,67 | ||||
| 2026-02-10 | 13F | BKD Wealth Advisors, LLC | 6.581 | 0,00 | 314 | 11,35 | ||||
| 2026-01-14 | 13F | Generali Investments CEE, investicni spolecnost, a.s. | 6.577 | 0,00 | 314 | 10,99 | ||||
| 2026-02-17 | 13F | Silvercrest Asset Management Group Llc | 16.652 | 0,12 | 795 | 11,36 | ||||
| 2026-02-13 | 13F | Change Path, LLC | 8.213 | -0,58 | 392 | 10,73 | ||||
| 2026-02-17 | 13F | DZ BANK AG Deutsche Zentral Genossenschafts Bank, Frankfurt am Main | 0 | -100,00 | 0 | |||||
| 2026-02-09 | 13F | Connors Investor Services Inc | 13.000 | 0,00 | 621 | 11,31 | ||||
| 2026-02-13 | 13F | Pathstone Holdings, LLC | 39.208 | -11,67 | 1.872 | -1,78 | ||||
| 2026-02-17 | 13F | Point72 Asset Management, L.P. | 148.386 | 7.084 | ||||||
| 2026-02-10 | 13F | Rothschild Investment Llc | 185 | 0,00 | 9 | 14,29 | ||||
| 2026-01-15 | 13F | Boit C F David | 320 | 0,00 | 32 | 3,23 | ||||
| 2026-01-16 | 13F | Perigon Wealth Management, LLC | 7.199 | -15,95 | 344 | -6,54 | ||||
| 2026-01-27 | 13F | Wealth Enhancement Trust Services, Inc. | 375 | 18 | ||||||
| 2025-09-26 | NP | MSTFX - Morningstar International Equity Fund | 9.998 | -79,08 | 467 | -77,49 | ||||
| 2026-01-07 | 13F | Massmutual Trust Co Fsb/adv | 911 | -13,89 | 43 | -4,44 | ||||
| 2026-01-27 | 13F | Old Second National Bank Of Aurora | 49 | 0,00 | 2 | 0,00 | ||||
| 2026-02-17 | 13F | Guardian Partners Inc. | 6.788 | 360 | ||||||
| 2026-02-11 | 13F | Mitchell Mcleod Pugh & Williams Inc | 11.809 | 684 | ||||||
| 2026-01-21 | 13F | Stone House Investment Management, LLC | 629 | 106,23 | 30 | 130,77 | ||||
| 2026-01-27 | 13F | Duncker Streett & Co Inc | 541 | 26 | ||||||
| 2026-02-10 | 13F | Jupiter Asset Management Ltd | 0 | -100,00 | 0 | |||||
| 2026-02-12 | 13F | Keystone Financial Services | 5.686 | 0,02 | 271 | 11,07 | ||||
| 2026-02-13 | 13F | Morgan Stanley | 2.461.426 | -2,14 | 117.509 | 8,85 | ||||
| 2025-11-13 | 13F | Riggs Asset Managment Co. Inc. | 0 | -100,00 | 0 | |||||
| 2026-01-28 | 13F | Klp Kapitalforvaltning As | 0 | -100,00 | 0 | |||||
| 2026-01-16 | 13F | Compagnie Lombard Odier SCmA | 0 | -100,00 | 0 | |||||
| 2025-09-26 | NP | PCEMX - PACE International Emerging Markets Equity Investments Class P | 15.129 | -39,96 | 706 | -35,29 | ||||
| 2026-02-12 | 13F | Scotia Capital Inc. | 12.698 | 2,19 | 606 | 13,70 | ||||
| 2025-09-26 | NP | SUNAMERICA SERIES TRUST - SA Emerging Markets Equity Index Portfolio Class 1 | 4.270 | 0,00 | 199 | 8,15 | ||||
| 2026-02-13 | 13F | Mariner, LLC | 39.021 | 7,86 | 1.863 | 20,04 | ||||
| 2025-09-25 | NP | PRASX - T. Rowe Price New Asia Fund This fund is a listed as child fund of Price T Rowe Associates Inc /md/ and if that institution has disclosed ownership in this security, then these positions will not be double counted when calculating total shares and total value | 72.349 | -86,61 | 3.377 | -86,53 | ||||
| 2025-09-26 | NP | FZILX - Fidelity ZERO International Index Fund This fund is a listed as child fund of Fmr Llc and if that institution has disclosed ownership in this security, then these positions will not be double counted when calculating total shares and total value | 69.050 | 9,26 | 3.206 | 8,50 | ||||
| 2026-02-02 | 13F | Horizon Investments, LLC | 61 | 0,00 | 3 | 0,00 | ||||
| 2026-02-09 | 13F | Glenview Trust Co | 4.904 | 4,25 | 234 | 16,42 | ||||
| 2026-02-06 | 13F | Global Retirement Partners, LLC | 1.842 | 146,59 | 88 | 171,88 | ||||
| 2025-10-15 | 13F | Marshall & Sullivan Inc /wa/ | 0 | -100,00 | 0 | |||||
| 2026-02-17 | 13F | Blair William & Co/il | 18.782 | -0,23 | 897 | 11,03 | ||||
| 2025-09-26 | NP | EPIN - Harbor International Equity ETF | 1.400 | 65 | ||||||
| 2026-01-27 | 13F | Friedenthal Financial | 0 | -100,00 | 0 | |||||
| 2026-02-17 | 13F | Sciencast Management LP | 0 | -100,00 | 0 | |||||
| 2026-02-17 | 13F | Russell Investments Group, Ltd. | 222.750 | -27,14 | 10.612 | -19,33 | ||||
| 2026-02-17 | 13F | Two Sigma Securities, Llc | 0 | -100,00 | 0 | |||||
| 2026-02-11 | 13F | Curio Wealth, Llc | 0 | -100,00 | 0 | |||||
| 2026-02-13 | 13F | Glen Eagle Advisors, LLC | 836 | -10,68 | 40 | -2,50 | ||||
| 2026-01-15 | 13F | Highline Wealth Partners Llc | 237 | 3,95 | 11 | 22,22 | ||||
| 2026-02-13 | 13F | Macquarie Group Ltd | 61.830 | -58,32 | 2.952 | -54,63 | ||||
| 2025-11-13 | 13F | Jefferies Financial Group Inc. | 0 | -100,00 | 0 | -100,00 | ||||
| 2026-02-12 | 13F | Raiffeisen Bank International AG | 15.900 | -35,37 | 760 | -29,10 | ||||
| 2025-11-14 | 13F | Strategic Wealth Partners, Ltd. | 1 | -99,38 | 0 | -100,00 | ||||
| 2026-02-13 | 13F | Stifel Financial Corp | 48.526 | 1,18 | 2.317 | 12,54 | ||||
| 2025-09-26 | NP | FEMKX - Fidelity Emerging Markets Fund This fund is a listed as child fund of Fmr Llc and if that institution has disclosed ownership in this security, then these positions will not be double counted when calculating total shares and total value | 1.457.900 | 0,00 | 68.055 | 7,78 | ||||
| 2026-01-22 | 13F | Red Tortoise LLC | 682 | 0,00 | 33 | 10,34 | ||||
| 2026-02-17 | 13F | Susquehanna Advisors Group, Inc. | 0 | -100,00 | 0 | |||||
| 2026-02-17 | 13F | Royal Bank Of Canada | 11.135.203 | 1,53 | 531.593 | 12,93 | ||||
| 2025-09-22 | NP | TEOOX - Transamerica Emerging Markets Opportunities R6 | 0 | -100,00 | 0 | -100,00 | ||||
| 2026-02-11 | 13F | Simplex Trading, Llc | Put | 29.800 | -57,91 | 1.423 | 47.300,00 | |||
| 2026-02-10 | 13F | Envestnet Asset Management Inc | 372.571 | 5,22 | 17.787 | 17,04 | ||||
| 2026-02-11 | 13F | Simplex Trading, Llc | 2.282 | 32,83 | 109 | |||||
| 2026-02-11 | 13F | Simplex Trading, Llc | Call | 82.000 | -26,13 | 3.915 | 97.750,00 | |||
| 2026-02-03 | 13F | Washington Trust Advisors, Inc. | 216 | 0,00 | 10 | 11,11 | ||||
| 2026-02-13 | 13F | Cito Capital Group, LLC | 4.000 | 0,00 | 0 | |||||
| 2026-02-17 | 13F | CWM Advisors, LLC | 26.085 | 7,20 | 1.245 | 19,25 | ||||
| 2026-02-05 | 13F | Bank Julius Baer & Co. Ltd, Zurich | 24.874 | -2,09 | 1.187 | 8,90 | ||||
| 2026-02-10 | 13F | CIBC World Markets Inc. | 62.028 | -0,44 | 2.961 | 10,73 | ||||
| 2026-02-13 | 13F | BRITISH COLUMBIA INVESTMENT MANAGEMENT Corp | 626.250 | 74,42 | 29.655 | 88,50 | ||||
| 2026-02-13 | 13F | Silicon Valley Capital Partners | 14 | 0,00 | 1 | |||||
| 2025-11-13 | 13F | Acadian Asset Management Llc | 0 | -100,00 | 0 | |||||
| 2026-02-11 | 13F | Deutsche Bank Ag\ | 1.021.765 | -14,32 | 48.779 | -4,70 | ||||
| 2025-10-07 | 13F | Carolina Wealth Advisors, LLC | 0 | -100,00 | 0 | |||||
| 2026-02-17 | 13F | Trexquant Investment LP | 0 | -100,00 | 0 | |||||
| 2025-09-26 | NP | JHAAX - Multi-Asset Absolute Return Fund Class A | 3.474 | -17,78 | 162 | -10,99 | ||||
| 2026-02-02 | 13F | Fifth Third Bancorp | 21.491 | 2,84 | 1.026 | 14,40 | ||||
| 2026-02-03 | 13F | Ethic Inc. | 0 | -100,00 | 0 | |||||
| 2026-02-17 | 13F | Jump Financial, LLC | 0 | -100,00 | 0 | |||||
| 2026-03-12 | 13F | Nalls Sherbakoff Group, Llc | 122 | 52,50 | 6 | 66,67 | ||||
| 2026-02-12 | 13F | ICICI Prudential Asset Management Co Ltd | 24.868 | 0,00 | 1.187 | 11,25 | ||||
| 2026-02-13 | 13F | Heritage Wealth Advisors | 103 | 0,00 | 5 | 0,00 | ||||
| 2026-02-17 | 13F | Caption Management, LLC | 54.600 | -18,02 | 2.607 | -8,82 | ||||
| 2026-02-17 | 13F | Caisse De Depot Et Placement Du Quebec | 153.673 | 16,55 | 7.276 | 25,93 | ||||
| 2026-01-20 | 13F | Nvwm, Llc | 240 | 0,00 | 11 | 10,00 | ||||
| 2026-02-13 | 13F | OMERS ADMINISTRATION Corp | 10.505 | 15,48 | 497 | 24,87 | ||||
| 2026-02-17 | 13F | GeoWealth Management, LLC | 4.871 | 233 | ||||||
| 2025-09-24 | NP | Managed Account Series - BlackRock GA Disciplined Volatility Equity Fund Class K | 128.362 | 66,89 | 5.992 | 79,86 | ||||
| 2026-02-17 | 13F | Virtus Investment Advisers, Inc. | 43.728 | 12,03 | 2.088 | 24,60 | ||||
| 2026-02-12 | 13F | Swiss National Bank | 810.333 | -3,18 | 38.371 | 4,60 | ||||
| 2026-02-18 | 13F | First Citizens Bank & Trust Co | 11.457 | -3,14 | 547 | 7,69 | ||||
| 2026-01-29 | 13F | Sanctuary Advisors, LLC | 24.641 | 2,61 | 1.176 | 14,17 | ||||
| 2025-11-14 | 13F | Grandeur Peak Global Advisors, LLC | 0 | -100,00 | 0 | |||||
| 2026-02-09 | 13F | Shufro Rose & Co Llc | 11.708 | 2,09 | 559 | -6,53 | ||||
| 2026-01-29 | 13F | Matthews International Capital Management Llc | 312.126 | 0,27 | 14.901 | 11,53 | ||||
| 2026-02-05 | 13F | Stephens Inc /ar/ | 10.787 | 0,00 | 515 | 11,26 | ||||
| 2026-02-04 | 13F | Atlantic Union Bankshares Corp | 1.000 | 0,00 | 48 | 11,90 | ||||
| 2026-01-20 | 13F | Ascent Group, LLC | 12.209 | 40,30 | 583 | 56,03 | ||||
| 2025-09-26 | NP | FSGGX - Fidelity Global ex U.S. Index Fund This fund is a listed as child fund of Fmr Llc and if that institution has disclosed ownership in this security, then these positions will not be double counted when calculating total shares and total value | 163.607 | 5,57 | 7.637 | 13,78 | ||||
| 2026-02-17 | 13F | Private Advisor Group, LLC | 5.551 | -6,17 | 265 | 4,74 | ||||
| 2026-02-06 | 13F | EverSource Wealth Advisors, LLC | 2.349 | 36,73 | 112 | 53,42 | ||||
| 2026-02-13 | 13F | Walleye Trading LLC | 22.006 | 16,43 | 1.051 | 29,47 | ||||
| 2026-01-20 | 13F | Signaturefd, Llc | 2.865 | 35,08 | 137 | 49,45 | ||||
| 2026-02-09 | 13F | Huntington National Bank | 9.875 | -3,25 | 471 | 7,53 | ||||
| 2026-02-13 | 13F | Panagora Asset Management Inc | 8.994 | -1,46 | 429 | 9,72 | ||||
| 2026-02-18 | 13F | Guardian Capital Lp | Put | 44.100 | -2,43 | 115 | 0,88 | |||
| 2026-02-02 | 13F | CX Institutional | 724 | 0,00 | 0 | |||||
| 2026-02-18 | 13F | Guardian Capital Lp | 153.900 | -29,37 | 7.347 | -21,43 | ||||
| 2026-02-13 | 13F | Walleye Trading LLC | Put | 61.300 | 5,15 | 2.926 | 16,95 | |||
| 2026-02-13 | 13F | Walleye Trading LLC | Call | 10.500 | -72,07 | 501 | -68,94 | |||
| 2026-01-07 | 13F | Significant Wealth Partners LLC | 5.228 | -52,87 | 250 | -47,69 | ||||
| 2026-02-13 | 13F | Walleye Capital LLC | Call | 1.100 | 53 | |||||
| 2026-02-13 | 13F | Walleye Capital LLC | Put | 14.500 | 692 | |||||
| 2026-02-11 | 13F | Boston Research & Management Inc | 4.389 | 0 | ||||||
| 2026-02-13 | 13F | Walleye Capital LLC | 8.513 | 406 | ||||||
| 2026-02-12 | 13F | Skandinaviska Enskilda Banken AB (publ) | 23.806 | 22,71 | 1.136 | 36,54 | ||||
| 2025-11-13 | 13F | Glenmede Investment Management, LP | 10.215 | 3,77 | 438 | -0,45 | ||||
| 2026-01-28 | 13F | Cranbrook Wealth Management, LLC | 1.354 | 0,15 | 65 | 10,34 | ||||
| 2026-02-10 | 13F | Daiwa Securities Group Inc. | 1.500 | 0,00 | 0 | |||||
| 2026-01-27 | 13F | Osborne Partners Capital Management, Llc | 17.900 | -0,23 | 855 | 10,91 | ||||
| 2025-09-26 | NP | SUNAMERICA SERIES TRUST - SA JPMorgan Diversified Balanced Portfolio Class 1 | 24.396 | 5,78 | 1.139 | 14,03 | ||||
| 2026-01-28 | 13F | Field & Main Bank | 0 | -100,00 | 0 | |||||
| 2026-02-19 | 13F | Mcguire Capital Advisors Inc | 56 | 3 | ||||||
| 2026-02-11 | 13F | Group One Trading, L.p. | Put | 88.400 | 36,21 | 4.220 | 51,53 | |||
| 2025-11-13 | 13F | Clear Street Markets Llc | 0 | -100,00 | 0 | -100,00 | ||||
| 2026-02-11 | 13F | Group One Trading, L.p. | 14.858 | -5,80 | 709 | 4,88 | ||||
| 2026-02-11 | 13F | Group One Trading, L.p. | Call | 97.000 | -3,87 | 4.631 | 6,93 | |||
| 2026-02-13 | 13F | Pinpoint Asset Management (Singapore) Pte. Ltd. | 5.093 | 243 | ||||||
| 2026-02-13 | 13F | Vontobel Holding Ltd. | 1.419.331 | -1,77 | 67.759 | 9,26 | ||||
| 2026-01-30 | 13F | Oakworth Capital, Inc. | 170 | 1.316,67 | 8 | |||||
| 2026-01-30 | 13F | American Capital Advisory, LLC | 21.668 | -0,06 | 1.034 | 11,18 | ||||
| 2026-02-13 | 13F | Polymer Capital Management (HK) LTD | 86.654 | 140,71 | 4.137 | 167,70 | ||||
| 2025-09-25 | NP | DFA INVESTMENT DIMENSIONS GROUP INC - Emerging Markets Social Core Equity Portfolio Shares | 40.430 | 0,00 | 1.887 | 7,77 | ||||
| 2026-02-18 | 13F | Vident Advisory, LLC | 16.745 | 17,65 | 799 | 30,98 | ||||
| 2026-01-26 | 13F | AE Wealth Management LLC | 5.390 | 257 | ||||||
| 2025-09-25 | NP | TMCVX - Thrivent Mid Cap Value Fund Class S | 6.789 | 124,58 | 317 | 143,08 | ||||
| 2026-01-26 | 13F | Merit Financial Group, LLC | 14.855 | 75,45 | 709 | 95,32 | ||||
| 2026-02-13 | 13F | Williams Jones Wealth Management, LLC. | 8.258 | 2,75 | 394 | 14,53 | ||||
| 2026-02-17 | 13F | Old Mission Capital Llc | 34.194 | 1.594 | ||||||
| 2025-09-23 | NP | IEMGX - Voya Multi-Manager Emerging Markets Equity Fund Class I | 56.790 | 31,44 | 2.637 | 30,62 | ||||
| 2026-02-13 | 13F | Arrowstreet Capital, Limited Partnership | 1.758.839 | 1,68 | 83.804 | 12,33 | ||||
| 2026-01-29 | 13F | Vanguard Group Inc | 15.311.918 | -1,50 | 725.004 | 6,58 | ||||
| 2025-09-26 | NP | REMSX - Emerging Markets Fund Class S | 21.036 | 30,46 | 982 | 40,54 | ||||
| 2026-01-07 | 13F | Hilltop National Bank | 2.142 | 0,00 | 102 | 12,09 | ||||
| 2026-02-10 | 13F | Westpac Banking Corp | 4.159 | -0,76 | 199 | 10,61 | ||||
| 2025-11-17 | 13F | Kestra Investment Management, LLC | 0 | -100,00 | 0 | |||||
| 2026-02-10 | 13F/A | Northwestern Mutual Wealth Management Co | 13.034 | 4,20 | 622 | 16,04 | ||||
| 2026-02-12 | 13F | Barings Llc | 0 | -100,00 | 0 | |||||
| 2026-02-09 | 13F | MTM Investment Management, LLC | 403 | 0,25 | 19 | 11,76 | ||||
| 2026-02-13 | 13F | Umb Bank N A/mo | 2.000 | -14,27 | 95 | -5,00 | ||||
| 2025-09-25 | NP | VEIEX - Vanguard Emerging Markets Stock Index Fund Investor Shares | 4.231.250 | 2,16 | 196.457 | 1,53 | ||||
| 2026-02-13 | 13F | SRS Capital Advisors, Inc. | 1.019 | -18,09 | 49 | -9,43 | ||||
| 2026-02-13 | 13F | Public Sector Pension Investment Board | 0 | -100,00 | 0 | |||||
| 2026-01-26 | 13F | Chicago Capital, LLC | 6.576 | 5,88 | 314 | 17,67 | ||||
| 2026-02-17 | 13F | Summit Trail Advisors, Llc | 42.398 | -6,91 | 2.024 | 3,58 | ||||
| 2026-01-26 | 13F | Whittier Trust Co | 531 | -65,32 | 25 | -60,94 | ||||
| 2026-03-04 | 13F | Rehmann Capital Advisory Group | 9.466 | 1,18 | 452 | 12,47 | ||||
| 2026-02-13 | 13F | Rhumbline Advisers | 198.654 | 0,70 | 9.484 | 12,00 | ||||
| 2026-02-12 | 13F | M&G Plc | 7.826 | -94,02 | 376 | -93,34 | ||||
| 2026-01-30 | 13F | Turning Point Benefit Group, Inc. | 1.824 | 13,86 | 87 | 26,09 | ||||
| 2025-11-12 | 13F | CIBC Bancorp USA Inc. | 76.598 | 3.288 | ||||||
| 2026-01-28 | 13F | Old National Bancorp /in/ | 6.174 | 11,97 | 295 | 24,58 | ||||
| 2025-11-20 | 13F/A | Carrhae Capital LLP | 0 | -100,00 | 0 | |||||
| 2026-02-02 | 13F | Principal Financial Group Inc | 21.957.111 | 8,86 | 1.039.945 | 17,68 | ||||
| 2026-02-10 | 13F | Triglav Skladi, D.o.o. | 19.680 | 31,20 | 940 | 46,03 | ||||
| 2026-02-12 | 13F | Federation des caisses Desjardins du Quebec | 107.215 | -3,45 | 5.118 | 7,41 | ||||
| 2025-10-31 | 13F | CIBC Asset Management Inc | 0 | -100,00 | 0 | |||||
| 2026-02-03 | 13F | Coston, McIsaac & Partners | 345 | 0,00 | 0 | |||||
| 2026-02-11 | 13F | Holowesko Partners Ltd. | 584.100 | 0,78 | 27.885 | 12,09 | ||||
| 2026-02-09 | 13F | Wiser Advisor Group LLC | 73 | -61,58 | 3 | -62,50 | ||||
| 2025-09-26 | NP | FEMSX - Fidelity Series Emerging Markets Opportunities Fund This fund is a listed as child fund of Fmr Llc and if that institution has disclosed ownership in this security, then these positions will not be double counted when calculating total shares and total value | 0 | -100,00 | 0 | -100,00 | ||||
| 2026-01-29 | 13F | Camelot Portfolios, LLC | 25.891 | -3,50 | 1.236 | 7,38 | ||||
| 2026-02-06 | 13F | FourThought Financial Partners, LLC | 6.980 | 0,00 | 333 | 11,37 | ||||
| 2026-02-02 | 13F | Montag A & Associates Inc | 2.343 | -0,13 | 112 | 11,00 | ||||
| 2026-01-23 | 13F | Farther Finance Advisors, LLC | 1.988 | -30,05 | 95 | -22,31 | ||||
| 2026-02-13 | 13F | Commerce Bank | 41.605 | -4,55 | 1.986 | 6,20 | ||||
| 2026-02-11 | 13F | Vise Technologies, Inc. | 8.494 | 27,69 | 406 | 42,11 | ||||
| 2026-01-29 | 13F | First National Bank & Trust Co Of Newtown | 6.744 | -9,65 | 322 | 0,31 | ||||
| 2026-02-13 | 13F | Pacific Center for Financial Services | 140 | 0,00 | 6 | 0,00 | ||||
| 2026-01-22 | 13F | Evermay Wealth Management Llc | 480 | -45,45 | 23 | -40,54 | ||||
| 2026-02-17 | 13F | Millennium Management Llc | Call | 11.700 | -4,88 | 559 | 5,88 | |||
| 2026-02-17 | 13F | Millennium Management Llc | 1.011.402 | -47,90 | 48.233 | -42,34 | ||||
| 2026-02-12 | 13F | Campbell & CO Investment Adviser LLC | 36.416 | -23,79 | 1.738 | -15,27 | ||||
| 2026-02-17 | 13F | Engineers Gate Manager LP | 39.720 | -33,44 | 1.896 | -25,97 | ||||
| 2026-02-13 | 13F | Hudson Bay Capital Management LP | 145.365 | 58,17 | 6.940 | 75,94 | ||||
| 2026-02-13 | 13F | William B. Walkup & Associates, Inc. | 40 | 0,00 | 2 | 0,00 | ||||
| 2026-01-23 | 13F | Halbert Hargrove Global Advisors, Llc | 0 | -100,00 | 0 | |||||
| 2025-11-05 | 13F | Hantz Financial Services, Inc. | 0 | -100,00 | 0 | |||||
| 2026-02-06 | 13F | Kimelman & Baird, LLC | 276 | 0,00 | 13 | 18,18 | ||||
| 2026-01-30 | 13F | Bogart Wealth, LLC | 1.883 | -8,64 | 90 | 1,14 | ||||
| 2026-01-23 | 13F | Private Wealth Management Group, LLC | 0 | -100,00 | 0 | |||||
| 2026-01-30 | 13F | Mitsubishi UFJ Trust & Banking Corp | 35.122 | -59,23 | 1.660 | -55,13 | ||||
| 2026-02-17 | 13F | Amundi | 1.280.291 | -1,80 | 64.461 | 14,48 | ||||
| 2026-01-28 | 13F | Salomon & Ludwin, LLC | 57 | 0,00 | 3 | 0,00 | ||||
| 2026-02-05 | 13F | Bessemer Group Inc | 1.529 | -50,57 | 0 | |||||
| 2025-09-23 | NP | VVIFX - Voya VACS Series EME Fund | 70.680 | 40,64 | 3.282 | 39,80 | ||||
| 2026-01-27 | 13F | Jackson, Grant Investment Advisers, Inc. | 596 | 0,17 | 28 | 12,00 | ||||
| 2026-02-06 | 13F | Creative Financial Designs Inc /adv | 251 | 0,00 | 12 | 20,00 | ||||
| 2026-01-15 | 13F | Founders Capital Management | 350 | 0,00 | 17 | 6,67 | ||||
| 2026-02-11 | 13F | Manchester Capital Management LLC | 96 | 5 | ||||||
| 2025-11-13 | 13F | Guggenheim Capital Llc | 0 | -100,00 | 0 | -100,00 | ||||
| 2026-02-13 | 13F | National Bank Of Canada /fi/ | 11.531 | 4.870,26 | 550 | 6.011,11 | ||||
| 2025-11-04 | 13F/A | Lingohr & Partner Asset Management GmbH | 6.000 | 0 | ||||||
| 2026-02-12 | 13F | DJE Kapital AG | 0 | -100,00 | 0 | |||||
| 2026-02-03 | 13F | Cheviot Value Management, LLC | 798 | 0,00 | 40 | 14,71 | ||||
| 2026-02-17 | 13F | Tower Research Capital LLC (TRC) | 6 | -99,75 | 0 | -100,00 | ||||
| 2026-02-17 | 13F | Advisor Group Holdings, Inc. | 72.018 | -18,72 | 3.439 | -10,72 | ||||
| 2025-10-22 | 13F | Cigna Investments Inc /new | 0 | -100,00 | 0 | |||||
| 2025-11-12 | 13F | Creekmur Asset Management LLC | 177 | 0,00 | 8 | 0,00 | ||||
| 2026-01-15 | 13F | Ironwood Financial, llc | 4.474 | 218 | ||||||
| 2025-09-25 | NP | DFAX - Dimensional World ex U.S. Core Equity 2 ETF | 69.123 | 12,17 | 3.227 | 20,91 | ||||
| 2025-09-29 | NP | SEG Partners Long/Short Equity Fund | Short | -29.558 | -10,85 | -1.380 | -3,90 | |||
| 2025-11-14 | 13F | California State Teachers Retirement System | 0 | -100,00 | 0 | |||||
| 2025-10-22 | 13F | Motco | 0 | -100,00 | 0 | |||||
| 2026-02-05 | 13F | HFM Investment Advisors, LLC | 142 | 5,97 | 7 | 20,00 | ||||
| 2026-02-13 | 13F | Templeton & Phillips Capital Management, LLC | 131.675 | 6.286 | ||||||
| 2026-02-17 | 13F | Two Sigma Advisers, Lp | 36.650 | -71,67 | 1.750 | -68,49 | ||||
| 2025-10-17 | 13F | FSC Wealth Advisors, LLC | 0 | -100,00 | 0 | -100,00 | ||||
| 2026-02-02 | 13F | Truist Financial Corp | 68.009 | 0,31 | 3.247 | 11,58 | ||||
| 2026-02-13 | 13F | Barclays Plc | Call | 635.000 | -4,51 | 30.315 | 6,21 | |||
| 2026-02-06 | 13F | Cullen/frost Bankers, Inc. | 130 | 2,36 | 6 | 20,00 | ||||
| 2026-02-23 | 13F | Wealth Preservation Advisors, LLC | 1.500 | 0,00 | 72 | 10,94 | ||||
| 2026-02-13 | 13F | Barclays Plc | 746.931 | 37,19 | 35.658 | 52,60 | ||||
| 2026-01-13 | 13F | Capital Investment Advisors, LLC | 6.857 | 5,02 | 327 | 16,79 | ||||
| 2025-09-25 | NP | EMRSX - JPMorgan Emerging Markets Research Enhanced Equity Fund Class R6 | 130.100 | -22,81 | 6.041 | -23,29 | ||||
| 2026-02-13 | 13F | Golden State Wealth Management, LLC | 21 | 0,00 | 1 | |||||
| 2025-09-25 | NP | IUAEX - JPMorgan International Unconstrained Equity Fund Class A | 635.010 | -1,84 | 29.642 | 5,80 | ||||
| 2026-02-17 | 13F | Alliancebernstein L.p. | 2.329.117 | -51,48 | 111.192 | -46,04 | ||||
| 2026-01-16 | 13F | Banque Pictet & Cie Sa | 67.350 | -22,32 | 3.202 | -13,65 | ||||
| 2026-02-13 | 13F | Alerus Financial Na | 76 | 0,00 | 4 | 0,00 | ||||
| 2026-02-09 | 13F | Ar Asset Management Inc | 5.600 | 0,00 | 0 | |||||
| 2026-02-17 | 13F | Millennium Management Llc | Put | 0 | -100,00 | 0 | ||||
| 2026-02-09 | 13F | Hartland & Co., LLC | 95 | -2,06 | 5 | 0,00 | ||||
| 2026-02-06 | 13F | Abn Amro Investment Solutions | 0 | -100,00 | 0 | |||||
| 2025-10-21 | 13F | Steel Peak Wealth Management LLC | 0 | -100,00 | 0 | |||||
| 2026-01-27 | 13F | Bayforest Capital Ltd | 4.832 | -71,53 | 231 | -68,41 | ||||
| 2026-01-15 | 13F | Trust Co | 6 | 0 | ||||||
| 2026-02-17 | 13F | Zurich Insurance Group Ltd/FI | 33.400 | 0,00 | 1.595 | 11,24 | ||||
| 2026-02-23 | 13F | Phillip James Consulting Co. | 90 | 0 | ||||||
| 2026-02-13 | 13F | American Century Companies Inc | 854.789 | 0,13 | 40.808 | 11,38 | ||||
| 2026-02-17 | 13F | SIH Partners, LLLP | 68.250 | 205,99 | 3.258 | 240,44 | ||||
| 2026-02-02 | 13F | New England Capital Financial Advisors LLC | 205 | 0,49 | 10 | 12,50 | ||||
| 2025-09-24 | NP | PEAPX - International Emerging Markets Fund R-3 | 230.800 | 0,00 | 10.716 | -0,61 | ||||
| 2026-02-13 | 13F | Brown Advisory Inc | 9.695 | -0,85 | 463 | 10,26 | ||||
| 2026-02-11 | 13F | Prudential Plc | 274.650 | 77,65 | 13.006 | 91,98 | ||||
| 2026-01-14 | 13F | Eastern Bank | 2.820 | 22,77 | 135 | 36,73 | ||||
| 2026-02-09 | 13F | Legal & General Group Plc | 1.965.415 | -14,83 | 93.639 | -5,83 | ||||
| 2026-02-05 | 13F | Mesirow Financial Investment Management, Inc. | 8.293 | -1,56 | 396 | 9,42 | ||||
| 2026-02-12 | 13F | Commonwealth Equity Services, Llc | 54.865 | -4,40 | 2.619 | 130.850,00 | ||||
| 2026-02-09 | 13F | Fisher Asset Management, LLC | 18.741 | -16,70 | 895 | -7,36 | ||||
| 2026-02-11 | 13F | MCF Advisors LLC | 158 | 0,00 | 8 | 16,67 | ||||
| 2025-09-25 | NP | BBEM - JPMorgan BetaBuilders Emerging Markets Equity ETF | 40.145 | -4,45 | 1.874 | 2,97 | ||||
| 2025-10-14 | 13F | S.A. Mason LLC | 0 | -100,00 | 0 | -100,00 | ||||
| 2026-02-13 | 13F | Kempen Capital Management N.v. | 157.296 | -37,58 | 7.509 | -30,57 | ||||
| 2025-09-25 | NP | JDIV - JPMorgan Dividend Leaders ETF | 1.334 | 0,00 | 62 | 8,77 | ||||
| 2026-02-17 | 13F | Fullerton Fund Management Co Ltd | 4.750 | 225 | ||||||
| 2026-02-17 | 13F | Cambria Investment Management, L.P. | 0 | -100,00 | 0 | |||||
| 2026-01-15 | 13F | Harrell Investment Partners, Llc | 5.024 | -0,24 | 240 | 10,65 | ||||
| 2025-11-14 | 13F | Twinbeech Capital Lp | 0 | -100,00 | 0 | -100,00 | ||||
| 2026-02-12 | 13F | Lansforsakringar Fondforvaltning AB (publ) | 148.795 | 6,08 | 7.046 | 14,63 | ||||
| 2025-11-14 | 13F | Skopos Labs, Inc. | 0 | -100,00 | 0 | |||||
| 2026-01-21 | 13F | Signature Resources Capital Management, LLC | 28 | 0,00 | 1 | 0,00 | ||||
| 2026-02-04 | 13F | Altman Advisors, Inc. | 39.945 | 0,84 | 1.907 | 12,12 | ||||
| 2026-02-02 | 13F | Ashton Thomas Securities, Llc | 4.299 | 205 | ||||||
| 2026-02-17 | 13F | MIRAE ASSET GLOBAL ETFS HOLDINGS Ltd. | 142.818 | -22,35 | 6.763 | -16,06 | ||||
| 2026-02-19 | 13F | CI Private Wealth, LLC | 33.761 | 22,93 | 1.608 | 36,50 | ||||
| 2026-02-26 | 13F | TD Capital Management LLC | 235 | 0,43 | 11 | 10,00 | ||||
| 2025-10-30 | 13F | iA Global Asset Management Inc. | 0 | -100,00 | 0 | |||||
| 2026-01-29 | 13F | Nbc Securities, Inc. | 174 | 0,00 | 8 | 14,29 | ||||
| 2026-02-13 | 13F | Wbi Investments, Inc. | 47.465 | -8,38 | 2.266 | 1,89 | ||||
| 2026-02-17 | 13F | Aqr Capital Management Llc | 73.904 | 592,96 | 3.504 | 660,09 | ||||
| 2026-02-12 | 13F | Ci Investments Inc. | 0 | -100,00 | 0 | |||||
| 2026-01-26 | 13F | Main Street Group, LTD | 0 | -100,00 | 0 | |||||
| 2026-01-27 | 13F | WealthCollab, LLC | 64 | 3 | ||||||
| 2026-01-29 | 13F | Pictet Asset Management Holding SA | 477.838 | 8,45 | 22.635 | 19,35 | ||||
| 2026-03-06 | 13F | Hsbc Holdings Plc | 757.035 | -43,95 | 36.140 | -38,18 | ||||
| 2025-11-14 | 13F | Capula Management Ltd | Put | 0 | -100,00 | 0 | ||||
| 2026-01-30 | 13F | North Star Investment Management Corp. | 5.543 | 1,00 | 265 | 12,34 | ||||
| 2025-09-25 | NP | DFEM - Dimensional Emerging Markets Core Equity 2 ETF | 222.800 | 5,17 | 10.371 | 4,69 | ||||
| 2026-01-29 | 13F | DecisionPoint Financial, LLC | 0 | -100,00 | 0 | |||||
| 2025-10-15 | 13F | IFM Investors Pty Ltd | 0 | -100,00 | 0 | |||||
| 2025-11-14 | 13F | Capula Management Ltd | 0 | -100,00 | 0 | |||||
| 2025-09-24 | NP | DAINX - Dunham International Stock Fund Class A | 1.303 | -56,29 | 61 | -53,49 | ||||
| 2025-11-03 | 13F | Valeo Financial Advisors, LLC | 0 | -100,00 | 0 | |||||
| 2026-01-26 | 13F | PFG Investments, LLC | 7.902 | 0,05 | 377 | 11,54 | ||||
| 2026-01-05 | 13F | Park Avenue Securities Llc | 4.313 | 0 | ||||||
| 2026-02-10 | 13F | Fideuram Asset Management (Ireland) dac | 37.632 | 1.723 | ||||||
| 2026-02-06 | 13F | Saranac Partners Ltd | 0 | -100,00 | 0 | |||||
| 2026-02-17 | 13F | EFG International AG | 81 | 4 | ||||||
| 2026-02-17 | 13F | Henry James International Management Inc. | 34.183 | -0,08 | 1.632 | 11,10 | ||||
| 2026-02-18 | 13F | Beacon Pointe Advisors, LLC | 15.438 | 15,02 | 737 | 27,95 | ||||
| 2026-02-17 | 13F | PharVision Advisers, LLC | 0 | -100,00 | 0 | |||||
| 2026-01-26 | 13F | Private Trust Co Na | 458 | -89,16 | 22 | -88,40 | ||||
| 2026-02-11 | 13F | Rise Advisors, LLC | 0 | -100,00 | 0 | |||||
| 2026-02-05 | 13F | AustralianSuper Pty Ltd | 29.239 | 59,54 | 1.396 | 77,48 | ||||
| 2026-01-29 | 13F | Concurrent Investment Advisors, LLC | 6.612 | 33,01 | 316 | 47,89 | ||||
| 2025-11-12 | 13F | William Blair Investment Management, Llc | 0 | -100,00 | 0 | |||||
| 2026-01-14 | 13F | Tradewinds Capital Management, LLC | 266 | 0,00 | 13 | 9,09 | ||||
| 2026-01-26 | 13F | KBC Group NV | 135.735 | 14,30 | 6 | 20,00 | ||||
| 2026-02-13 | 13F | BNP Paribas Asset Management Holding S.A. | 172.145 | 48,10 | 9 | 125,00 | ||||
| 2026-02-17 | 13F | XTX Topco Ltd | 41.012 | -21,09 | 1.958 | -12,24 | ||||
| 2026-02-04 | 13F | Dogwood Wealth Management LLC | 20 | 0,00 | 1 | |||||
| 2026-02-06 | 13F | Addison Advisors LLC | 962 | 3,55 | 46 | 15,38 | ||||
| 2026-02-12 | 13F | Advisors Asset Management, Inc. | 13.526 | 2,97 | 646 | 14,56 | ||||
| 2026-02-12 | 13F | Loomis Sayles & Co L P | 4.317.228 | -2,43 | 206.104 | 8,52 | ||||
| 2026-01-21 | 13F | Banque de Luxembourg S.A. | 1.000 | 0,00 | 504 | 1.072,09 | ||||
| 2026-01-07 | 13F | Sagespring Wealth Partners, Llc | 5.179 | -17,08 | 247 | -7,84 | ||||
| 2026-02-13 | 13F | Primavera Capital Management Ltd | 12.035.635 | 0,00 | 574.581 | 11,23 | ||||
| 2026-02-13 | 13F | Mml Investors Services, Llc | 84.411 | 11,62 | 4.030 | 24,16 | ||||
| 2025-11-07 | 13F | Synovus Financial Corp | 10.316 | -3,09 | 443 | -6,95 | ||||
| 2026-01-15 | 13F | Lodestone Wealth Management LLC | 196 | 9 | ||||||
| 2026-02-13 | 13F | MAI Capital Management | 15.429 | -3,45 | 737 | 7,45 | ||||
| 2026-02-13 | 13F | First Trust Advisors Lp | 5.181 | 8,84 | 247 | 21,08 | ||||
| 2025-09-24 | NP | ACWI - iShares MSCI ACWI ETF | 96.140 | -2,33 | 4.488 | 5,25 | ||||
| 2026-01-23 | 13F | Assetmark, Inc | 540.905 | 31,39 | 25.823 | 46,14 | ||||
| 2026-02-12 | 13F | Brinker Capital Investments, LLC | 28.290 | 29,80 | 1.351 | 44,39 | ||||
| 2026-02-11 | 13F | Prestige Wealth Management Group LLC | 130 | -7,14 | 6 | 0,00 | ||||
| 2026-02-12 | 13F | Principal Securities, Inc. | 46.344 | 50,29 | 2.212 | 67,20 | ||||
| 2026-02-19 | 13F | Atomi Financial Group, Inc. | 13.277 | 26,42 | 634 | 40,67 | ||||
| 2025-11-14 | 13F | Sofos Investments, Inc. | 0 | -100,00 | 0 | |||||
| 2026-01-15 | 13F | Nisa Investment Advisors, Llc | 58.815 | -2,46 | 2.808 | 8,46 | ||||
| 2026-02-10 | 13F | Intech Investment Management Llc | 12.700 | 6,28 | 601 | 14,91 | ||||
| 2026-02-03 | 13F | We Are One Seven, LLC | 7.981 | -1,69 | 381 | 9,48 | ||||
| 2026-02-06 | 13F | HighTower Advisors, LLC | Put | 0 | -100,00 | 0 | ||||
| 2026-02-06 | 13F | Larson Financial Group LLC | 6.616 | 11,61 | 316 | 24,02 | ||||
| 2026-02-13 | 13F | Candriam Luxembourg S.C.A. | 4.759 | -34,81 | 225 | -29,47 | ||||
| 2026-01-20 | 13F | Hanson & Doremus Investment Management | 52.136 | -0,94 | 2 | 0,00 | ||||
| 2026-02-12 | 13F | Jane Street Group, Llc | Put | 49.700 | 121,88 | 2.373 | 146,83 | |||
| 2026-02-05 | 13F | 1st Source Bank | 9.880 | 0,00 | 472 | 11,08 | ||||
| 2026-02-12 | 13F | Jane Street Group, Llc | Call | 52.800 | -45,11 | 2.521 | -38,95 | |||
| 2026-02-12 | 13F | CIBC Private Wealth Group, LLC | 73.358 | -3,75 | 3.502 | 7,06 | ||||
| 2026-02-17 | 13F | Temasek Holdings (Private) Ltd | 4.055.217 | -12,88 | 193.596 | -3,10 | ||||
| 2026-01-26 | 13F | Peoples Financial Services Corp. | 160 | 0,00 | 8 | 16,67 | ||||
| 2026-02-13 | 13F | Okabena Investment Services Inc | 29.996 | -12,70 | 1.432 | -2,85 | ||||
| 2026-02-17 | 13F | Auxier Asset Management | 9.729 | 0,00 | 464 | 11,27 | ||||
| 2026-02-02 | 13F | Oppenheimer & Co Inc | 9.692 | 1,56 | 463 | 12,96 | ||||
| 2025-11-14 | 13F | Evelyn Partners Investment Management Services Ltd | 0 | -100,00 | 0 | -100,00 | ||||
| 2026-01-08 | 13F | Versant Capital Management, Inc | 421 | -0,71 | 20 | 11,11 | ||||
| 2026-02-09 | 13F | Smithfield Trust Co | 2.727 | 0,26 | 0 | |||||
| 2026-02-09 | 13F | Morningstar Investment Management LLC | 150.827 | 9,94 | 7 | 40,00 | ||||
| 2025-11-10 | 13F | Everstar Asset Management, LLC | 0 | -100,00 | 0 | -100,00 | ||||
| 2026-02-05 | 13F | Td Private Client Wealth Llc | 293 | 104,90 | 14 | 116,67 | ||||
| 2025-10-31 | 13F | Resona Asset Management Co.,Ltd. | 0 | -100,00 | 0 | |||||
| 2025-09-24 | NP | IXUS - iShares Core MSCI Total International Stock ETF | 509.484 | 4,71 | 23.783 | 12,86 | ||||
| 2026-01-29 | 13F | Broad Peak Investment Advisers Pte Ltd | 0 | -100,00 | 0 | |||||
| 2026-02-17 | 13F | Citadel Advisors Llc | Call | 61.200 | -45,60 | 2.922 | -39,50 | |||
| 2026-02-17 | 13F | Citadel Advisors Llc | 454.049 | -3,39 | 21.676 | 7,46 | ||||
| 2025-09-25 | NP | Thrivent Core Funds - Thrivent Core Mid Cap Value Fund | 68.513 | 29,72 | 3.198 | 39,83 | ||||
| 2026-02-17 | 13F | Citadel Advisors Llc | Put | 49.700 | -54,69 | 2.373 | -49,62 | |||
| 2026-01-29 | 13F | St Germain D J Co Inc | 2.530 | 0,00 | 121 | 11,11 | ||||
| 2026-02-27 | 13F | Strategic Investment Solutions, Inc. /IL | 297 | 0,34 | 14 | 16,67 | ||||
| 2026-02-12 | 13F | Jane Street Group, Llc | 1.059.887 | 30,53 | 50.599 | 45,19 | ||||
| 2026-01-20 | 13F | Trust Co Of Toledo Na /oh/ | 3.692 | 0,00 | 176 | 11,39 | ||||
| 2026-02-13 | 13F | Squarepoint Ops LLC | 15.668 | -95,13 | 748 | -94,59 | ||||
| 2026-01-15 | 13F | Capital Advisors Inc/ok | 18.628 | 0,00 | 889 | 11,26 | ||||
| 2026-02-11 | 13F | Inceptionr Llc | 23.215 | 1.108 | ||||||
| 2026-02-10 | 13F | Bnp Paribas | 0 | -100,00 | 0 | |||||
| 2026-01-20 | 13F | Independence Bank of Kentucky | 4.189 | 7,16 | 200 | 19,16 | ||||
| 2025-09-25 | NP | Dfa Investment Trust Co - The Emerging Markets Series This fund is a listed as child fund of Dimensional Fund Advisors Lp and if that institution has disclosed ownership in this security, then these positions will not be double counted when calculating total shares and total value | 240.624 | 0,20 | 11.232 | 8,00 | ||||
| 2026-01-27 | 13F | Tranquilli Financial Advisor LLC | 8.815 | 17,30 | 421 | 30,43 | ||||
| 2026-02-03 | 13F | Bokf, Na | 3.914 | 55,44 | 187 | 72,22 | ||||
| 2026-02-13 | 13F | Missouri Trust & Investment Co | 84 | 0,00 | 4 | 33,33 | ||||
| 2025-11-06 | 13F | Midwest Trust Co | 0 | -100,00 | 0 | |||||
| 2026-01-09 | 13F | Assenagon Asset Management S.A. | 10.850 | 80,17 | 514 | 98,84 | ||||
| 2026-02-13 | 13F | Marshall Wace, Llp | 0 | -100,00 | 0 | |||||
| 2026-02-17 | 13F | Woodline Partners LP | 158.995 | 7.590 | ||||||
| 2025-11-03 | 13F | New York State Common Retirement Fund | 0 | -100,00 | 0 | -100,00 | ||||
| 2026-02-09 | 13F | Coldstream Capital Management Inc | 6.628 | -16,03 | 316 | -6,51 | ||||
| 2026-02-06 | 13F | Envestnet Portfolio Solutions, Inc. | 5.071 | 6,98 | 242 | 19,21 | ||||
| 2026-02-04 | 13F | LRI Investments, LLC | 841 | -4,10 | 40 | 8,11 | ||||
| 2026-01-23 | 13F/A | Ervin Investment Management, LLC | 7.080 | -3,41 | 338 | 7,32 | ||||
| 2026-01-23 | 13F | Smallwood Wealth Investment Management, LLC | 118 | 0,00 | 6 | 0,00 | ||||
| 2026-01-08 | 13F | Value Partners Investments Inc. | 236.659 | 4,41 | 11.299 | 16,21 | ||||
| 2026-02-17 | 13F | Northern Trust Corp | 444.882 | -60,00 | 21.239 | -55,51 | ||||
| 2026-01-14 | 13F | Kmg Fiduciary Partners, Llc | 4.680 | 0,00 | 223 | 11,50 | ||||
| 2026-02-12 | 13F | APG Asset Management N.V. | 197.859 | 0,33 | 7.978 | 8,47 | ||||
| 2025-09-26 | NP | RETSX - Tax-Managed U.S. Large Cap Fund Class S | 29.534 | 0,00 | 1.379 | 7,74 | ||||
| 2025-11-12 | 13F | Police & Firemen's Retirement System of New Jersey | 0 | -100,00 | 0 | |||||
| 2025-09-25 | NP | DFAE - Dimensional Emerging Core Equity Market ETF | 216.850 | 6,59 | 10.094 | 6,10 | ||||
| 2026-02-17 | 13F | D. E. Shaw & Co., Inc. | 777.086 | 6,43 | 37.098 | 18,39 | ||||
| 2025-11-14 | 13F | PineBridge Investments, L.P. | 176.450 | -80,32 | 60.169 | -80,90 | ||||
| 2025-09-25 | NP | TWOEX - TCW White Oak Emerging Markets Equity Fund Class I | 1.740 | 0,00 | 81 | -1,23 | ||||
| 2026-02-06 | 13F | GPS Wealth Strategies Group, LLC | 0 | -100,00 | 0 | |||||
| 2026-02-06 | 13F | Leonteq Securities AG | 5.315 | 1,92 | 1.950 | 10,18 | ||||
| 2026-02-12 | 13F | Bank Of Montreal /can/ | 409.911 | 62,85 | 19.569 | 81,14 | ||||
| 2025-09-29 | NP | PXH - Invesco FTSE RAFI Emerging Markets ETF This fund is a listed as child fund of Invesco Ltd. and if that institution has disclosed ownership in this security, then these positions will not be double counted when calculating total shares and total value | 79.313 | 13,99 | 3.702 | 22,87 | ||||
| 2026-02-12 | 13F | McMillan Office, Inc. | 3.965 | 189 | ||||||
| 2025-09-26 | NP | JOET - Virtus Terranova U.S. Quality Momentum ETF | 35.418 | 23,63 | 1.653 | 24,85 | ||||
| 2026-02-11 | 13F | Jpmorgan Chase & Co | 25.396.430 | -6,79 | 1.212.426 | 3,68 | ||||
| 2026-01-30 | 13F | Us Bancorp \de\ | 36.127 | 1,30 | 1.725 | 12,68 | ||||
| 2026-02-10 | 13F | AdvisorShares Investments LLC | 2.789 | -14,47 | 133 | -4,32 | ||||
| 2026-02-12 | 13F | Philadelphia Trust Co | 0 | -100,00 | 0 | |||||
| 2025-10-20 | 13F | Virginia Retirement Systems Et Al | 0 | -100,00 | 0 | |||||
| 2026-02-04 | 13F | Swiss Life Asset Management Ltd | 55.811 | 15,17 | 2.639 | 26,45 | ||||
| 2026-02-13 | 13F | Avanda Investment Management Pte. Ltd. | 0 | -100,00 | 0 | |||||
| 2026-02-19 | 13F/A | Headwater Capital Co Ltd | 100.000 | -16,46 | 4.774 | -7,07 | ||||
| 2026-01-21 | 13F | Capital Advisors, Ltd. LLC | 872 | 0,46 | 0 | |||||
| 2026-02-09 | 13F | Keating Financial Advisory Services, Inc. | 1.844 | 88 | ||||||
| 2026-01-15 | 13F | Nilsine Partners, LLC | 5.662 | -0,16 | 270 | 11,11 | ||||
| 2026-02-12 | 13F | Colonial Trust Advisors | 173 | 0,00 | 8 | 14,29 | ||||
| 2025-09-25 | NP | JGLO - JPMorgan Global Select Equity ETF | 1.293.424 | 32,37 | 60.377 | 42,68 | ||||
| 2025-09-29 | NP | CZA - Invesco Zacks Mid-Cap ETF This fund is a listed as child fund of Invesco Ltd. and if that institution has disclosed ownership in this security, then these positions will not be double counted when calculating total shares and total value | 37.780 | -61,01 | 1.764 | -57,19 | ||||
| 2026-02-10 | 13F | Goldman Sachs Group Inc | 1.952.735 | -4,92 | 93.224 | 5,76 | ||||
| 2026-02-13 | 13F | Giverny Capital Inc. | 0 | -100,00 | 0 | |||||
| 2026-02-03 | 13F | Cassaday & Co Wealth Management LLC | 17.281 | 1,02 | 825 | 12,26 | ||||
| 2026-02-11 | 13F | Illinois Municipal Retirement Fund | 0 | -100,00 | 0 | |||||
| 2026-02-11 | 13F | First Command Advisory Services, Inc. | 60 | 0,00 | 3 | 0,00 | ||||
| 2025-09-26 | NP | FTIHX - Fidelity Total International Index Fund This fund is a listed as child fund of Fmr Llc and if that institution has disclosed ownership in this security, then these positions will not be double counted when calculating total shares and total value | 176.743 | 4,12 | 8.250 | 12,21 | ||||
| 2026-02-09 | 13F | Quest Partners LLC | 13.841 | -77,10 | 661 | -74,56 | ||||
| 2025-11-10 | 13F | Optiver Holding B.V. | 0 | -100,00 | 0 | |||||
| 2025-11-07 | 13F | Sierra Ocean, Llc | 0 | -100,00 | 0 | |||||
| 2026-02-06 | 13F | AMF Pensionsforsakring AB | 38.100 | 0,00 | 1.819 | 11,19 | ||||
| 2026-02-17 | 13F | SageView Advisory Group, LLC | 828 | 40 | ||||||
| 2026-02-17 | 13F | Quantinno Capital Management LP | 99.732 | 19,99 | 4.761 | 33,47 | ||||
| 2026-01-21 | 13F | Albion Financial Group /ut | 447 | 0,00 | 21 | 10,53 | ||||
| 2026-01-26 | 13F | JNBA Financial Advisors | 621 | 0,00 | 30 | 11,54 | ||||
| 2026-02-04 | 13F | Ameritas Advisory Services, LLC | 0 | -100,00 | 0 | |||||
| 2026-02-17 | 13F | Warren Averett Asset Management, LLC | 6.446 | 1,11 | 308 | 12,45 | ||||
| 2026-02-13 | 13F | Quarry LP | 0 | -100,00 | 0 | |||||
| 2026-02-13 | 13F | Ieq Capital, Llc | 9.669 | 77,19 | 462 | 97,01 | ||||
| 2026-02-12 | 13F | Nuveen, LLC | 670.578 | 1,01 | 31.934 | 11,51 | ||||
| 2025-09-23 | NP | PGEIX - Polen Global Emerging Markets Growth Fund Institutional Class | 0 | -100,00 | 0 | -100,00 | ||||
| 2025-11-12 | 13F | Burgundy Asset Management Ltd. | 11.564 | 12,05 | 517 | 12,15 | ||||
| 2026-02-17 | 13F | Susquehanna Fundamental Investments, Llc | 13.730 | -73,72 | 655 | -70,77 | ||||
| 2025-09-25 | NP | TLTE - FlexShares Morningstar Emerging Markets Factor Tilt Index Fund | 4.876 | -12,08 | 228 | -5,42 | ||||
| 2025-09-25 | NP | PQEMX - PGIM QMA Emerging Markets Equity Fund Class R6 | 100 | -95,65 | 5 | -96,23 | ||||
| 2025-09-26 | NP | FDEM - Fidelity Targeted Emerging Markets Factor ETF This fund is a listed as child fund of Fmr Llc and if that institution has disclosed ownership in this security, then these positions will not be double counted when calculating total shares and total value | 10.000 | 12,99 | 465 | 12,59 | ||||
| 2026-01-13 | 13F | Stephens Consulting, LLC | 500 | 0,00 | 24 | 9,52 | ||||
| 2026-01-30 | 13F | Laurel Wealth Advisors LLC | 240 | 11 | ||||||
| 2026-02-11 | 13F | Empowered Funds, LLC | 1.715 | -91,75 | 82 | -90,92 | ||||
| 2026-02-17 | 13F | Signature Equity Partners, LLC | 60 | 3 | ||||||
| 2026-02-12 | 13F | Hm Payson & Co | 343 | 5,54 | 16 | 23,08 | ||||
| 2026-02-12 | 13F | Dimensional Fund Advisors Lp | 2.702.850 | 3,06 | 129.033 | 14,52 | ||||
| 2026-02-12 | 13F | Bank Of Nova Scotia Trust Co | 5.811 | -4,53 | 277 | 6,13 | ||||
| 2026-01-23 | 13F | Parthenon Llc | 5.404 | 0,00 | 258 | 11,26 | ||||
| 2025-11-14 | 13F | Mount Yale Investment Advisors, LLC | 0 | -100,00 | 0 | -100,00 | ||||
| 2026-02-03 | 13F | Gallacher Capital Management LLC | 42.020 | 0,00 | 2.006 | 11,26 | ||||
| 2026-02-12 | 13F | Ensign Peak Advisors, Inc | 13.050 | 0,00 | 618 | 8,23 | ||||
| 2026-02-02 | 13F | Danske Bank A/s | 53.977 | -32,76 | 2.577 | -25,22 | ||||
| 2026-02-13 | 13F | Great West Life Assurance Co /can/ | 194.611 | -45,51 | 9 | -40,00 | ||||
| 2026-01-20 | 13F | Cohen Capital Management, Inc. | 19.950 | 0,00 | 952 | 11,21 | ||||
| 2026-02-05 | 13F | HighMark Wealth Management LLC | 229 | 0,44 | 11 | 11,11 | ||||
| 2026-01-05 | 13F | Horizons Wealth Management | 263 | 0,00 | 13 | 9,09 | ||||
| 2026-02-06 | 13F | Heritage Investors Management Corp | 412.370 | -0,96 | 20 | 11,76 | ||||
| 2026-02-17 | 13F | Lazard Asset Management Llc | 504.675 | -5,63 | 24.082 | 4,79 | ||||
| 2026-02-17 | 13F | Raymond James Financial Inc | 1.120.269 | -10,16 | 53.482 | -0,07 | ||||
| 2026-02-18 | 13F | Garton & Associates Financial Advisors LLC | 913 | 44 | ||||||
| 2026-01-20 | 13F | New Capital Management LP | 8.853 | 0,00 | 423 | 11,35 | ||||
| 2026-02-13 | 13F | Royal London Asset Management Ltd | 369.371 | -0,93 | 17.634 | 10,20 | ||||
| 2025-11-10 | 13F | Marshall & Sterling Wealth Advisors Inc. | 0 | -100,00 | 0 | -100,00 | ||||
| 2026-02-13 | 13F | Inspire Advisors, LLC | 11.444 | 546 | ||||||
| 2025-09-25 | NP | WRAAX - Wilmington Global Alpha Equities Fund Class A Shares | 1.399 | -85,66 | 65 | -88,43 | ||||
| 2025-09-26 | NP | FSGEX - Fidelity Series Global ex U.S. Index Fund This fund is a listed as child fund of Fmr Llc and if that institution has disclosed ownership in this security, then these positions will not be double counted when calculating total shares and total value | 691.050 | -0,68 | 32.258 | 7,05 | ||||
| 2026-02-02 | 13F | Strs Ohio | 2.330 | 14,33 | 111 | 25,00 | ||||
| 2025-11-12 | 13F | Transce3nd, LLC | 0 | -100,00 | 0 | |||||
| 2026-02-03 | 13F | Winch Advisory Services, LLC | 123 | 0,82 | 6 | 0,00 | ||||
| 2026-02-12 | 13F | Hollencrest Capital Management | 412 | 0,00 | 20 | 11,76 | ||||
| 2026-02-03 | 13F | McIlrath & Eck, LLC | 20 | 0,00 | 1 | |||||
| 2026-01-12 | 13F | CVA Family Office, LLC | 225 | 0,00 | 11 | 11,11 | ||||
| 2025-10-24 | 13F | Oliver Luxxe Assets LLC | 0 | -100,00 | 0 | |||||
| 2025-09-25 | NP | PRMSX - T. Rowe Price Emerging Markets Stock Fund This fund is a listed as child fund of Price T Rowe Associates Inc /md/ and if that institution has disclosed ownership in this security, then these positions will not be double counted when calculating total shares and total value | 725.757 | -75,40 | 33.878 | -73,49 | ||||
| 2026-02-11 | 13F | Harvest Fund Management Co., Ltd | 18.858 | 55,11 | 1 | |||||
| 2026-02-05 | 13F | Elyxium Wealth, LLC | 566 | 27 | ||||||
| 2026-02-13 | 13F | Sterling Capital Management LLC | 6.029 | -2,38 | 288 | 8,30 | ||||
| 2026-02-13 | 13F | Prudential Financial Inc | 0 | -100,00 | 0 | |||||
| 2025-11-14 | 13F | Binnacle Investments Inc | 0 | -100,00 | 0 | |||||
| 2026-02-13 | 13F | Financial Network Wealth Advisors LLC | 65 | 12,07 | 3 | 50,00 | ||||
| 2026-02-17 | 13F | Qube Research & Technologies Ltd | Put | 700 | 0,00 | 33 | 10,00 | |||
| 2026-02-17 | 13F | Price T Rowe Associates Inc /md/ | 26.174 | -96,78 | 1 | -97,06 | ||||
| 2026-02-13 | 13F | Schroder Investment Management Group | 35.797 | -18,55 | 1.709 | -9,44 | ||||
| 2026-02-17 | 13F | Aperture Investors, LLC | 0 | -100,00 | 0 | |||||
| 2026-02-05 | 13F | Center for Financial Planning, Inc. | 2.150 | 0,00 | 103 | 10,87 | ||||
| 2026-02-10 | 13F | Moors & Cabot, Inc. | 4.546 | 217 | ||||||
| 2026-02-12 | 13F | Comgest Global Investors S.a.s. | 192.820 | -10,15 | 9.205 | -0,07 | ||||
| 2026-02-10 | 13F | Murphy & Mullick Capital Management Corp | 9 | 0,00 | 0 | |||||
| 2026-02-10 | 13F | Norges Bank | 5.882.425 | 280.656 | ||||||
| 2026-02-11 | 13F | Buckingham Strategic Partners | 4.624 | 221 | ||||||
| 2026-01-23 | 13F | Charter Oak Capital Management, LLC | 8.051 | 0,14 | 384 | 11,30 | ||||
| 2026-02-17 | 13F | Qube Research & Technologies Ltd | 35.414 | -94,31 | 1.691 | -93,67 | ||||
| 2026-02-09 | 13F | Prospera Financial Services Inc | 4.884 | -14,93 | 234 | -5,28 | ||||
| 2025-11-12 | 13F | Nomura Asset Management Co Ltd | 0 | -100,00 | 0 | -100,00 | ||||
| 2026-02-03 | 13F | SBI Securities Co., Ltd. | 251 | -7,38 | 12 | 0,00 | ||||
| 2025-09-24 | NP | AAXJ - iShares MSCI All Country Asia ex Japan ETF | 133.877 | -1,23 | 6.249 | 6,46 | ||||
| 2026-02-13 | 13F | Dodge & Cox | 8.553.962 | 0,39 | 408.366 | 11,66 | ||||
| 2025-11-06 | 13F | Freemont Capital Pte Ltd | 0 | -100,00 | 0 | |||||
| 2026-02-06 | 13F | IFP Advisors, Inc | 4.911 | 187,53 | 234 | 220,55 | ||||
| 2026-02-11 | 13F | Everett Harris & Co /ca/ | 16.142 | 0,00 | 771 | 11,27 | ||||
| 2025-11-14 | 13F | Peak6 Llc | Call | 0 | -100,00 | 0 | -100,00 | |||
| 2026-01-28 | 13F | Confluence Wealth Services, Inc. | 5.769 | 0,16 | 275 | 11,34 | ||||
| 2026-02-10 | 13F | State of Wyoming | 6.951 | -15,66 | 332 | -6,23 | ||||
| 2025-10-24 | 13F | Sumitomo Mitsui DS Asset Management Company, Ltd | 0 | -100,00 | 0 | |||||
| 2026-01-08 | 13F | PMV Capital Advisers, LLC | 229 | 11 | ||||||
| 2026-02-12 | 13F | Steward Partners Investment Advisory, Llc | 7.338 | 1,55 | 350 | 12,90 | ||||
| 2025-09-25 | NP | DFCEX - Emerging Markets Core Equity Portfolio - Institutional Class This fund is a listed as child fund of Dimensional Fund Advisors Lp and if that institution has disclosed ownership in this security, then these positions will not be double counted when calculating total shares and total value | 1.297.945 | 15,81 | 60.588 | 24,82 | ||||
| 2026-02-03 | 13F | Manning & Napier Advisors Llc | 36.992 | -3,35 | 1.769 | 5,93 | ||||
| 2026-01-05 | 13F | Rosenberg Matthew Hamilton | 162 | 0,00 | 8 | 16,67 | ||||
| 2025-11-14 | 13F | ExodusPoint Capital Management, LP | 124.033 | 5.323 | ||||||
| 2025-11-14 | 13F | Peak6 Llc | Put | 0 | -100,00 | 0 | -100,00 | |||
| 2026-02-09 | 13F/A | Swedbank AB | 42.664 | -64,73 | 2.037 | -60,79 | ||||
| 2025-09-24 | NP | SFENX - Schwab Fundamental Emerging Markets Large Company Index Fund Institutional Shares | 71.820 | 0,05 | 3.353 | 7,85 | ||||
| 2026-01-28 | 13F | Geneos Wealth Management Inc. | 6.770 | 439,44 | 323 | 509,43 | ||||
| 2026-01-27 | 13F | TD Waterhouse Canada Inc. | 230 | 170,59 | 11 | 233,33 | ||||
| 2026-01-28 | 13F | Barrett & Company, Inc. | 80 | 0,00 | 4 | 0,00 | ||||
| 2026-02-20 | 13F | Sunbelt Securities, Inc. | 104 | 0,97 | 5 | 0,00 | ||||
| 2025-09-29 | NP | MPGVX - Mondrian Global Equity Value Fund | 69.025 | 54,62 | 3.222 | 66,68 | ||||
| 2026-01-23 | 13F | Sumitomo Mitsui Trust Holdings, Inc. | 628.297 | -3,13 | 29.995 | 7,75 | ||||
| 2025-09-25 | NP | JEMSX - JPMorgan Emerging Markets Equity Fund Class I | 2.193.133 | -0,85 | 102.375 | 6,87 | ||||
| 2026-01-13 | 13F | Kathmere Capital Management, LLC | 8.531 | 16,37 | 407 | 29,62 | ||||
| 2026-02-02 | 13F | CENTRAL TRUST Co | 4.545 | -1,50 | 217 | 9,09 | ||||
| 2026-02-11 | 13F | TCTC Holdings, LLC | 220 | 0,00 | 11 | 11,11 | ||||
| 2026-02-17 | 13F | Bayesian Capital Management, LP | 0 | -100,00 | 0 | |||||
| 2026-02-18 | 13F | Mackenzie Financial Corp | 511.656 | -2,07 | 24.414 | 8,88 | ||||
| 2026-01-12 | 13F | Legacy Wealth Asset Management, LLC | 46.390 | -3,36 | 2.215 | 7,48 | ||||
| 2026-02-02 | 13F | Eq Wealth Advisors, Llc | 66 | 3 | ||||||
| 2026-02-03 | 13F | Sequoia Financial Advisors, LLC | 26.838 | 28,81 | 1.281 | 43,29 | ||||
| 2026-02-17 | 13F | Glenmede Trust Co Na | 9.775 | 10,15 | 467 | 1,08 | ||||
| 2026-01-27 | 13F | Zurcher Kantonalbank (Zurich Cantonalbank) | 262.032 | 0,00 | 12.409 | 10,33 | ||||
| 2025-09-25 | NP | AALGX - Thrivent Global Stock Fund Class A | 6.753 | 17,83 | 315 | 27,02 | ||||
| 2025-09-26 | NP | INVESCO ACTIVELY MANAGED EXCHANGE-TRADED FUND TRUST - Invesco Global Equity Net Zero ETF | 1.775 | 83 | ||||||
| 2025-09-26 | NP | TEQKX - TIAA-CREF Emerging Markets Equity Index Fund Retail Class | 340.145 | -0,96 | 15.878 | 6,74 | ||||
| 2026-01-09 | 13F | Park Place Capital Corp | 278 | 0,00 | 13 | 18,18 | ||||
| 2026-01-22 | 13F | BOCHK Asset Management Ltd | 0 | -100,00 | 0 | |||||
| 2026-02-17 | 13F | Susquehanna International Group, Llp | Put | 157.400 | -51,09 | 7.514 | -45,59 | |||
| 2026-02-17 | 13F | Safe Harbor Fiduciary, LLC | 208 | 0,00 | 10 | 0,00 | ||||
| 2026-01-20 | 13F | American National Bank | 3.000 | 0,00 | 143 | 11,72 | ||||
| 2026-02-17 | 13F | Susquehanna International Group, Llp | Call | 601.800 | -20,93 | 28.730 | -12,05 | |||
| 2026-02-17 | 13F | Advisory Services Network, LLC | 0 | -100,00 | 0 | |||||
| 2025-09-25 | NP | VEU - Vanguard FTSE All-World ex-US Index Fund ETF Shares | 792.543 | 3,12 | 36.798 | 2,48 | ||||
| 2025-11-14 | 13F | Integrated Wealth Concepts LLC | 0 | -100,00 | 0 | |||||
| 2026-01-23 | 13F | Steigerwald, Gordon & Koch Inc. | 139 | 0,00 | 7 | 20,00 | ||||
| 2026-02-17 | 13F | Two Sigma Investments, Lp | 0 | -100,00 | 0 | |||||
| 2025-11-13 | 13F | NINE MASTS CAPITAL Ltd | 0 | -100,00 | 0 | -100,00 | ||||
| 2025-09-25 | NP | HFIGX - Hartford Schroders Diversified Growth Fund Class I | 1.304 | -1,95 | 61 | 5,26 | ||||
| 2026-02-17 | 13F | Susquehanna International Group, Llp | 5.133 | -93,62 | 245 | -92,90 | ||||
| 2025-10-30 | 13F | Ridgewood Investments LLC | 11.318 | 8,38 | 444 | -4,72 | ||||
| 2026-02-17 | 13F | Wiley Bros.-aintree Capital, Llc | 6.735 | 322 | ||||||
| 2026-02-11 | 13F | Hughes Financial Services, LLC | 557 | 0,00 | 27 | 8,33 | ||||
| 2026-02-13 | 13F | Manufacturers Life Insurance Company, The | 0 | -100,00 | 0 | |||||
| 2026-01-12 | 13F | Moody National Bank Trust Division | 8.056 | 0,70 | 385 | 11,95 | ||||
| 2025-09-25 | NP | JIG - JPMorgan International Growth ETF | 30.800 | -3,75 | 1.430 | -4,28 | ||||
| 2026-02-09 | 13F | Fidelis Capital Partners, LLC | 10.458 | 0,00 | 499 | 11,38 | ||||
| 2026-02-17 | 13F | Snowden Capital Advisors LLC | 4.717 | 225 | ||||||
| 2025-11-14 | 13F | WealthTrak Capital Management LLC | 0 | -100,00 | 0 | |||||
| 2025-09-25 | NP | JEMA - JPMorgan Emerging Markets Equity Core ETF | 87.733 | -3,21 | 4.095 | 4,33 | ||||
| 2026-02-04 | 13F | Hallmark Capital Management Inc | 80 | 0,00 | 4 | 0,00 | ||||
| 2025-11-12 | 13F | Cobblestone Capital Advisors Llc /ny/ | 11.713 | 0,00 | 503 | -4,02 | ||||
| 2026-02-02 | 13F | Ativo Capital Management LLC | 103.020 | 0,00 | 4.918 | 11,24 | ||||
| 2026-02-13 | 13F | Resources Investment Advisors, LLC. | 6.772 | -33,16 | 323 | -25,58 | ||||
| 2026-02-17 | 13F | First Manhattan Co | 4.781 | -9,12 | 228 | 1,33 | ||||
| 2026-01-23 | 13F | Robeco Institutional Asset Management B.V. | 93.022 | -51,32 | 4.441 | -45,85 | ||||
| 2026-01-02 | 13F | Global Wealth Strategies & Associates | 365 | 0,00 | 17 | 13,33 | ||||
| 2026-02-17 | 13F | Wellington Management Group Llp | 0 | -100,00 | 0 | |||||
| 2026-02-05 | 13F | LGT Group Foundation | 30.232 | -17,25 | 1.445 | -9,69 | ||||
| 2025-11-14 | 13F | Wolverine Trading, Llc | Call | 78.400 | -6,44 | 3.419 | -8,66 | |||
| 2025-11-14 | 13F | Wolverine Trading, Llc | Put | 15.900 | 8,90 | 693 | 6,29 | |||
| 2026-01-20 | 13F | Tritonpoint Wealth, Llc | 5.276 | 0,00 | 252 | 11,06 | ||||
| 2025-11-19 | 13F/A | Regions Financial Corp | 0 | -100,00 | 0 | |||||
| 2026-02-12 | 13F | BRYN MAWR TRUST Co | 4.490 | 0,00 | 214 | 11,46 | ||||
| 2026-02-18 | 13F/A | Alberta Investment Management Corp | 1.544.100 | -5,85 | 73.715 | 4,72 | ||||
| 2026-02-11 | 13F | Fox Run Management, L.l.c. | 0 | -100,00 | 0 | |||||
| 2026-02-03 | 13F | International Assets Investment Management, Llc | 232 | 11 | ||||||
| 2026-02-17 | 13F | Balyasny Asset Management Llc | 0 | -100,00 | 0 | |||||
| 2025-11-14 | 13F | Wolverine Trading, Llc | 14.214 | 45,19 | 620 | 41,65 | ||||
| 2025-11-14 | 13F | Coatue Management Llc | 0 | -100,00 | 0 | |||||
| 2026-02-11 | 13F | Tiaa Trust, National Association | 5.912 | 4,71 | 282 | 16,53 | ||||
| 2026-02-04 | 13F | Tsfg, Llc | 106 | 0,00 | 0 | |||||
| 2026-02-12 | 13F | Qtron Investments LLC | 0 | -100,00 | 0 | |||||
| 2026-02-12 | 13F/A | Pinebridge Investments Llc | 95.531 | 4.561 | ||||||
| 2026-02-13 | 13F | State Street Corp | 873.411 | -10,29 | 41.697 | -0,21 | ||||
| 2025-11-14 | 13F | Full Sail Capital, LLC | 6.260 | 0,00 | 269 | -3,94 | ||||
| 2026-02-06 | 13F | HighTower Advisors, LLC | 74.483 | -1,19 | 3.556 | 9,89 | ||||
| 2026-02-24 | 13F | Bell Investment Advisors, Inc | 439 | -7,77 | 21 | 0,00 | ||||
| 2026-02-13 | 13F | Palisade Asset Management, LLC | 0 | -100,00 | 0 | |||||
| 2026-02-13 | 13F | Squarepoint Ops LLC | Put | 0 | -100,00 | 0 | -100,00 | |||
| 2026-02-18 | 13F | EP Wealth Advisors, Inc. | 5.899 | 282 | ||||||
| 2025-11-14 | 13F | Aigen Investment Management, Lp | 0 | -100,00 | 0 | |||||
| 2026-01-26 | 13F | Mirae Asset Global Investments Co., Ltd. | 78.475 | -5,11 | 3.746 | 5,55 | ||||
| 2026-02-11 | 13F | BLI - Banque de Luxembourg Investments | 200.300 | 9.494 | ||||||
| 2026-02-11 | 13F | Flagship Wealth Advisors, Llc | 360 | -86,96 | 17 | -85,59 | ||||
| 2026-01-29 | 13F | Rakuten Securities, Inc. | 0 | -100,00 | 0 | |||||
| 2026-02-04 | 13F | Naples Global Advisors, Llc | 62.716 | 15,55 | 2.994 | 28,55 | ||||
| 2025-09-26 | NP | FITFX - Fidelity Flex International Index Fund This fund is a listed as child fund of Fmr Llc and if that institution has disclosed ownership in this security, then these positions will not be double counted when calculating total shares and total value | 35.500 | -10,02 | 1.648 | -3,51 | ||||
| 2026-02-13 | 13F | Cloverfields Capital Group, Lp | 56.247 | 120,80 | 2.685 | 145,65 | ||||
| 2026-01-27 | 13F | Pavion Blue Capital, LLC | 10.053 | 0,01 | 480 | 11,14 | ||||
| 2026-02-05 | 13F | Plante Moran Financial Advisors, LLC | 6.695 | -1,47 | 320 | 9,62 | ||||
| 2026-01-08 | 13F | Grove Bank & Trust | 2.938 | 75,72 | 140 | 97,18 | ||||
| 2026-02-12 | 13F | Wesleyan Assurance Society | 168.530 | 0,00 | 8 | 14,29 | ||||
| 2026-02-17 | 13F | Cape Investment Advisory, Inc. | 2.490 | 37,27 | 119 | 53,25 | ||||
| 2026-02-17 | 13F | Canada Pension Plan Investment Board | 0 | -100,00 | 0 | |||||
| 2026-02-10 | 13F | Meramec Financial Planners, LLC | 43 | 2 | ||||||
| 2025-09-25 | NP | DEHP - Dimensional Emerging Markets High Profitability ETF | 25.814 | 129,34 | 1.205 | 147,23 | ||||
| 2026-02-17 | 13F | Quadrature Capital Ltd | 0 | -100,00 | 0 | |||||
| 2026-02-11 | 13F | Motley Fool Asset Management LLC | 200.307 | -3,68 | 9.563 | 7,14 | ||||
| 2025-11-12 | 13F | Geode Capital Management, Llc | 0 | -100,00 | 0 | |||||
| 2026-01-29 | 13F | Quent Capital, LLC | 642 | 0,00 | 31 | 11,11 | ||||
| 2025-09-25 | NP | TIER - T. Rowe Price International Equity Research ETF | 300 | 14 | ||||||
| 2026-02-17 | 13F | Wealth Watch Advisors, INC | 58 | 3 | ||||||
| 2026-02-13 | 13F | Verition Fund Management LLC | 16.300 | -69,87 | 778 | -66,48 | ||||
| 2026-02-12 | 13F | Rossby Financial, LCC | 1.869 | 7,91 | 89 | 20,27 | ||||
| 2026-01-27 | 13F | Brighton Jones Llc | 0 | -100,00 | 0 | |||||
| 2025-09-24 | NP | ACWX - iShares MSCI ACWI ex U.S. ETF | 82.857 | -5,36 | 3.868 | 2,00 | ||||
| 2026-01-16 | 13F | Ronald Blue Trust, Inc. | 1.107 | -13,31 | 53 | -3,70 | ||||
| 2026-01-13 | 13F | Mather Group, Llc. | 0 | -100,00 | 0 | |||||
| 2026-01-28 | 13F | Universal- Beteiligungs- und Servicegesellschaft mbH | 797.750 | -4,20 | 38.091 | 6,57 | ||||
| 2026-02-13 | 13F | Kestra Advisory Services, LLC | 0 | -100,00 | 0 | |||||
| 2026-01-22 | 13F | Bfsg, Llc | 390 | 0,00 | 19 | 12,50 | ||||
| 2026-01-30 | 13F | SOL Capital Management CO | 6.010 | 0,00 | 0 | |||||
| 2026-02-17 | 13F | Ameriprise Financial Inc | 281.440 | 1,45 | 13.436 | 12,83 | ||||
| 2026-02-13 | 13F | Dymon Asia Capital (singapore) Pte. Ltd. | 0 | -100,00 | 0 | |||||
| 2026-02-17 | 13F | Waverton Investment Management Ltd | 0 | -100,00 | 0 | -100,00 | ||||
| 2026-02-17 | 13F | Public Employees Retirement System Of Ohio | 151.122 | 10,20 | 7.189 | 21,19 | ||||
| 2026-01-07 | 13F | Retirement Wealth Solutions LLC | 49 | 0,00 | 2 | 0,00 | ||||
| 2025-09-25 | NP | JADE - JPMorgan Active Developing Markets Equity ETF | 1.838 | 0,00 | 86 | 7,59 | ||||
| 2026-01-22 | 13F | Massachusetts Financial Services Co /ma/ | 4.971.031 | 5,00 | 237.317 | 16,79 | ||||
| 2026-02-12 | 13F | Quadrant Capital Group Llc | 7.487 | 5.028,08 | 357 | 5.850,00 | ||||
| 2026-02-17 | 13F | Banco Bilbao Vizcaya Argentaria, S.a. | 0 | -100,00 | 0 | |||||
| 2026-02-18 | 13F | GWM Advisors LLC | 8.683 | 33,71 | 415 | 48,92 | ||||
| 2025-09-29 | NP | TIIV - AAM Todd International Intrinsic Value ETF | 6.176 | 288 | ||||||
| 2026-02-06 | 13F | Shakespeare Wealth Management, Inc. | 7.264 | 0,00 | 347 | 11,25 | ||||
| 2026-02-02 | 13F | Van Berkom & Associates Inc. | 21.200 | -10,92 | 1 | 0,00 | ||||
| 2026-01-20 | 13F | Stratos Wealth Partners, LTD. | 6.043 | -5,90 | 289 | 4,73 | ||||
| 2026-02-17 | 13F | Captrust Financial Advisors | 94.309 | 14,06 | 4.502 | 26,89 | ||||
| 2026-02-13 | 13F | Public Employees Retirement Association Of Colorado | 0 | -100,00 | 0 | |||||
| 2026-02-17 | 13F | Laird Norton Trust Company, Llc | 6.992 | 334 | ||||||
| 2026-02-05 | 13F | New York Life Investment Management Llc | 32.309 | -13,80 | 1.542 | -4,10 | ||||
| 2026-02-17 | 13F | Cetera Investment Advisers | 30.614 | 4,32 | 1.462 | 16,04 | ||||
| 2026-01-21 | 13F | Stock Yards Bank & Trust Co | 7.977 | 0,00 | 381 | 11,11 | ||||
| 2026-02-13 | 13F | Caitong International Asset Management Co., Ltd | 0 | -100,00 | 0 | |||||
| 2026-02-11 | 13F | Erste Asset Management GmbH | 156.766 | 7.672 | ||||||
| 2026-02-11 | 13F | Greykasell Wealth Strategies, Inc. | 160 | 0,00 | 8 | 16,67 | ||||
| 2026-02-13 | 13F | USS Investment Management Ltd | 419.079 | 0,00 | 20.003 | 11,25 | ||||
| 2026-01-16 | 13F | Standard Life Aberdeen plc | 19.861 | -40,25 | 948 | -33,29 | ||||
| 2026-01-08 | 13F | Maridea Wealth Management LLC | 12.199 | -6,33 | 582 | -0,34 | ||||
| 2026-01-29 | 13F | UBS Group AG | Call | 65.320 | 192,65 | 3.118 | 225,81 | |||
| 2025-09-26 | NP | FPADX - Fidelity Emerging Markets Index Fund This fund is a listed as child fund of Fmr Llc and if that institution has disclosed ownership in this security, then these positions will not be double counted when calculating total shares and total value | 420.446 | 4,14 | 19.626 | 12,24 | ||||
| 2026-02-17 | 13F | Mercer Global Advisors Inc /adv | 30.272 | -10,75 | 1.445 | -0,69 | ||||
| 2025-09-25 | NP | TWAAX - Thrivent International Allocation Fund Class A | 3.011 | -56,56 | 141 | -44,66 | ||||
| 2026-01-20 | 13F | Thurston, Springer, Miller, Herd & Titak, Inc. | 51 | 2 | ||||||
| 2026-02-10 | 13F | National Pension Service | 96.639 | -1,02 | 4.614 | 10,10 | ||||
| 2026-02-17 | 13F | Credit Agricole S A | 61.364 | -40,32 | 2.930 | -33,63 | ||||
| 2026-01-21 | 13F | Modera Wealth Management, LLC | 4.550 | 217 | ||||||
| 2026-02-13 | 13F | 1832 Asset Management L.P. | 124.494 | 5.943 | ||||||
| 2026-02-13 | 13F | Wealth Alliance | 6.808 | 10,07 | 325 | 22,64 | ||||
| 2026-01-08 | 13F | Wealth Enhancement Advisory Services, Llc | 33.577 | 0,60 | 1.601 | 12,68 | ||||
| 2026-01-30 | 13F | State of New Jersey Common Pension Fund D | 239.214 | -15,57 | 11.420 | -6,09 | ||||
| 2026-02-06 | 13F | BOK Financial Private Wealth, Inc. | 2.012 | 0,00 | 96 | 11,63 | ||||
| 2026-01-21 | 13F | Kentucky Trust Co | 600 | 0,00 | 29 | 12,00 | ||||
| 2026-02-12 | 13F | Voya Investment Management Llc | 45.593 | 5,07 | 2.159 | 13,57 | ||||
| 2025-10-24 | 13F | Hemington Wealth Management | 224 | -2,18 | 0 | |||||
| 2026-02-11 | 13F | SOUTH STATE Corp | 722 | 3,29 | 34 | 13,33 | ||||
| 2026-02-05 | 13F | Thrivent Financial For Lutherans | 113.883 | 15,03 | 5 | 25,00 | ||||
| 2025-09-29 | NP | MPEMX - MONDRIAN EMERGING MARKETS VALUE EQUITY FUND | 7.734 | 42,90 | 361 | 54,27 | ||||
| 2026-02-12 | 13F | Renaissance Technologies Llc | 640.300 | 8,69 | 30.568 | 20,89 | ||||
| 2026-02-17 | 13F | Fmr Llc | 2.213.481 | -1,90 | 105.672 | 9,12 | ||||
| 2026-02-12 | 13F | Brown Brothers Harriman & Co | 1.907 | 23,83 | 91 | 37,88 | ||||
| 2026-02-06 | 13F | Handelsbanken Fonder AB | 0 | -100,00 | 0 | |||||
| 2026-02-23 | 13F | Beaird Harris Wealth Management, LLC | 3 | 0,00 | 0 | |||||
| 2025-09-26 | NP | USAAX - Growth Fund Shares | 70.126 | -23,62 | 3.273 | -17,68 | ||||
| 2026-02-04 | 13F | Biltmore Family Office, LLC | 7.111 | 3,13 | 339 | 14,92 | ||||
| 2026-02-05 | 13F | AlphaCore Capital LLC | 12.872 | 51,95 | 615 | 69,15 | ||||
| 2026-01-15 | 13F | Bernard Wealth Management Corp. | 324 | 0,00 | 15 | 15,38 | ||||
| 2026-02-11 | 13F | Capital Analysts, Inc. | 143 | 0,00 | 0 | |||||
| 2026-02-13 | 13F | Sei Investments Co | 120.893 | 66,41 | 5.771 | 85,09 | ||||
| 2026-01-23 | 13F | Timber Creek Capital Management LLC | 35.100 | -1,55 | 1.676 | 9,48 | ||||
| 2026-01-15 | 13F | Fortitude Family Office, LLC | 25 | 1 | ||||||
| 2025-11-14 | 13F | AXA Investment Managers S.A. | 17.056 | 732 | ||||||
| 2025-09-25 | NP | IEMFX - T. Rowe Price Institutional Emerging Markets Equity Fund This fund is a listed as child fund of Price T Rowe Associates Inc /md/ and if that institution has disclosed ownership in this security, then these positions will not be double counted when calculating total shares and total value | 65.523 | -77,46 | 3.059 | -75,71 | ||||
| 2026-02-13 | 13F | JustInvest LLC | 42.783 | 13,08 | 2.042 | 25,82 | ||||
| 2025-11-14 | 13F | State Of Wisconsin Investment Board | 0 | -100,00 | 0 | |||||
| 2026-02-09 | 13F | Mondrian Investment Partners LTD | 7.854.198 | 111,98 | 187.896 | 17,85 | ||||
| 2025-09-29 | NP | CHIQ - Global X MSCI China Consumer Discretionary ETF This fund is a listed as child fund of Mirae Asset Global Investments Co., Ltd. and if that institution has disclosed ownership in this security, then these positions will not be double counted when calculating total shares and total value | 159.509 | -1,28 | 7.446 | 6,39 | ||||
| 2026-01-29 | 13F | D.a. Davidson & Co. | 21.613 | -2,26 | 1.032 | 8,64 | ||||
| 2025-11-12 | 13F | Mitsubishi UFJ Kokusai Asset Management Co., Ltd. | 0 | -100,00 | 0 | -100,00 | ||||
| 2026-01-26 | 13F | Patriot Financial Group Insurance Agency, LLC | 15.530 | 46,23 | 741 | 62,86 | ||||
| 2026-02-17 | 13F | Coastal Bridge Advisors, LLC | 5.464 | -5,60 | 261 | 4,84 | ||||
| 2025-11-10 | 13F | Magellan Asset Management Ltd | 0 | -100,00 | 0 | |||||
| 2026-02-10 | 13F | KERR FINANCIAL PLANNING Corp | 1 | 0,00 | 0 | |||||
| 2026-01-16 | 13F | Crewe Advisors LLC | 316 | 0,00 | 15 | 15,38 | ||||
| 2026-01-29 | 13F | UBS Group AG | 1.485.816 | -30,18 | 70.933 | -22,34 | ||||
| 2026-01-26 | 13F | Cwm, Llc | 8.511 | -0,70 | 0 | |||||
| 2026-02-17 | 13F | Altrinsic Global Advisors Llc | 753.267 | 35.954 | ||||||
| 2026-01-21 | 13F | Daytona Street Capital LLC | 400 | 19 | ||||||
| 2026-01-16 | 13F | Pictet North America Advisors SA | 507.719 | 1,96 | 24.140 | 13,34 | ||||
| 2026-01-21 | 13F | Hartford Financial Management Inc. | 500 | 0,00 | 24 | 9,52 | ||||
| 2026-02-06 | 13F/A | Rathbone Brothers plc | 35.002 | 0,27 | 1.671 | 11,48 | ||||
| 2026-02-12 | 13F | Mindset Wealth Management, Llc | 18.900 | 0,00 | 902 | 11,22 | ||||
| 2026-02-17 | 13F | FIL Ltd | 4.286.900 | -10,46 | 204.395 | -0,74 | ||||
| 2026-01-07 | 13F | Central Pacific Bank - Trust Division | 164 | 0,00 | 8 | 0,00 | ||||
| 2026-01-12 | 13F | Salem Investment Counselors Inc | 12.001 | 0,00 | 573 | 11,07 | ||||
| 2025-09-29 | NP | Calamos Global Dynamic Income Fund | 10.100 | 0,00 | 469 | -0,64 | ||||
| 2025-09-26 | NP | BKMC - BNY Mellon US Mid Cap Core Equity ETF | 59.379 | 54,11 | 2.772 | 66,13 | ||||
| 2025-09-26 | NP | PGJ - Invesco Golden Dragon China ETF This fund is a listed as child fund of Invesco Ltd. and if that institution has disclosed ownership in this security, then these positions will not be double counted when calculating total shares and total value | 239.708 | -6,58 | 11.190 | 0,68 | ||||
| 2025-11-07 | 13F | Readystate Asset Management Lp | 0 | -100,00 | 0 | |||||
| 2026-01-30 | 13F | Citizens National Bank Trust Department | 1.739 | -4,40 | 83 | 6,41 | ||||
| 2026-01-22 | 13F | Bartlett & Co. Wealth Management Llc | 38.025 | 0,00 | 1.815 | 11,21 | ||||
| 2026-02-10 | 13F | Bridge Generations Wealth Management Llc | 100 | 0,00 | 5 | 0,00 | ||||
| 2026-02-13 | 13F | Nan Shan Life Insurance Co., Ltd. | 85.400 | 0,00 | 4.044 | 8,07 | ||||
| 2026-02-11 | 13F | Nemes Rush Group LLC | 321 | 1,26 | 15 | 15,38 | ||||
| 2026-02-06 | 13F | Gsa Capital Partners Llp | 0 | -100,00 | 0 | |||||
| 2026-01-23 | 13F | Nbt Bank N A /ny | 308 | 1,65 | 21 | 10,53 | ||||
| 2026-02-10 | 13F | Private Wealth Asset Management, LLC | 201 | 0,00 | 10 | 12,50 | ||||
| 2026-02-17 | 13F | Dark Forest Capital Management Lp | 0 | -100,00 | 0 | |||||
| 2026-01-27 | 13F | Gf Fund Management Co. Ltd. | 370 | 18 | ||||||
| 2026-02-23 | 13F | Virtu Financial LLC | 0 | -100,00 | 0 | |||||
| 2026-02-13 | 13F/A | Abound Financial, Llc | 1.000 | 48 | ||||||
| 2026-01-30 | 13F | RV Capital GmbH | 444.321 | 0,00 | 21.212 | 11,23 | ||||
| 2026-02-10 | 13F | Mawer Investment Management Ltd. | 0 | -100,00 | 0 | |||||
| 2026-02-13 | 13F | Wells Fargo & Company/mn | 181.146 | 12,65 | 8.648 | 25,30 | ||||
| 2026-01-08 | 13F | Armstrong Advisory Group, Inc | 96 | 0,00 | 5 | 0,00 | ||||
| 2025-09-25 | NP | VGTSX - Vanguard Total International Stock Index Fund Investor Shares | 3.990.546 | -0,21 | 185.281 | -0,83 | ||||
| 2026-01-22 | 13F | Financial Consulate, Inc | 36 | 50,00 | 2 | 0,00 | ||||
| 2026-01-29 | 13F | Teachers Retirement System Of The State Of Kentucky | 528.300 | 0,00 | 25 | 13,64 | ||||
| 2025-10-21 | 13F | Jarislowsky, Fraser Ltd | 126.474 | 0,13 | 5.428 | -3,88 | ||||
| 2026-02-13 | 13F | Wells Fargo & Company/mn | Put | 3.500 | 0,00 | 167 | 11,33 | |||
| 2026-02-17 | 13F | Cresset Asset Management, LLC | 5.945 | -0,25 | 284 | 10,98 | ||||
| 2026-01-15 | 13F | J. Safra Sarasin Holding AG | 8.281 | 73,21 | 395 | 92,68 | ||||
| 2026-01-28 | 13F | B. Metzler seel. Sohn & Co. AG | 61.739 | -56,08 | 2.947 | -51,15 | ||||
| 2026-02-13 | 13F | Centiva Capital, LP | 0 | -100,00 | 0 | |||||
| 2026-02-06 | 13F | Bare Financial Services, Inc | 91 | 5,81 | 4 | 33,33 | ||||
| 2026-02-04 | 13F | Abc Arbitrage Sa | 0 | -100,00 | 0 | |||||
| 2026-02-13 | 13F | Johnson Investment Counsel Inc | 0 | -100,00 | 0 | |||||
| 2025-09-25 | NP | RPGAX - T. Rowe Price Global Allocation Fund, Inc. This fund is a listed as child fund of Price T Rowe Associates Inc /md/ and if that institution has disclosed ownership in this security, then these positions will not be double counted when calculating total shares and total value | 5.429 | -75,67 | 253 | -73,81 | ||||
| 2026-02-11 | 13F | Winnow Wealth Llc | 15 | 1 | ||||||
| 2026-02-09 | 13F | Choate Investment Advisors | 9.224 | -1,13 | 440 | 10,00 | ||||
| 2026-02-11 | 13F | Motley Fool Wealth Management, LLC | 96.198 | -16,31 | 4.592 | -6,91 | ||||
| 2026-02-09 | 13F | Delta Asset Management Llc/tn | 575 | 0,00 | 27 | 12,50 |