Grundlæggende statistik
| Manager | Hamish Douglass |
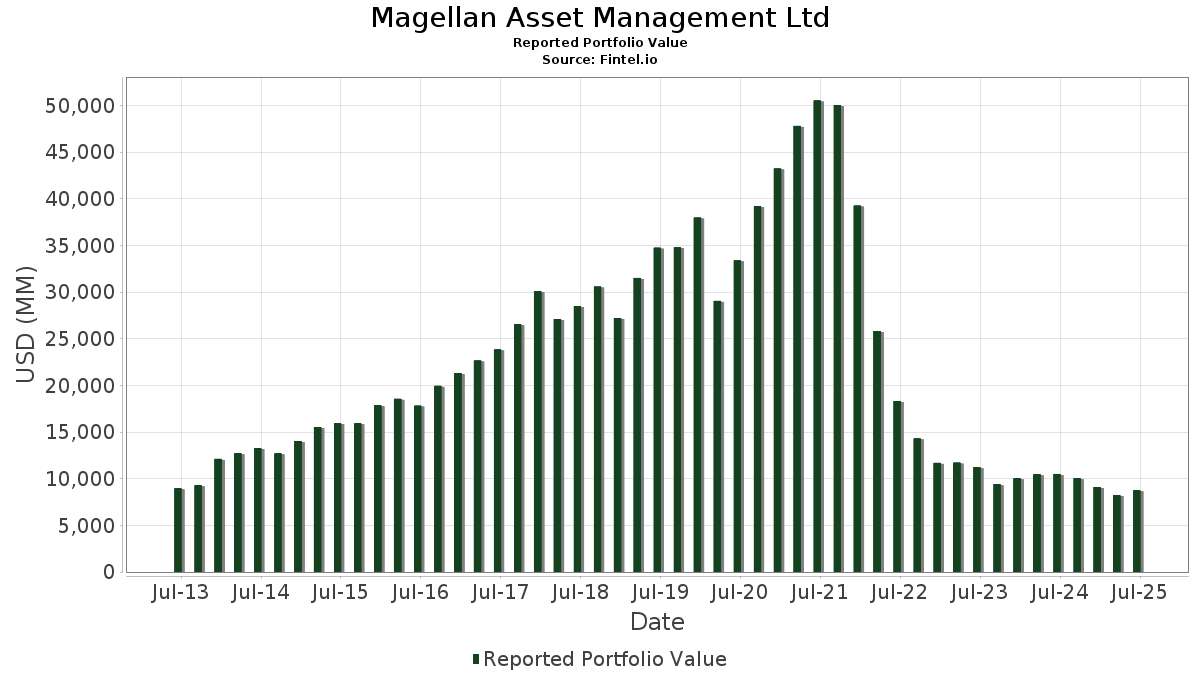
| Porteføljeværdi | $ 8.748.475.403 |
| Nuværende stillinger | 84 |
Seneste beholdninger, ydeevne, AUM (fra 13F, 13D)
Magellan Asset Management Ltd har afsløret 84 samlede besiddelser i deres seneste SEC-arkivering. Porteføljeadministrator(er) er angivet som Hamish Douglass. Den seneste porteføljeværdi er beregnet til at være $ 8.748.475.403 USD. Faktiske aktiver under forvaltning (AUM) er denne værdi plus kontanter (som ikke er oplyst). Magellan Asset Management Ltds største beholdninger er Microsoft Corporation (US:MSFT) , Amazon.com, Inc. (US:AMZN) , Meta Platforms, Inc. (US:META) , Eversource Energy (US:ES) , and Taiwan Semiconductor Manufacturing Company Limited - Depositary Receipt (Common Stock) (US:TSM) .
Top øger dette kvartal
Vi bruger ændringen i porteføljeallokeringen, fordi dette er den mest meningsfulde metrik. Ændringer kan skyldes handler eller ændringer i aktiekurser.
| Sikkerhed | Aktier (MM) |
Værdi (MM$) |
Portefølje % | ΔPortefølje % |
|---|---|---|---|---|
| 0,31 | 175,91 | 2,0108 | 2,0108 | |
| 2,36 | 162,98 | 1,8630 | 1,7325 | |
| 0,49 | 133,97 | 1,5314 | 1,5302 | |
| 1,93 | 436,15 | 4,9855 | 1,3478 | |
| 0,63 | 468,06 | 5,3502 | 1,2039 | |
| 3,15 | 691,93 | 7,9091 | 0,9033 | |
| 1,71 | 272,50 | 3,1148 | 0,7501 | |
| 1,94 | 137,52 | 1,5719 | 0,6866 | |
| 2,31 | 341,84 | 3,9074 | 0,6594 | |
| 0,96 | 43,27 | 0,4946 | 0,4828 |
Top falder i dette kvartal
Vi bruger ændringen i porteføljeallokeringen, fordi dette er den mest meningsfulde metrik. Ændringer kan skyldes handler eller ændringer i aktiekurser.
| Sikkerhed | Aktier (MM) |
Værdi (MM$) |
Portefølje % | ΔPortefølje % |
|---|---|---|---|---|
| 1,68 | 115,83 | 1,3240 | -0,8763 | |
| 0,82 | 256,71 | 2,9343 | -0,6183 | |
| 0,62 | 110,61 | 1,2643 | -0,5561 | |
| 1,12 | 196,94 | 2,2511 | -0,5122 | |
| 0,66 | 369,06 | 4,2186 | -0,4454 | |
| 0,41 | 155,39 | 1,7761 | -0,4036 | |
| 1,32 | 137,25 | 1,5688 | -0,3725 | |
| 1,33 | 136,76 | 1,5632 | -0,3396 | |
| 0,84 | 185,06 | 2,1153 | -0,2537 | |
| 2,26 | 171,09 | 1,9556 | -0,2527 |
13F og Fondsarkivering
Denne formular blev indsendt den 2025-08-07 for rapporteringsperioden 2025-06-30. Klik på linkikonet for at se den fulde transaktionshistorik.
Opgrader for at låse op for premium-data og eksportere til Excel ![]() .
.
| Sikkerhed | Type | Gennemsnitlig aktiekurs | Aktier (MM) |
Δ Aktier (%) |
Δ Aktier (%) |
Værdi ($MM) |
Portefølje (%) |
ΔPortefølje (%) |
|
|---|---|---|---|---|---|---|---|---|---|
| MSFT / Microsoft Corporation | 1,41 | -15,11 | 703,03 | 12,49 | 8,0360 | 0,4374 | |||
| AMZN / Amazon.com, Inc. | 3,15 | 4,14 | 691,93 | 20,08 | 7,9091 | 0,9033 | |||
| META / Meta Platforms, Inc. | 0,63 | 7,17 | 468,06 | 37,25 | 5,3502 | 1,2039 | |||
| ES / Eversource Energy | 6,95 | 1,10 | 442,29 | 3,56 | 5,0557 | -0,1369 | |||
| TSM / Taiwan Semiconductor Manufacturing Company Limited - Depositary Receipt (Common Stock) | 1,93 | 6,84 | 436,15 | 45,77 | 4,9855 | 1,3478 | |||
| MA / Mastercard Incorporated | 0,66 | -6,16 | 369,06 | -3,79 | 4,2186 | -0,4454 | |||
| YUM / Yum! Brands, Inc. | 2,31 | 35,89 | 341,84 | 27,96 | 3,9074 | 0,6594 | |||
| V / Visa Inc. | 0,88 | -1,80 | 311,26 | -0,51 | 3,5579 | -0,2459 | |||
| NFLX / Netflix, Inc. | 0,22 | -27,33 | 292,00 | 4,35 | 3,3378 | -0,0644 | |||
| CMG / Chipotle Mexican Grill, Inc. | 4,90 | 3,44 | 275,19 | 15,67 | 3,1455 | 0,2532 | |||
| PG / The Procter & Gamble Company | 1,71 | 49,86 | 272,50 | 40,10 | 3,1148 | 0,7501 | |||
| ICE / Intercontinental Exchange, Inc. | 1,45 | -3,64 | 266,49 | 2,49 | 3,0462 | -0,1151 | |||
| UNH / UnitedHealth Group Incorporated | 0,82 | 47,49 | 256,71 | -12,15 | 2,9343 | -0,6183 | |||
| SYK / Stryker Corporation | 0,53 | -1,06 | 209,98 | 5,16 | 2,4002 | -0,0276 | |||
| INTU / Intuit Inc. | 0,26 | -21,24 | 207,15 | 1,03 | 2,3678 | -0,1250 | |||
| D / Dominion Energy, Inc. | 3,64 | -0,86 | 205,56 | -0,06 | 2,3497 | -0,1510 | |||
| GOOGL / Alphabet Inc. | 1,12 | -23,97 | 196,94 | -13,35 | 2,2511 | -0,5122 | |||
| AMT / American Tower Corporation | 0,84 | -6,50 | 185,06 | -5,03 | 2,1153 | -0,2537 | |||
| MSCI / MSCI Inc. | 0,31 | 175,91 | 2,0108 | 2,0108 | |||||
| SRE / Sempra | 2,26 | -11,29 | 171,09 | -5,81 | 1,9556 | -0,2527 | |||
| EVRG / Evergy, Inc. | 2,36 | 1.418,68 | 162,98 | 1.418,25 | 1,8630 | 1,7325 | |||
| HCA / HCA Healthcare, Inc. | 0,41 | -21,83 | 155,39 | -13,33 | 1,7761 | -0,4036 | |||
| KO / The Coca-Cola Company | 1,94 | 91,18 | 137,52 | 88,86 | 1,5719 | 0,6866 | |||
| WEC / WEC Energy Group, Inc. | 1,32 | -10,10 | 137,25 | -14,05 | 1,5688 | -0,3725 | |||
| CCI / Crown Castle Inc. | 1,33 | -11,34 | 136,76 | -12,62 | 1,5632 | -0,3396 | |||
| XEL / Xcel Energy Inc. | 2,00 | -3,39 | 136,41 | -7,06 | 1,5592 | -0,2252 | |||
| CME / CME Group Inc. | 0,49 | 131.625,47 | 133,97 | 138.012,37 | 1,5314 | 1,5302 | |||
| NVO / Novo Nordisk A/S - Depositary Receipt (Common Stock) | 1,68 | -35,61 | 115,83 | -36,00 | 1,3240 | -0,8763 | |||
| GOOG / Alphabet Inc. | 0,62 | -34,94 | 110,61 | -26,13 | 1,2643 | -0,5561 | |||
| CSX / CSX Corporation | 3,18 | -8,96 | 103,69 | 0,94 | 1,1853 | -0,0636 | |||
| NSC / Norfolk Southern Corporation | 0,40 | -13,10 | 101,94 | -6,09 | 1,1653 | -0,1545 | |||
| BKNG / Booking Holdings Inc. | 0,01 | -29,06 | 49,19 | -10,85 | 0,5623 | -0,1086 | |||
| ZBH / Zimmer Biomet Holdings, Inc. | 0,51 | 16,76 | 46,14 | -5,91 | 0,5274 | -0,0688 | |||
| USB / U.S. Bancorp | 0,96 | 4.029,27 | 43,27 | 4.329,27 | 0,4946 | 0,4828 | |||
| DG / Dollar General Corporation | 0,37 | -37,33 | 42,16 | -18,48 | 0,4819 | -0,1469 | |||
| BRK.A / Berkshire Hathaway Inc. | 0,08 | 11,82 | 39,72 | 2,00 | 0,4541 | -0,0195 | |||
| AEP / American Electric Power Company, Inc. | 0,32 | 9,69 | 33,12 | 4,16 | 0,3786 | -0,0080 | |||
| EXC / Exelon Corporation | 0,76 | 4,39 | 32,96 | -1,63 | 0,3768 | -0,0306 | |||
| DUK / Duke Energy Corporation | 0,28 | 10,49 | 32,82 | 6,89 | 0,3751 | 0,0018 | |||
| SO / The Southern Company | 0,35 | 9,21 | 32,55 | 9,07 | 0,3720 | 0,0092 | |||
| NEE / NextEra Energy, Inc. | 0,47 | 17,67 | 32,40 | 15,23 | 0,3703 | 0,0285 | |||
| PEG / Public Service Enterprise Group Incorporated | 0,35 | 9,76 | 29,82 | 12,26 | 0,3408 | 0,0179 | |||
| ULTA / Ulta Beauty, Inc. | 0,06 | -19,56 | 29,80 | 2,67 | 0,3407 | -0,0123 | |||
| ED / Consolidated Edison, Inc. | 0,28 | 9,79 | 27,62 | -0,37 | 0,3157 | -0,0213 | |||
| MELI / MercadoLibre, Inc. | 0,01 | -11,07 | 25,52 | 19,14 | 0,2917 | 0,0313 | |||
| ETR / Entergy Corporation | 0,30 | 3,70 | 25,05 | 0,83 | 0,2863 | -0,0157 | |||
| MS / Morgan Stanley | 0,16 | 3,22 | 23,22 | 24,63 | 0,2655 | 0,0389 | |||
| CRM / Salesforce, Inc. | 0,08 | 9,23 | 21,46 | 10,99 | 0,2453 | 0,0102 | |||
| AWK / American Water Works Company, Inc. | 0,15 | -5,65 | 20,73 | -11,03 | 0,2370 | -0,0463 | |||
| AEE / Ameren Corporation | 0,21 | 8,58 | 20,16 | 3,86 | 0,2304 | -0,0055 | |||
| SBAC / SBA Communications Corporation | 0,08 | -0,52 | 19,12 | 6,19 | 0,2186 | -0,0004 | |||
| DTE / DTE Energy Company | 0,14 | 0,05 | 18,78 | -4,15 | 0,2147 | -0,0236 | |||
| YUMC / Yum China Holdings, Inc. | 0,41 | 18,48 | 0,2113 | 0,2113 | |||||
| ATO / Atmos Energy Corporation | 0,12 | -0,54 | 17,92 | -0,84 | 0,2048 | -0,0149 | |||
| FE / FirstEnergy Corp. | 0,41 | -1,03 | 16,66 | -1,42 | 0,1904 | -0,0150 | |||
| PPL / PPL Corporation | 0,48 | -0,69 | 16,21 | -6,79 | 0,1853 | -0,0262 | |||
| CNP / CenterPoint Energy, Inc. | 0,44 | -0,28 | 16,20 | 1,12 | 0,1852 | -0,0096 | |||
| CMS / CMS Energy Corporation | 0,20 | -0,42 | 13,89 | -8,15 | 0,1588 | -0,0251 | |||
| NI / NiSource Inc. | 0,34 | -0,94 | 13,85 | -0,32 | 0,1584 | -0,0106 | |||
| LNT / Alliant Energy Corporation | 0,17 | -0,75 | 10,41 | -6,73 | 0,1190 | -0,0167 | |||
| WTRG / Essential Utilities, Inc. | 0,20 | -0,53 | 7,40 | -6,54 | 0,0846 | -0,0117 | |||
| PNW / Pinnacle West Capital Corporation | 0,08 | -1,66 | 7,33 | -7,62 | 0,0837 | -0,0127 | |||
| OGE / OGE Energy Corp. | 0,13 | -1,48 | 5,90 | -4,87 | 0,0674 | -0,0080 | |||
| TMO / Thermo Fisher Scientific Inc. | 0,01 | 115,72 | 5,05 | 75,79 | 0,0577 | 0,0228 | |||
| IDA / IDACORP, Inc. | 0,04 | -3,47 | 4,06 | -4,11 | 0,0464 | -0,0051 | |||
| MDLZ / Mondelez International, Inc. | 0,06 | 1,10 | 3,86 | 0,47 | 0,0441 | -0,0026 | |||
| SPGI / S&P Global Inc. | 0,01 | 0,00 | 3,23 | 3,75 | 0,0370 | -0,0009 | |||
| TXNM / TXNM Energy, Inc. | 0,06 | -0,14 | 3,23 | 5,18 | 0,0369 | -0,0004 | |||
| POR / Portland General Electric Company | 0,07 | -0,97 | 3,01 | -9,77 | 0,0344 | -0,0062 | |||
| SR / Spire Inc. | 0,04 | -3,01 | 2,97 | -9,54 | 0,0339 | -0,0060 | |||
| OGS / ONE Gas, Inc. | 0,04 | -2,80 | 2,92 | -7,58 | 0,0333 | -0,0050 | |||
| ALE / ALLETE, Inc. | 0,04 | -2,48 | 2,66 | -4,91 | 0,0304 | -0,0036 | |||
| BKH / Black Hills Corporation | 0,05 | -0,53 | 2,56 | -7,96 | 0,0292 | -0,0046 | |||
| NWE / NorthWestern Energy Group, Inc. | 0,05 | -2,59 | 2,45 | -13,65 | 0,0281 | -0,0065 | |||
| AWR / American States Water Company | 0,03 | -2,09 | 2,04 | -4,63 | 0,0233 | -0,0027 | |||
| CWT / California Water Service Group | 0,04 | -4,51 | 1,98 | -10,37 | 0,0226 | -0,0042 | |||
| AVA / Avista Corporation | 0,05 | -3,54 | 1,92 | -12,55 | 0,0219 | -0,0047 | |||
| MGEE / MGE Energy, Inc. | 0,02 | -4,95 | 1,91 | -9,56 | 0,0218 | -0,0039 | |||
| CPK / Chesapeake Utilities Corporation | 0,01 | 1,44 | 1,44 | -5,07 | 0,0165 | -0,0020 | |||
| HTO / H2O America | 0,02 | -2,50 | 1,08 | -7,39 | 0,0123 | -0,0018 | |||
| NWN / Northwest Natural Holding Company | 0,02 | 3,47 | 0,86 | -3,80 | 0,0098 | -0,0010 | |||
| MSEX / Middlesex Water Company | 0,01 | -1,89 | 0,65 | -17,03 | 0,0075 | -0,0021 | |||
| PEP / PepsiCo, Inc. | 0,00 | 22,54 | 0,10 | 8,42 | 0,0012 | 0,0000 | |||
| BLK / BlackRock, Inc. | 0,00 | 14,29 | 0,08 | 27,12 | 0,0009 | 0,0001 | |||
| ADBE / Adobe Inc. | 0,00 | -100,00 | 0,00 | 0,0000 | |||||
| MCD / McDonald's Corporation | 0,00 | -100,00 | 0,00 | 0,0000 | |||||
| AAPL / Apple Inc. | 0,00 | -100,00 | 0,00 | 0,0000 | |||||
| RSG / Republic Services, Inc. | 0,00 | -100,00 | 0,00 | 0,0000 | |||||
| CL / Colgate-Palmolive Company | 0,00 | -100,00 | 0,00 | 0,0000 |