Grundlæggende statistik
| Institutionelle ejere | 726 total, 715 long only, 2 short only, 9 long/short - change of 2,68% MRQ |
| Gennemsnitlig porteføljeallokering | 0.3153 % - change of -6,83% MRQ |
| Institutionelle aktier (lange) | 137.214.072 (ex 13D/G) - change of -4,39MM shares -3,10% MRQ |
| Institutionel værdi (lang) | $ 10.987.972 USD ($1000) |
Institutionelt ejerskab og aktionærer
iShares, Inc. - iShares MSCI Japan ETF (US:EWJ) har 726 institutionelle ejere og aktionærer, der har indsendt 13D/G- eller 13F-formularer til Securities Exchange Commission (SEC). Disse institutioner har i alt 137,214,072 aktier. Største aktionærer omfatter Jpmorgan Chase & Co, Morgan Stanley, BlackRock, Inc., Goldman Sachs Group Inc, Envestnet Asset Management Inc, Bank Of America Corp /de/, First Command Advisory Services, Inc., UBS Group AG, Td Asset Management Inc, and Royal Bank Of Canada .
iShares, Inc. - iShares MSCI Japan ETF (ARCA:EWJ) institutionel ejerskabsstruktur viser aktuelle positioner i virksomheden efter institutioner og fonde, samt seneste ændringer i positionsstørrelse. Større aktionærer kan omfatte individuelle investorer, investeringsforeninger, hedgefonde eller institutioner. Skema 13D angiver, at investoren besidder (eller besidder) mere end 5 % af virksomheden og har til hensigt (eller har til hensigt at) aktivt at forfølge en ændring i forretningsstrategi. Skema 13G indikerer en passiv investering på over 5%.
The share price as of April 29, 2026 is 86,81 / share. Previously, on April 30, 2025, the share price was 71,43 / share. This represents an increase of 21,53% over that period.

Fondens stemningsscore
Fund Sentiment Score (fka Ownership Accumulation Score) finder de aktier, der bliver mest købt af fonde. Det er resultatet af en sofistikeret, multi-faktor kvantitativ model, der identificerer virksomheder med de højeste niveauer af institutionel akkumulering. Scoringsmodellen bruger en kombination af den samlede stigning i oplyste ejere, ændringerne i porteføljeallokeringer i disse ejere og andre målinger. Tallet går fra 0 til 100, hvor højere tal indikerer et højere niveau af akkumulering for sine jævnaldrende, og 50 er gennemsnittet.
Opdateringsfrekvens: Dagligt
Se Ownership Explorer, som giver en liste over højest rangerende virksomheder.
AI+ Ask Fintel’s AI assistant about iShares, Inc. - iShares MSCI Japan ETF.
Select a question to share a public post with an AI-crafted answer.
Thinking of good questions…
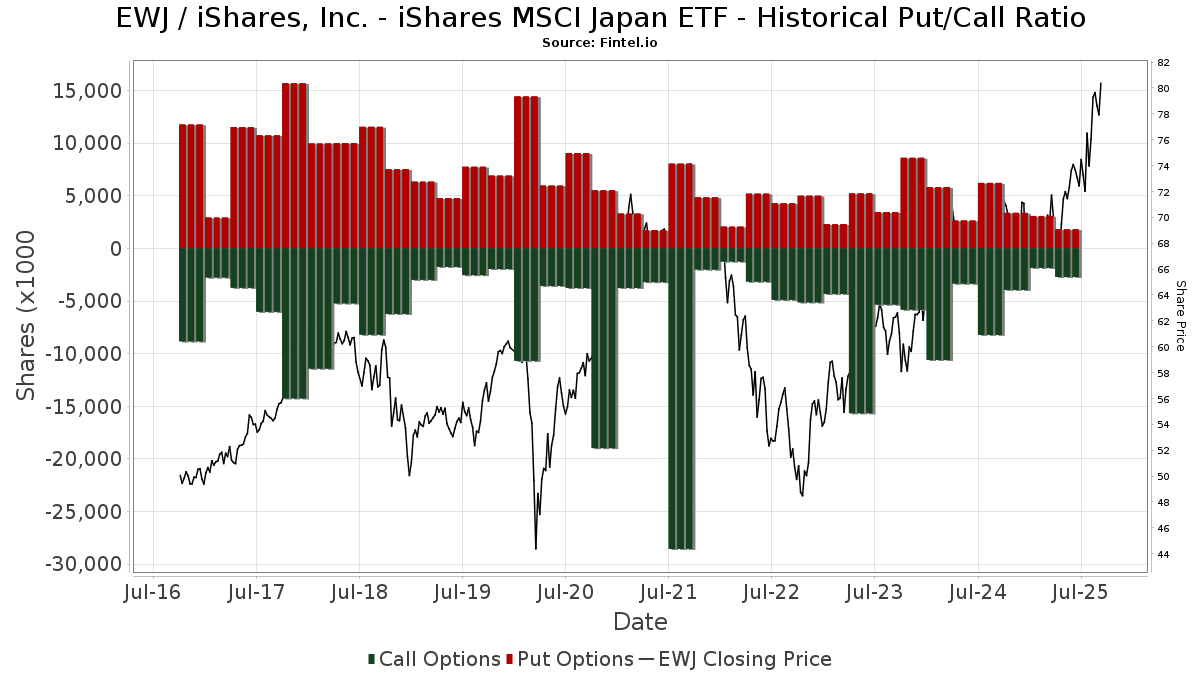
Institutionel Put/Call-forhold
Ud over at indberette standardaktie- og gældsudstedelser skal institutter med mere end 100 mill. aktiver under forvaltning også oplyse deres put- og call-optionsbeholdninger. Da salgsoptioner generelt indikerer negativ stemning, og købsoptioner indikerer positiv stemning, kan vi få en fornemmelse af den overordnede institutionelle stemning ved at plotte forholdet mellem put og kald. Diagrammet til højre viser det historiske put/call-forhold for dette instrument.
Brug af Put/Call Ratio som en indikator for investorernes stemning overvinder en af de vigtigste mangler ved at bruge totalt institutionelt ejerskab, som er, at en betydelig mængde af aktiver under forvaltning investeres passivt for at spore indekser. Passivt forvaltede fonde køber typisk ikke optioner, så indikatoren for put/call-forholdet følger mere nøje følelsen af aktivt forvaltede fonde.
13D/G-arkivering
Vi præsenterer 13D/G ansøgninger separat fra 13F ansøgninger på grund af den forskellige behandling af SEC. 13D/G-ansøgninger kan indgives af grupper af investorer (med én ledende), hvorimod 13F-ansøgninger ikke kan. Dette resulterer i situationer, hvor en investor kan indsende en 13D/G, der rapporterer én værdi for de samlede aktier (der repræsenterer alle de aktier, der ejes af investorgruppen), men derefter indsender en 13F, der rapporterer en anden værdi for de samlede aktier (der udelukkende repræsenterer deres egne) ejendomsret). Det betyder, at aktieejerskab af 13D/G-arkiver og 13F-arkiveringer ofte ikke er direkte sammenlignelige, så vi præsenterer dem separat.
Bemærk: Fra den 16. maj 2021 viser vi ikke længere ejere, der ikke har indsendt en 13D/G inden for det seneste år. Tidligere viste vi den fulde historie af 13D/G-arkiver. Generelt skal enheder, der er forpligtet til at indgive 13D/G-ansøgninger, indgive mindst årligt, før de indsender en afsluttende ansøgning. Dog forlader fonde nogle gange positioner uden at indsende en afsluttende ansøgning (dvs. de afvikler), så visning af den fulde historie resulterede nogle gange i forvirring om det nuværende ejerskab. For at undgå forvirring viser vi nu kun 'aktuelle' ejere - det vil sige - ejere, der har anmeldt inden for det seneste år.
Upgrade to unlock premium data.
| Fil dato | Form | Investor | Forrige Aktier |
Seneste Aktier |
Δ Aktier (Procent) |
Ejendomsret (Procent) |
Δ Ejerskab (Procent) |
|
|---|---|---|---|---|---|---|---|---|
| 2026-01-21 | BlackRock Portfolio Management LLC | 9,960,914 | 12,443,884 | 24.93 | 6.40 | 23.08 | ||
| 2025-04-22 | BlackRock, Inc. | 15,977,301 | 7,691,236 | -51.86 | 3.90 | -49.35 |
13F og NPORT arkivering
Detaljer om 13F-arkivering er gratis. Detaljer om NP-ansøgninger kræver et premium-medlemskab. Grønne rækker angiver nye positioner. Røde rækker angiver lukkede positioner. Klik på linket ikon for at se den fulde transaktionshistorik.
Opgrader
for at låse premium-data op og eksportere til Excel ![]() .
.
| Fil dato | Kilde | Investor | Type | Gennemsnitlig pris (Øst) |
Aktier | Δ Aktier (%) |
Rapporteret Værdi ($1000) |
Δ Værdi (%) |
Port Alloc (%) |
|
|---|---|---|---|---|---|---|---|---|---|---|
| 2026-02-06 | 13F | Global Retirement Partners, LLC | 8.677 | 12,15 | 701 | 12,90 | ||||
| 2026-02-12 | 13F | Mission Creek Capital Partners, Inc. | 3.327 | -13,45 | 269 | -12,99 | ||||
| 2026-04-13 | 13F | Bank of New Hampshire | 1.480 | 0,00 | 125 | 4,20 | ||||
| 2026-02-17 | 13F | Old Mission Capital Llc | 153.332 | 12.380 | ||||||
| 2026-02-10 | 13F | Rothschild Investment Llc | 10.270 | 0,79 | 829 | 1,47 | ||||
| 2026-02-11 | 13F | Conquis Financial Llc | 165 | 13 | ||||||
| 2026-02-20 | 13F | Kovitz Investment Group Partners, LLC | 166.711 | -1,86 | 13.460 | -1,21 | ||||
| 2026-02-17 | 13F | DV Trading LLC | 7.094 | 573 | ||||||
| 2026-02-04 | 13F | BCJ Capital Management, LLC | 30.446 | -55,11 | 2.458 | -54,81 | ||||
| 2026-02-06 | 13F | Pnc Financial Services Group, Inc. | 236.751 | 2,28 | 19.115 | 2,96 | ||||
| 2026-02-13 | 13F | Delos Wealth Advisors, LLC | 204 | 0,00 | 16 | 0,00 | ||||
| 2026-04-17 | 13F | McHugh Group, LLC | 12.450 | 1.051 | ||||||
| 2026-02-03 | 13F/A | Bank Of America Corp /de/ | Call | 0 | -100,00 | 0 | -100,00 | |||
| 2026-02-03 | 13F/A | Bank Of America Corp /de/ | Put | 0 | -100,00 | 0 | -100,00 | |||
| 2026-04-13 | 13F | Sarasin & Partners LLP | 85.455 | 7.216 | ||||||
| 2026-04-15 | 13F | Fortitude Family Office, LLC | 25 | -94,05 | 2 | -93,94 | ||||
| 2026-02-13 | 13F | AlTi Global, Inc. | 38.832 | 0,00 | 3.135 | 0,67 | ||||
| 2026-02-13 | 13F | Karpus Management, Inc. | 1.000 | 81 | ||||||
| 2026-04-21 | 13F | Maridea Wealth Management LLC | 12.608 | 11,15 | 1.065 | 16,28 | ||||
| 2025-11-03 | 13F | Trifecta Capital Advisors, LLC | 0 | -100,00 | 0 | -100,00 | ||||
| 2026-04-20 | 13F | Banque Cantonale Vaudoise | 1.453 | 0,00 | 122 | 4,27 | ||||
| 2026-02-13 | 13F | NLB Skladi, upravljanje premozenja, d.o.o. | 59.777 | 4.826 | ||||||
| 2026-03-20 | 13F | Purpose Unlimited Inc. | 120.355 | 9.717 | ||||||
| 2026-04-15 | 13F | Hartford Financial Management Inc. | 17 | 1 | ||||||
| 2026-02-10 | 13F/A | Northwestern Mutual Wealth Management Co | 130.029 | -14,02 | 10.498 | -13,45 | ||||
| 2026-02-11 | 13F | Tradition Wealth Management, LLC | 2.811 | 0,79 | 227 | 1,35 | ||||
| 2026-01-30 | 13F | Pekin Hardy Strauss, Inc. | 18.271 | 233,05 | 1.475 | 235,23 | ||||
| 2026-04-17 | 13F/A | Founders Financial Securities Llc | 23.820 | 2,35 | 2.101 | 11,81 | ||||
| 2026-02-12 | 13F | Intesa Sanpaolo Wealth Management | 1.420 | 115 | ||||||
| 2026-04-24 | 13F | Strs Ohio | 226.103 | -18,11 | 19.092 | -14,35 | ||||
| 2026-02-03 | 13F | Harel Insurance Investments & Financial Services Ltd. | 128.526 | 0,09 | 10 | 0,00 | ||||
| 2026-01-07 | 13F | Aventura Private Wealth, LLC | 177 | 0,00 | 14 | 0,00 | ||||
| 2026-02-26 | 13F | Ssa Swiss Advisors Ag | 24.649 | -10,92 | 1.991 | -10,48 | ||||
| 2026-04-13 | 13F | Moody Lynn & Lieberson, Llc | 6.619 | 559 | ||||||
| 2026-02-17 | 13F | Bci Securities, Inc. | 6.380 | 515 | ||||||
| 2026-02-11 | 13F | Deutsche Bank Ag\ | 1.485.190 | 1,21 | 119.914 | 1,88 | ||||
| 2026-01-29 | 13F | LFA - Lugano Financial Advisors SA | 696 | 32,82 | 56 | 33,33 | ||||
| 2026-04-08 | 13F | Red Reef Advisors Llc | 20 | 2 | ||||||
| 2026-02-11 | 13F | O'shaughnessy Asset Management, Llc | 8.096 | 9,39 | 654 | 10,12 | ||||
| 2026-01-26 | 13F | Main Street Group, LTD | 0 | -100,00 | 0 | |||||
| 2026-04-21 | 13F | Sbe Llc Dba Cedar Cove Wealth Partners | 0 | -100,00 | 0 | |||||
| 2026-02-11 | 13F | WESCAP Management Group, Inc. | 48.504 | -8,90 | 3.916 | -8,29 | ||||
| 2026-04-27 | 13F | Sound Income Strategies, LLC | 17 | 1 | ||||||
| 2026-04-29 | 13F | Hughes Financial Services, LLC | 29 | 0,00 | 2 | 0,00 | ||||
| 2026-02-13 | 13F | Wells Fargo & Company/mn | 792.663 | 28,12 | 64.000 | 28,96 | ||||
| 2026-02-17 | 13F | Capital Wealth Alliance, LLC | 6.478 | 13,77 | 591 | 29,61 | ||||
| 2026-03-16 | 13F | Osbon Capital Management Llc | 1.804 | -95,30 | 146 | -93,08 | ||||
| 2026-01-30 | 13F | Sigma Planning Corp | 3.032 | 245 | ||||||
| 2026-02-12 | 13F | Loomis Sayles & Co L P | 20.000 | 0,00 | 1.615 | 0,62 | ||||
| 2026-04-20 | 13F | MBA Advisors LLC | 4.916 | -0,83 | 415 | 3,75 | ||||
| 2026-02-18 | 13F | EP Wealth Advisors, Inc. | 60.244 | 5,67 | 4.864 | 13,80 | ||||
| 2026-04-21 | 13F | Spectrum Asset Management, Inc. (NB/CA) | 0 | -100,00 | 0 | |||||
| 2026-01-29 | 13F | UBS Group AG | Call | 2.913.000 | -41,19 | 235.196 | -40,80 | |||
| 2026-01-29 | 13F | UBS Group AG | 1.881.086 | -3,31 | 151.879 | -2,67 | ||||
| 2026-01-23 | 13F | Guidance Capital, Inc | 15.371 | 46,68 | 1.304 | 50,93 | ||||
| 2026-01-29 | 13F | Comerica Bank | 312.221 | -9,23 | 25.209 | -8,63 | ||||
| 2026-02-17 | 13F | EFG International AG | 163.820 | 13.227 | ||||||
| 2026-02-12 | 13F | Federated Hermes, Inc. | 108 | -53,25 | 9 | -55,56 | ||||
| 2026-04-16 | 13F | Sterling Investment Counsel, LLC | 6.250 | 528 | ||||||
| 2026-04-30 | 13F | LRI Investments, LLC | 433 | 26,98 | 37 | 33,33 | ||||
| 2026-02-10 | 13F | Holderness Investments Co | 4.159 | -4,70 | 336 | -4,29 | ||||
| 2026-04-27 | 13F | Qrg Capital Management, Inc. | 2.618 | -7,39 | 221 | -3,07 | ||||
| 2026-02-13 | 13F | Itau Unibanco Holding S.A. | 763.060 | 52,23 | 61.609 | 53,24 | ||||
| 2026-04-22 | 13F | JNBA Financial Advisors | 431 | 0,00 | 36 | 5,88 | ||||
| 2026-02-11 | 13F | Prudential Plc | 214.100 | -2,15 | 17.286 | -1,50 | ||||
| 2026-01-14 | 13F | BFI Infinity Ltd. | Put | 0 | -100,00 | 0 | -100,00 | |||
| 2026-03-04 | 13F | Rehmann Capital Advisory Group | 7.769 | 58,97 | 627 | 59,95 | ||||
| 2026-02-12 | 13F | Hrt Financial Lp | 0 | -100,00 | 0 | |||||
| 2026-04-08 | 13F | Dynamic Advisor Solutions LLC | 12.899 | -10,28 | 1.089 | -6,12 | ||||
| 2025-11-14 | 13F | Strategic Wealth Partners, Ltd. | 103.699 | 1,44 | 8.318 | 8,52 | ||||
| 2026-02-13 | 13F | River Wealth Advisors LLC | 8.551 | 0,00 | 690 | 0,73 | ||||
| 2026-02-17 | 13F | Captrust Financial Advisors | 6.108 | 144,42 | 493 | 146,50 | ||||
| 2026-01-15 | 13F | Rebalance, Llc | 8.945 | 12,50 | 722 | 13,34 | ||||
| 2026-02-05 | 13F | RiverFront Investment Group, LLC | 2.734 | 4,35 | 221 | 4,76 | ||||
| 2026-02-11 | 13F | Resolute Advisors LLC | 4.310 | 16,90 | 348 | 17,63 | ||||
| 2026-02-11 | 13F | Invst, LLC | 7.831 | 632 | ||||||
| 2026-02-09 | 13F | Fisher Asset Management, LLC | 2.503.057 | -3,39 | 202.097 | -2,75 | ||||
| 2025-11-14 | 13F | Nan Shan Life Insurance Co., Ltd. | 0 | -100,00 | 0 | |||||
| 2025-11-13 | 13F | Capital Fund Management S.a. | Call | 0 | -100,00 | 0 | -100,00 | |||
| 2026-01-27 | 13F | TD Waterhouse Canada Inc. | 217.879 | 5,33 | 17.587 | 5,75 | ||||
| 2026-02-10 | 13F | Baker Avenue Asset Management, LP | 209.723 | 0,15 | 16.933 | 0,82 | ||||
| 2026-02-05 | 13F | Thrivent Financial For Lutherans | 204.325 | 10,24 | 17 | 14,29 | ||||
| 2026-04-28 | 13F | Golden State Wealth Management, LLC | 672 | 0,00 | 57 | 3,70 | ||||
| 2025-11-04 | 13F | Flaharty Asset Management, LLC | 0 | -100,00 | 0 | |||||
| 2026-04-17 | 13F | Worth Asset Management, LLC | 4.500 | 2,09 | 380 | 6,76 | ||||
| 2026-02-04 | 13F | Midwest Trust Co | 7.227 | -8,52 | 584 | -7,90 | ||||
| 2026-01-20 | 13F | Ascent Group, LLC | 31.149 | 2.515 | ||||||
| 2026-04-21 | 13F | Corecam AG | 28.910 | 0,00 | 2.441 | 4,58 | ||||
| 2026-04-29 | 13F | WPG Advisers, LLC | 15 | 0,00 | 1 | 0,00 | ||||
| 2026-02-18 | 13F | Caitlin John, LLC | 60 | 5 | ||||||
| 2026-03-24 | 13F | Armis Advisers, LLC | 3.517 | -1,32 | 286 | -4,36 | ||||
| 2026-02-13 | 13F | Ubs Asset Management Americas Inc | 41.609 | 3.360 | ||||||
| 2026-04-13 | 13F | BFI Infinity Ltd. | 6.719 | 71,27 | 567 | 79,43 | ||||
| 2026-02-17 | 13F | Russell Investments Group, Ltd. | 2.036 | -31,19 | 164 | -30,80 | ||||
| 2026-02-17 | 13F | Wellington Management Group Llp | 5.500 | -82,28 | 444 | -82,17 | ||||
| 2026-02-04 | 13F | Strait & Sound Wealth Management LLC | 11.522 | 0,94 | 930 | 1,64 | ||||
| 2025-11-14 | 13F | Wetherby Asset Management Inc | 7.000 | 100,00 | 561 | 114,12 | ||||
| 2026-02-12 | 13F | Founders Financial Alliance, LLC | 26 | -79,37 | 2 | -80,00 | ||||
| 2026-04-14 | 13F | Papp L Roy & Associates | 3.555 | 0,00 | 300 | 4,53 | ||||
| 2026-01-23 | 13F | LOM Asset Management Ltd | 28.724 | 12,10 | 2.319 | 12,85 | ||||
| 2026-04-30 | 13F | Sequoia Financial Advisors, LLC | 10.047 | 2,82 | 848 | 7,61 | ||||
| 2026-02-03 | 13F | NewEdge Wealth, LLC | 23.114 | 28,09 | 1.866 | 24,90 | ||||
| 2026-02-10 | 13F | Meridian Management Co | 57.100 | 0,00 | 4.610 | 0,68 | ||||
| 2025-11-20 | 13F | Centaurus Financial, Inc. | 0 | -100,00 | 0 | |||||
| 2026-02-10 | 13F | Catalyst Capital Advisors LLC | 759.224 | -5,53 | 61.300 | -4,90 | ||||
| 2026-02-10 | 13F | Nomura Asset Management Co Ltd | 10.700 | 38,96 | 864 | 39,87 | ||||
| 2026-02-17 | 13F | Warren Averett Asset Management, LLC | 66.027 | 467,93 | 5.331 | 472,00 | ||||
| 2026-02-24 | 13F | MidFirst Bank | 402 | 32 | ||||||
| 2026-04-20 | 13F | Hilton Head Capital Partners, LLC | 35 | 0,00 | 3 | 0,00 | ||||
| 2026-04-29 | 13F | Greenwood Capital Associates Llc | 2.495 | -32,42 | 211 | -29,53 | ||||
| 2026-02-13 | 13F | Banco Santander, S.A. | 152.876 | -38,61 | 12.343 | -38,21 | ||||
| 2026-04-15 | 13F | Activest Wealth Management | 2.356 | 0,00 | 199 | 4,21 | ||||
| 2026-02-17 | 13F | Millennium Management Llc | Put | 0 | -100,00 | 0 | ||||
| 2026-02-17 | 13F | Millennium Management Llc | Call | 0 | -100,00 | 0 | ||||
| 2026-04-27 | 13F | HB Wealth Management, LLC | 7.420 | 627 | ||||||
| 2026-02-18 | 13F | Mackenzie Financial Corp | 333.637 | -0,45 | 26.965 | 0,31 | ||||
| 2026-04-08 | 13F | Olistico Wealth, LLC | 0 | -100,00 | 0 | |||||
| 2026-04-22 | 13F | Eqis Capital Management, Inc. | 2.869 | 10,52 | 242 | 15,79 | ||||
| 2026-02-17 | 13F | BTG Pactual Asset Management US LLC | 114.392 | -2,87 | 9.070 | -2,87 | ||||
| 2026-01-29 | 13F | D.a. Davidson & Co. | 14.091 | 3,09 | 1.138 | 3,74 | ||||
| 2026-02-17 | 13F | Snowden Capital Advisors LLC | 10.628 | -10,56 | 858 | -9,97 | ||||
| 2026-04-27 | 13F | Actinver Wealth Management, Inc. | 5.184 | -51,94 | 438 | -49,77 | ||||
| 2026-02-06 | 13F | TPG Financial Advisors, LLC | 2.893 | 234 | ||||||
| 2026-02-06 | 13F | EverSource Wealth Advisors, LLC | 8 | 0,00 | 1 | |||||
| 2026-02-17 | 13F | Ravenswood Partners LP | 0 | -100,00 | 0 | |||||
| 2026-04-23 | 13F | Game Plan Financial Advisors, LLC | 256 | -20,50 | 22 | -16,00 | ||||
| 2026-04-30 | 13F | Summa Corp. | 3.265 | 276 | ||||||
| 2026-04-24 | 13F | Balentine LLC | 152 | -95,80 | 13 | -95,89 | ||||
| 2026-02-13 | 13F | Integrated Wealth Concepts LLC | 41.673 | -4,34 | 3.365 | -3,72 | ||||
| 2026-04-27 | 13F | Burford Brothers, Inc. | 3.004 | -34,24 | 254 | -31,25 | ||||
| 2026-02-17 | 13F | Clear Street Markets Llc | 25.000 | 2.018 | ||||||
| 2026-04-22 | 13F | Tepp RIA, LLC | 39.287 | 3.317 | ||||||
| 2026-02-12 | 13F | Compass Capital Corp /ma/ /adv | 2.941 | 274 | ||||||
| 2026-02-12 | 13F | Provida Pension Fund Administrator | 0 | -100,00 | 0 | |||||
| 2026-02-13 | 13F | Alaska Permanent Capital Management | 0 | -100,00 | 0 | |||||
| 2026-04-29 | 13F | Bluefin Capital Management, Llc | 7.700 | 622 | ||||||
| 2026-04-15 | 13F | Paragon Capital Management Ltd | 26.255 | -0,42 | 2.217 | 4,18 | ||||
| 2025-11-13 | 13F | Promus Capital, LLC | 54.443 | 1,99 | 4.367 | 9,12 | ||||
| 2026-02-13 | 13F | Mariner, LLC | 14.154 | -0,34 | 1.143 | 0,26 | ||||
| 2026-02-13 | 13F | Colony Group, LLC | 23.868 | 147,52 | 1.927 | 149,29 | ||||
| 2026-04-22 | 13F | Sentry LLC | 3.456 | 0,00 | 292 | 4,30 | ||||
| 2026-02-12 | 13F | Philadelphia Trust Co | 2.500 | 0,00 | 0 | |||||
| 2025-11-13 | 13F | Eisler Capital Management Ltd. | Put | 600.000 | 47.880 | |||||
| 2025-11-13 | 13F | Eisler Capital Management Ltd. | 119.006 | 9.497 | ||||||
| 2026-04-24 | 13F | Root Financial Partners, LLC | 76 | -43,28 | 6 | -40,00 | ||||
| 2026-02-02 | 13F | FSA Advisors, Inc. | 25.076 | 26 | ||||||
| 2026-02-17 | 13F | Royal Bank Of Canada | 2.542.081 | 254,37 | 205.247 | 256,72 | ||||
| 2026-04-17 | 13F | IFC & Insurance Marketing, Inc. | 0 | -100,00 | 0 | |||||
| 2026-02-13 | 13F | Boreal Capital Management LLC | 0 | -100,00 | 0 | |||||
| 2026-01-23 | 13F | Freestone Capital Holdings, LLC | 4.060 | 3,31 | 328 | 3,81 | ||||
| 2026-02-12 | 13F | Jasper Ridge Partners, L.P. | 54.925 | 0,00 | 4.435 | 0,66 | ||||
| 2026-02-17 | 13F | Bank Of America Corp /de/ | 5.473.309 | 4,94 | 441.915 | 5,63 | ||||
| 2026-04-16 | 13F | Toth Financial Advisory Corp | 1.639 | 202,40 | 138 | 220,93 | ||||
| 2026-02-13 | 13F | Element Pointe Advisors, Llc | 144.664 | 7,05 | 11.680 | 7,76 | ||||
| 2026-04-15 | 13F | Merit Financial Group, LLC | 8.535 | 23,37 | 721 | 29,03 | ||||
| 2026-02-10 | 13F | Argent Trust Co | 6.473 | 0,00 | 523 | 0,58 | ||||
| 2026-04-23 | 13F | Harbor Investment Advisory, Llc | 3.301 | -18,51 | 279 | -14,98 | ||||
| 2026-02-06 | 13F | Larson Financial Group LLC | 178 | -17,21 | 14 | -17,65 | ||||
| 2026-02-03 | 13F | Emerald Investment Partners, Llc | 4.065 | -8,47 | 328 | -7,87 | ||||
| 2026-04-28 | 13F | Walkner Condon Financial Advisors LLC | 108.957 | 11,77 | 9.200 | 16,90 | ||||
| 2026-04-06 | 13F | CX Institutional | 9.443 | -0,40 | 1 | |||||
| 2026-02-17 | 13F | Woodline Partners LP | 5.141 | 415 | ||||||
| 2026-02-17 | 13F | Pacific Financial Group Inc | 8.477 | -11,95 | 684 | -11,40 | ||||
| 2026-02-12 | 13F | Barings Llc | 177.148 | -10,83 | 14.303 | -10,25 | ||||
| 2026-02-13 | 13F | Partners Capital Investment Group, Llp | 212.681 | -16,26 | 17.172 | -15,71 | ||||
| 2026-02-10 | 13F | Ssi Investment Management Llc | 42.023 | -26,42 | 3.393 | -25,94 | ||||
| 2026-02-13 | 13F | Walleye Trading LLC | Call | 44.700 | 55,21 | 3.609 | 56,23 | |||
| 2026-02-17 | 13F | Board of Trustees of The Leland Stanford Junior University | 971.270 | 0,00 | 78.420 | 0,66 | ||||
| 2026-02-17 | 13F | Signature Equity Partners, LLC | 81 | 7 | ||||||
| 2026-04-10 | 13F | Armstrong Advisory Group, Inc | 8.485 | -97,76 | 716 | -97,66 | ||||
| 2026-02-11 | 13F | First Command Advisory Services, Inc. | 4.993.457 | 0,28 | 403.172 | 0,94 | ||||
| 2026-04-10 | 13F | Integris Wealth Management, LLC | 6.629 | 0,00 | 560 | 4,49 | ||||
| 2026-02-11 | 13F | Metis Global Partners, LLC | 254.067 | 20.513 | ||||||
| 2026-01-23 | 13F | Legacy Bridge, LLC | 700 | 0,00 | 57 | 0,00 | ||||
| 2026-02-13 | 13F | Walleye Trading LLC | Put | 4.900 | 0,00 | 396 | 0,51 | |||
| 2026-04-29 | 13F | Saxon Interests, Inc. | 0 | -100,00 | 0 | |||||
| 2026-02-17 | 13F | Glenmede Trust Co Na | 1.397.051 | 4,61 | 112.798 | 23,20 | ||||
| 2026-02-09 | 13F | Harbour Investments, Inc. | 1.620 | 1.900,00 | 131 | 2.066,67 | ||||
| 2026-04-23 | 13F | Farmers & Merchants Investments Inc | 1.874 | 438,51 | 158 | 464,29 | ||||
| 2026-02-13 | 13F | Morgan Stanley | 19.577.080 | -3,19 | 1.580.654 | -2,55 | ||||
| 2026-04-08 | 13F | RoundAngle Advisors LLC | 24.245 | -11,10 | 2.047 | -7,04 | ||||
| 2026-04-21 | 13F | Trilogy Capital Inc. | 2.776 | 8,61 | 234 | 13,59 | ||||
| 2026-02-02 | 13F | Legacy Edge Advisors, LLC | 3.157 | 255 | ||||||
| 2025-11-06 | 13F | Blume Capital Management, Inc. | 0 | -100,00 | 0 | |||||
| 2026-04-24 | 13F | Patten Group, Inc. | 4.023 | 3,50 | 340 | 8,31 | ||||
| 2026-02-09 | 13F | Huntington National Bank | 63 | 8,77 | ||||||
| 2026-04-23 | 13F | Private Wealth Management Group, LLC | 800 | 0,00 | 68 | 4,69 | ||||
| 2026-02-11 | 13F | Cerity Partners LLC | 23.680 | 57,92 | 1.912 | 58,99 | ||||
| 2026-02-06 | 13F | Fortis Group Advisors, LLC | 19.039 | 126.826,67 | 1.632 | 163.000,00 | ||||
| 2026-02-17 | 13F | Mercer Global Advisors Inc /adv | 16.421 | 92,24 | 1.326 | 93,43 | ||||
| 2026-02-13 | 13F | MAI Capital Management | 2.076 | 129,90 | 168 | 131,94 | ||||
| 2026-04-06 | 13F | Rosenberg Matthew Hamilton | 1.500 | 0,00 | 127 | 4,13 | ||||
| 2026-02-09 | 13F | Wellington Shields Capital Management, LLC | 4.550 | 8,33 | 367 | 9,23 | ||||
| 2025-11-06 | 13F | Abc Arbitrage Sa | 0 | -100,00 | 0 | -100,00 | ||||
| 2026-04-14 | 13F | Banque Pictet & Cie Sa | 34.781 | -18,10 | 2.937 | -14,35 | ||||
| 2026-02-13 | 13F | Smartleaf Asset Management LLC | 131 | 122,03 | 11 | 150,00 | ||||
| 2026-04-20 | 13F | Breakwater Capital Group | 19.641 | 25,77 | 1.658 | 31,59 | ||||
| 2026-02-17 | 13F | Lazard Asset Management Llc | 20.277 | -9,25 | 1.637 | -8,65 | ||||
| 2026-02-10 | 13F | Clear Harbor Asset Management, LLC | 5.315 | 107,21 | 429 | 109,27 | ||||
| 2025-11-12 | 13F | Proficio Capital Partners LLC | 0 | -100,00 | 0 | |||||
| 2026-02-13 | 13F | Level Four Advisory Services, Llc | 6.108 | -0,38 | 493 | 0,41 | ||||
| 2026-02-03 | 13F | Providence First Trust Co | 11.267 | 910 | ||||||
| 2026-04-06 | 13F | Israel Discount Bank of New York | 17.438 | 66,58 | 1.472 | 74,20 | ||||
| 2026-04-20 | 13F | Kestra Private Wealth Services, Llc | 14.962 | 108,33 | 1.263 | 118,13 | ||||
| 2026-04-29 | 13F | Meitav Dash Investments Ltd | 30.368 | 0,00 | 2.564 | 4,61 | ||||
| 2025-10-31 | 13F | Frazier Financial Advisors, LLC | 0 | -100,00 | 0 | |||||
| 2025-10-30 | 13F | Ridgewood Investments LLC | 0 | -100,00 | 0 | |||||
| 2026-02-17 | 13F | Michelson Medical Research Foundation, Inc. | 0 | -100,00 | 0 | |||||
| 2026-04-30 | 13F | BRYN MAWR TRUST Co | 13.492 | 0,00 | 1.139 | 4,59 | ||||
| 2026-03-05 | 13F | Mengis Capital Management, Inc. | 2.500 | 202 | ||||||
| 2026-04-21 | 13F | North Forty Two & Co. | 3.425 | 9,60 | 289 | 14,68 | ||||
| 2026-02-17 | 13F | Advisor Group Holdings, Inc. | 460.155 | -2,46 | 37.155 | -1,55 | ||||
| 2026-02-11 | 13F | Galilei Investment Office LLP | 18.000 | 0,00 | 1.453 | 0,69 | ||||
| 2026-02-12 | 13F | JPL Wealth Management, LLC | 0 | -100,00 | 0 | |||||
| 2026-02-17 | 13F | Toronto Dominion Bank | 17.572 | 2.893,53 | 1.414 | 2.973,91 | ||||
| 2026-04-30 | 13F | Nisa Investment Advisors, Llc | 17.100 | 0,00 | 1.444 | 4,57 | ||||
| 2026-02-12 | 13F | Laffer Investments | 10.838 | 0,00 | 875 | 0,69 | ||||
| 2026-02-10 | 13F | Greenwich Wealth Management LLC | 16.561 | 0,86 | 1 | 0,00 | ||||
| 2026-04-22 | 13F | Finley Financial, LLC | 4.130 | 6,17 | 349 | 10,83 | ||||
| 2026-02-06 | 13F | Gables Capital Management Inc. | 287 | 0,00 | 23 | 0,00 | ||||
| 2026-02-14 | 13F | Rockefeller Capital Management L.P. | 398.975 | 7,76 | 32.221 | 8,50 | ||||
| 2026-02-17 | 13F | Raymond James Financial Inc | 305.269 | 21,43 | 24.647 | 22,24 | ||||
| 2026-02-13 | 13F | National Bank Of Canada /fi/ | 601.400 | -3,82 | 48.557 | -3,19 | ||||
| 2026-01-21 | 13F | Y.D. More Investments Ltd | 19.503 | 9.507,39 | 1.575 | 9.737,50 | ||||
| 2026-02-03 | 13F | Climber Capital SA | 7.107 | -12,44 | 589 | -2,81 | ||||
| 2026-02-13 | 13F | Hudson Portfolio Management LLC | 36.085 | 26,11 | 2.914 | 26,93 | ||||
| 2026-04-22 | 13F | Janney Montgomery Scott LLC | 32.343 | 69,75 | 3 | 100,00 | ||||
| 2026-04-23 | 13F | Glass Jacobson Investment Advisors llc | 506 | 0,00 | 43 | 5,00 | ||||
| 2026-02-11 | 13F | LPL Financial LLC | 1.072.608 | 41,30 | 86.602 | 42,23 | ||||
| 2026-02-11 | 13F | Allianz Asset Management GmbH | 158.500 | -26,48 | 12.797 | -26,00 | ||||
| 2026-04-23 | 13F | Analyst IMS Investment Management Services Ltd. | 2.753 | -5,49 | 0 | |||||
| 2026-02-10 | 13F | Lido Advisors, LLC | 229.307 | 1,84 | 18.410 | 1,93 | ||||
| 2026-02-17 | 13F | Css Llc/il | Put | 2.500 | 202 | |||||
| 2026-04-14 | 13F | Opal Wealth Advisors, LLC | 1.773 | 150 | ||||||
| 2026-02-05 | 13F | Granite Bay Wealth Management, LLC | 214.716 | 4,01 | 17.336 | 4,70 | ||||
| 2026-03-04 | 13F | SHP Wealth Management | 48 | 4 | ||||||
| 2026-02-11 | 13F | Capital Analysts, Inc. | 1.196 | -9,12 | 0 | |||||
| 2026-04-24 | 13F | 4Thought Financial Group Inc. | 350 | -8,85 | 30 | -6,45 | ||||
| 2026-02-11 | 13F | Kranot Hishtalmut Le Morim Ve Gananot Havera Menahelet LTD | 23.945 | 0,00 | 1.933 | 0,94 | ||||
| 2026-04-22 | 13F | Quattro Financial Advisors Llc | 30.964 | -4,88 | 2.615 | -0,53 | ||||
| 2026-04-28 | 13F | Flagship Harbor Advisors, Llc | 0 | -100,00 | 0 | |||||
| 2026-02-09 | 13F | Green Square Capital Advisors Llc | 3.070 | 4,07 | 248 | 11,76 | ||||
| 2026-02-06 | 13F | Tortoise Investment Management, LLC | 0 | -100,00 | 0 | |||||
| 2026-02-13 | 13F | Transamerica Financial Advisors, Inc. | 27.382 | 2.211 | ||||||
| 2026-01-26 | 13F | Mirae Asset Global Investments Co., Ltd. | 107.038 | 19,85 | 8.642 | 20,65 | ||||
| 2025-11-14 | 13F | Two Sigma Advisers, Lp | 0 | -100,00 | 0 | |||||
| 2026-02-10 | 13F | a16z Perennial Management, L.P. | 118.984 | 0,00 | 7.998 | 1,98 | ||||
| 2026-04-28 | 13F | Bogart Wealth, LLC | 62 | 0,00 | 5 | 25,00 | ||||
| 2026-02-06 | 13F | Copia Wealth Management | 2.950 | 0,00 | 238 | 0,85 | ||||
| 2026-02-17 | 13F | Two Sigma Investments, Lp | 135.400 | -12,31 | 10.932 | -11,72 | ||||
| 2026-04-28 | 13F | Howe & Rusling Inc | 5.042 | 38,36 | 426 | 44,56 | ||||
| 2026-04-20 | 13F | Sowell Financial Services LLC | 6.803 | 9,20 | 574 | 14,12 | ||||
| 2026-04-24 | 13F | Private Advisor Group, LLC | 30.927 | 6,02 | 2.611 | 10,87 | ||||
| 2026-02-20 | 13F | Sunbelt Securities, Inc. | 22 | -98,00 | 2 | -98,86 | ||||
| 2026-04-14 | 13F | Pictet North America Advisors SA | 119.014 | 53,04 | 10.050 | 60,07 | ||||
| 2026-04-10 | 13F | Piscataqua Savings Bank | 988 | -43,99 | 83 | -41,55 | ||||
| 2026-01-20 | 13F | Steel Peak Wealth Management LLC | 13.527 | -0,14 | 1.092 | 0,55 | ||||
| 2026-01-12 | 13F | VisionPoint Advisory Group, LLC | 3.142 | 254 | ||||||
| 2026-02-12 | 13F | Commonwealth Equity Services, Llc | 62.916 | -1,57 | 5.080 | 101.480,00 | ||||
| 2026-04-14 | 13F | Corecam Pte. Ltd. | 60.550 | 4,49 | 5.113 | 9,28 | ||||
| 2026-04-13 | 13F | Mather Group, Llc. | 7.150 | 0,99 | 604 | 5,60 | ||||
| 2026-02-04 | 13F | Nwam Llc | 8.601 | 11,35 | 724 | 12,77 | ||||
| 2026-02-10 | 13F | Close Asset Management Ltd | 6.050 | 14,15 | 0 | |||||
| 2026-01-16 | 13F | Crewe Advisors LLC | 7.263 | 0,00 | 586 | 0,69 | ||||
| 2026-02-06 | 13F | Vestmark Advisory Solutions, Inc. | 50.618 | 4.087 | ||||||
| 2026-02-17 | 13F | Cardiff Park Advisors, Llc | 0 | -100,00 | 0 | |||||
| 2026-02-18 | 13F | Beacon Pointe Advisors, LLC | Put | 0 | -100,00 | 0 | ||||
| 2026-04-15 | 13F | Compagnie Lombard Odier SCmA | 98.403 | 37,42 | 8.309 | 43,73 | ||||
| 2026-02-17 | 13F | MGB Wealth Management, LLC | 3.257 | 3,83 | 263 | 4,78 | ||||
| 2026-02-13 | 13F | Ausdal Financial Partners, Inc. | 4.543 | 367 | ||||||
| 2026-02-17 | 13F | Main Street Financial Solutions, LLC | 2.538 | 0,00 | 205 | 0,49 | ||||
| 2026-04-17 | 13F | Ignite Planners, LLC | 3.824 | -0,34 | 323 | -1,83 | ||||
| 2026-02-12 | 13F | Insigneo Advisory Services, Llc | 44.067 | 27,85 | 3.558 | 28,69 | ||||
| 2026-04-14 | 13F | Beacon Investment Advisory Services, Inc. | 60 | 5 | ||||||
| 2026-02-17 | 13F | Citadel Advisors Llc | Call | 1.201.200 | 0,54 | 96.985 | 1,21 | |||
| 2026-02-17 | 13F | Citadel Advisors Llc | Put | 1.310.700 | 134,60 | 105.826 | 136,15 | |||
| 2026-02-17 | 13F | Citadel Advisors Llc | 1.097.973 | 54,51 | 88.650 | 55,53 | ||||
| 2026-02-10 | 13F | Moors & Cabot, Inc. | 8.077 | 1,06 | 652 | 1,72 | ||||
| 2026-02-17 | 13F | D. E. Shaw & Co., Inc. | 39.069 | -74,54 | 3.154 | -74,37 | ||||
| 2026-02-13 | 13F | Bollard Group LLC | 139 | 3,73 | 0 | |||||
| 2026-02-13 | 13F | SRS Capital Advisors, Inc. | 401 | 32 | ||||||
| 2026-02-13 | 13F | Lifeworks Advisors, LLC | 23.319 | 14,36 | 1.883 | 15,11 | ||||
| 2026-01-30 | 13F | Archer Investment Corp | 0 | -100,00 | 0 | |||||
| 2026-04-21 | 13F | Narus Financial Partners, LLC | 4.625 | 3,42 | 391 | 8,03 | ||||
| 2025-11-14 | 13F | Old Mission Capital Llc | Call | 0 | -100,00 | 0 | -100,00 | |||
| 2026-02-09 | 13F | Stephens Greth Foundation | 60.128 | 4.855 | ||||||
| 2026-01-14 | 13F | ORG Partners LLC | 0 | -100,00 | 0 | |||||
| 2026-02-10 | 13F | Keewaydin Investments LLC | 540.076 | 43.606 | ||||||
| 2026-02-14 | 13F | Taikang Asset Management (Hong Kong) Co Ltd | 33.005 | 0,00 | 2.665 | 0,64 | ||||
| 2026-02-19 | 13F | Invesco Ltd. | 817.350 | -6,01 | 65.993 | -5,39 | ||||
| 2025-11-12 | 13F | Intellus Advisors LLC | 0 | -100,00 | 0 | |||||
| 2026-01-27 | 13F | Journey Advisory Group, LLC | 64.212 | 5.184 | ||||||
| 2026-02-13 | 13F | Neuberger Berman Group LLC | 150.370 | 3,66 | 12.141 | 4,34 | ||||
| 2026-04-21 | 13F | Curat Global, LLC | 7.457 | 0,00 | 630 | 4,49 | ||||
| 2026-02-13 | 13F | Schroder Investment Management Group | 18.446 | -81,96 | 1.494 | -81,87 | ||||
| 2026-04-22 | 13F | Pasadena Private Wealth, LLC | 25.519 | -2,64 | 2.155 | 1,80 | ||||
| 2026-02-18 | 13F | Sierra Capital LLC | 52.423 | 0,76 | 4 | 0,00 | ||||
| 2026-02-06 | 13F | Saranac Partners Ltd | 0 | -100,00 | 0 | |||||
| 2026-02-06 | 13F | Americana Partners, LLC | 122.234 | 0,98 | 9.869 | 1,65 | ||||
| 2026-02-10 | 13F | BlackDiamond Wealth Management Inc. | 2.746 | 251 | ||||||
| 2026-02-05 | 13F | AlphaCore Capital LLC | 578 | -3,99 | 47 | -4,17 | ||||
| 2026-02-17 | 13F | Fwl Investment Management, Llc | 2.113 | 11,62 | 171 | 12,58 | ||||
| 2026-04-22 | 13F | WestEnd Advisors, LLC | 0 | -100,00 | 0 | |||||
| 2026-04-10 | 13F | Perfromance Wealth Partners, LLC | 5.303 | 0,25 | 448 | 4,68 | ||||
| 2026-04-20 | 13F | Oak Family Advisors, Llc | 27.067 | -1,94 | 2.286 | 2,56 | ||||
| 2026-02-17 | 13F | Fmr Llc | 41.332 | 10,09 | 3.337 | 10,83 | ||||
| 2026-02-04 | 13F | Ameritas Advisory Services, LLC | 13.156 | 1.062 | ||||||
| 2026-01-30 | 13F | Palisades Hudson Asset Management, L.P. | 107.368 | -9,19 | 9 | -11,11 | ||||
| 2025-11-13 | 13F | Prudential Financial Inc | 0 | -100,00 | 0 | |||||
| 2026-02-19 | 13F | Atomi Financial Group, Inc. | 0 | -100,00 | 0 | |||||
| 2026-02-17 | 13F | Greenland Capital Management LP | 0 | -100,00 | 0 | -100,00 | ||||
| 2026-02-23 | 13F | Wealth Preservation Advisors, LLC | 487 | 0,00 | 39 | 0,00 | ||||
| 2026-04-23 | 13F | Barry Investment Advisors, LLC | 202.852 | 0,28 | 17.129 | 4,87 | ||||
| 2026-01-15 | 13F | Lodestone Wealth Management LLC | 197 | 16 | ||||||
| 2026-04-29 | 13F | Envestnet Portfolio Solutions, Inc. | 28.970 | -10,77 | 2.446 | -6,68 | ||||
| 2026-04-28 | 13F | ORG Wealth Partners, LLC | 202 | 0,00 | 17 | 6,25 | ||||
| 2026-04-14 | 13F | Nbc Securities, Inc. | 56 | 51,35 | 5 | 100,00 | ||||
| 2025-11-07 | 13F | Vanguard Group Inc | 0 | -100,00 | 0 | -100,00 | ||||
| 2026-02-17 | 13F | Creative Planning | 46.619 | -11,42 | 3.764 | -10,83 | ||||
| 2026-02-10 | 13F | New Republic Capital, LLC | 56.971 | 22,52 | 4.600 | 23,33 | ||||
| 2026-02-13 | 13F | Toroso Investments, LLC | 85.492 | 6.903 | ||||||
| 2026-04-01 | 13F | Bangor Savings Bank | 0 | -100,00 | 0 | |||||
| 2026-04-30 | 13F | Cambridge Investment Research Advisors, Inc. | 37.520 | 74,30 | 3 | 200,00 | ||||
| 2026-01-29 | 13F | Dunhill Financial, LLC | 1.175 | 1.205,56 | 97 | 1.285,71 | ||||
| 2026-04-22 | 13F | Bravera Wealth | 1.696 | 0,00 | 143 | 5,15 | ||||
| 2026-04-27 | 13F | F&V Capital Management, LLC | 8.005 | 11,10 | 1 | |||||
| 2026-02-06 | 13F/A | Rathbone Brothers plc | 190.723 | -3,25 | 15.399 | -2,61 | ||||
| 2026-02-17 | 13F | Equitable Holdings, Inc. | 34.386 | -9,24 | 2.776 | -8,62 | ||||
| 2026-02-12 | 13F | Financial Engines Advisors L.L.C. | 4.483 | 8,94 | 362 | 9,39 | ||||
| 2025-11-07 | 13F | Beacon Capital Management, LLC | 0 | -100,00 | 0 | |||||
| 2026-04-20 | 13F | Brian Low Financial Group, Llc | 9.592 | 8,35 | 810 | 13,31 | ||||
| 2026-02-10 | 13F | Castlekeep Investment Advisors Llc | 21.822 | 0,00 | 1.762 | 0,63 | ||||
| 2026-02-10 | 13F | Texas Yale Capital Corp. | 5.999 | 0,00 | 484 | 0,62 | ||||
| 2026-02-17 | 13F | Coastal Bridge Advisors, LLC | 33.953 | 0,14 | 2.741 | 0,81 | ||||
| 2026-02-17 | 13F | Parallax Volatility Advisers, L.P. | 0 | -100,00 | 0 | |||||
| 2026-04-08 | 13F | Sax Wealth Advisors, Llc | 5.019 | 0,00 | 405 | 0,00 | ||||
| 2026-04-27 | 13F | Td Private Client Wealth Llc | 58 | 0,00 | 5 | 0,00 | ||||
| 2026-02-17 | 13F | Parallax Volatility Advisers, L.P. | Put | 0 | -100,00 | 0 | ||||
| 2026-04-22 | 13F | Millburn Ridgefield Corp | 799.771 | 5,34 | 67.533 | 10,17 | ||||
| 2026-02-03 | 13F | Retirement Planning Group | 5.140 | -0,19 | 415 | 0,24 | ||||
| 2026-02-13 | 13F | Solstein Capital, LLC | 49.727 | 3,71 | 4.015 | 4,40 | ||||
| 2025-11-14 | 13F | Hilltop Holdings Inc. | 0 | -100,00 | 0 | -100,00 | ||||
| 2026-02-17 | 13F | Dimension Capital Management Llc | 4.419 | 51,80 | 357 | 52,79 | ||||
| 2026-01-30 | 13F | Us Bancorp \de\ | 21.584 | -11,30 | 1.743 | -10,71 | ||||
| 2026-02-05 | 13F | Atria Investments Llc | 5.924 | 16,80 | 478 | 17,73 | ||||
| 2026-02-04 | 13F | MONECO Advisors, LLC | 0 | -100,00 | 0 | |||||
| 2026-02-05 | 13F | Bessemer Group Inc | 70.216 | 0,00 | 6 | 0,00 | ||||
| 2026-04-07 | 13F | Park Avenue Securities Llc | 129.614 | 48,84 | 11 | 42,86 | ||||
| 2026-04-27 | 13F | Wbh Advisory Inc | 13.711 | 1,24 | 1.186 | 8,42 | ||||
| 2026-04-29 | 13F | Strategic Blueprint, LLC | 3.329 | 7,15 | 281 | 12,40 | ||||
| 2026-02-13 | 13F | Evelyn Partners Investment Management LLP | 1.100 | 0,00 | 89 | 0,00 | ||||
| 2026-02-13 | 13F | 1832 Asset Management L.P. | 19.586 | 7,36 | 1.581 | 8,07 | ||||
| 2026-04-22 | 13F | Tred Avon Family Wealth, Llc | 3.180 | 269 | ||||||
| 2026-02-11 | 13F | Dorsey & Whitney Trust CO LLC | 14.467 | -12,93 | 1.168 | -12,31 | ||||
| 2026-02-12 | 13F | Triumph Capital Management | 667 | -8,76 | 54 | -8,62 | ||||
| 2026-02-12 | 13F | Grey Fox Wealth Advisors, LLC | 0 | -100,00 | 0 | |||||
| 2026-02-06 | 13F | Private Wealth Advisors, LLC | 16.622 | 1.342 | ||||||
| 2026-02-10 | 13F | Fort Sheridan Advisors Llc | 6.020 | -0,12 | 486 | 0,62 | ||||
| 2026-02-13 | 13F | Pin Oak Investment Advisors Inc | 869 | 0,00 | 0 | -100,00 | ||||
| 2025-11-21 | 13F | Oarsman Capital, Inc. | 0 | -100,00 | 0 | |||||
| 2026-04-10 | 13F | Magnus Financial Group LLC | 0 | -100,00 | 0 | |||||
| 2026-04-24 | 13F | Essex Financial Services, Inc. | 2.791 | 9,24 | 236 | 14,08 | ||||
| 2026-02-12 | 13F | Sit Investment Associates Inc | 0 | -100,00 | 0 | |||||
| 2026-04-07 | 13F | Farther Finance Advisors, LLC | 17.733 | 51,05 | 1.534 | 61,88 | ||||
| 2026-02-11 | 13F | Financiere des Professionnels - Fonds d,investissement inc. | 70.000 | 0,00 | 5.652 | 0,66 | ||||
| 2026-04-27 | 13F | Sharp Financial Services, LLC | 6.517 | 5,76 | 550 | 10,66 | ||||
| 2026-02-10 | 13F | JTC Employer Solutions Trusteee Ltd | 48.837 | 0,00 | 4 | 0,00 | ||||
| 2026-02-17 | 13F | Banco Bilbao Vizcaya Argentaria, S.a. | 0 | -100,00 | 0 | |||||
| 2026-02-13 | 13F | Baird Financial Group, Inc. | 26.786 | 3,60 | 2.163 | 4,29 | ||||
| 2026-02-10 | 13F | Foundations Investment Advisors, LLC | 106.569 | 8.604 | ||||||
| 2026-04-28 | 13F | Kingswood Wealth Advisors, Llc | 3.011 | 254 | ||||||
| 2026-02-17 | 13F | Two Sigma Securities, Llc | 0 | -100,00 | 0 | |||||
| 2026-04-13 | 13F | Massmutual Trust Co Fsb/adv | 15.007 | -1,70 | 1.267 | 2,84 | ||||
| 2026-04-24 | 13F | Innova Wealth Partners | 13.986 | -68,42 | 1.181 | -67,00 | ||||
| 2026-02-13 | 13F | Citigroup Inc | 703.422 | 61,28 | 56.794 | 62,35 | ||||
| 2026-02-13 | 13F/A | Planwiser Financial, Llc | 0 | -100,00 | 0 | |||||
| 2026-02-17 | 13F | Prosperity Consulting Group, LLC | 19.117 | 1.544 | ||||||
| 2026-01-23 | 13F | Assetmark, Inc | 1.082 | 35,76 | 87 | 38,10 | ||||
| 2026-02-13 | 13F | Pinnacle Wealth Planning Services, Inc. | 42 | 3 | ||||||
| 2026-02-13 | 13F | Barclays Plc | Put | 0 | -100,00 | 0 | -100,00 | |||
| 2026-04-09 | 13F | Park Place Capital Corp | 22 | 0,00 | 2 | 0,00 | ||||
| 2026-04-14 | 13F | USA Financial Portformulas Corp | 4.602 | -26,57 | 389 | -23,17 | ||||
| 2026-02-11 | 13F | TCTC Holdings, LLC | 1.550 | 0,00 | 125 | 0,81 | ||||
| 2026-02-06 | 13F | 3EDGE Asset Management, LP | 6.772 | -49,11 | 547 | -48,83 | ||||
| 2026-02-06 | 13F | Covestor Ltd | 151 | -9,04 | 0 | |||||
| 2026-02-06 | 13F | BlueStem Wealth Partners, LLC | 0 | -100,00 | 0 | |||||
| 2026-04-17 | 13F | Cidel Asset Management Inc | 14.480 | -2,30 | 1.223 | 2,17 | ||||
| 2026-02-12 | 13F | Colonial Trust Advisors | 846 | 68 | ||||||
| 2026-02-02 | 13F | Fifth Third Bancorp | 40 | -97,00 | 3 | -97,20 | ||||
| 2026-02-17 | 13F | Cresset Asset Management, LLC | 75.436 | 10,73 | 6.091 | 11,46 | ||||
| 2026-02-17 | 13F | Northern Trust Corp | 37.393 | -3,89 | 3.019 | -3,24 | ||||
| 2026-02-13 | 13F | Squarepoint Ops LLC | Call | 61.100 | 1.597,22 | 4.933 | 1.612,85 | |||
| 2026-02-13 | 13F | Squarepoint Ops LLC | Put | 5.600 | 3,70 | 452 | 4,39 | |||
| 2026-02-11 | 13F | Lyell Wealth Management, Lp | 4.128 | 0,00 | 333 | 0,60 | ||||
| 2026-02-17 | 13F | Laird Norton Trust Company, Llc | 3.857 | 311 | ||||||
| 2026-02-17 | 13F | Capital Fund Management S.a. | Put | 12.600 | -10,64 | 1.017 | -10,00 | |||
| 2026-04-07 | 13F | Sage Capital Advisors,llc | 9.756 | 0,00 | 824 | 4,57 | ||||
| 2026-04-27 | 13F | Y-Intercept (Hong Kong) Ltd | 53.320 | 910,23 | 4.502 | 956,81 | ||||
| 2025-11-14 | 13F | Kingdon Capital Management, L.l.c. | Put | 0 | -100,00 | 0 | ||||
| 2026-02-10 | 13F | Commonwealth Of Pennsylvania Public School Empls Retrmt Sys | 300.000 | 0,00 | 24.222 | 0,66 | ||||
| 2025-11-14 | 13F | EFG Asset Management (Americas) Corp. | 66.638 | -23,15 | 5.345 | -17,77 | ||||
| 2026-04-16 | 13F | Polianta Ltd | 180.400 | -21,39 | 15 | -16,67 | ||||
| 2026-02-03 | 13F | McIlrath & Eck, LLC | 295 | 0,00 | 24 | 0,00 | ||||
| 2026-02-12 | 13F | Sun Life Financial Inc | 76.022 | 28,91 | 6 | 50,00 | ||||
| 2026-02-06 | 13F | Kingdom Financial Group LLC. | 53 | 4 | ||||||
| 2026-04-22 | 13F | Union Bancaire Privee, UBP SA | 33.838 | 0,68 | 2.704 | 1,50 | ||||
| 2026-01-15 | 13F | Allspring Global Investments Holdings, LLC | 2.243 | 0,00 | 182 | 1,68 | ||||
| 2026-04-23 | 13F | Oppenheimer & Co Inc | 9.146 | -7,40 | 772 | -3,14 | ||||
| 2025-11-14 | 13F | Point72 Europe (London) LLP | 10.400 | -95,73 | 834 | -95,43 | ||||
| 2026-02-18 | 13F | Financial Advisory Service, Inc. | 81 | 65,31 | 7 | 100,00 | ||||
| 2026-04-30 | 13F | Stablepoint Partners, LLC | 2.978 | -0,96 | 251 | 3,72 | ||||
| 2026-04-30 | 13F | GFS Advisors, LLC | 10.206 | -96,37 | 478 | -97,89 | ||||
| 2026-01-30 | 13F | Citizens Financial Group Inc/ri | 11.220 | 0,14 | 906 | 0,78 | ||||
| 2026-02-05 | 13F | Center for Financial Planning, Inc. | 65 | 5 | ||||||
| 2026-04-07 | 13F | Central Pacific Bank - Trust Division | 12.770 | -42,16 | 1.078 | -39,51 | ||||
| 2026-04-13 | 13F | Wolff Wiese Magana Llc | 47 | 0,00 | 4 | 0,00 | ||||
| 2026-01-12 | 13F | AllSquare Wealth Management LLC | 9 | 0,00 | 1 | |||||
| 2026-02-13 | 13F | Squarepoint Ops LLC | 97.854 | 221,67 | 7.901 | 223,77 | ||||
| 2026-02-17 | 13F | Kemnay Advisory Services Inc. | 869.500 | 0,00 | 70.203 | 0,66 | ||||
| 2026-04-28 | 13F | SBI Securities Co., Ltd. | 3.713 | 103,34 | 314 | 112,93 | ||||
| 2026-02-12 | 13F | BlackRock, Inc. | 11.635.978 | -30,12 | 939.489 | -29,66 | ||||
| 2026-02-03 | 13F | Orion Capital Management LLC | 13 | -63,89 | 1 | -50,00 | ||||
| 2026-02-17 | 13F | Quadrature Capital Ltd | 992.110 | 1.593,22 | 80.103 | 1.604,30 | ||||
| 2026-04-21 | 13F | Yoffe Investment Management, LLC | 4.083 | 0,00 | 345 | 4,56 | ||||
| 2026-02-17 | 13F | NorthRock Partners, LLC | 20.749 | 1.675 | ||||||
| 2026-04-08 | 13F | Arlington Trust Co LLC | 300 | 25 | ||||||
| 2026-02-17 | 13F | FIL Ltd | 788.968 | 15,38 | 63.701 | 16,15 | ||||
| 2026-04-17 | 13F | Webster Bank, N. A. | 691 | 219,91 | 58 | 241,18 | ||||
| 2026-02-17 | 13F | Tudor Investment Corp Et Al | 153.799 | 12.418 | ||||||
| 2026-04-08 | 13F | RDA Financial Network | 2.729 | 230 | ||||||
| 2026-01-27 | 13F | Tranquilli Financial Advisor LLC | 4.113 | -0,84 | 332 | 0,00 | ||||
| 2026-04-20 | 13F | Schwab Charitable Fund | 0 | -100,00 | 0 | |||||
| 2026-02-11 | 13F | Cypress Capital Group | 48.195 | -0,59 | 3.891 | 0,08 | ||||
| 2026-04-28 | 13F | WESPAC Advisors, LLC | 5.754 | 86,82 | 486 | 95,56 | ||||
| 2026-02-13 | 13F | 17 Capital Partners, Llc | 2.550 | -1,09 | 206 | -0,49 | ||||
| 2026-04-16 | 13F | Brookstone Capital Management | 10.487 | -7,98 | 886 | -3,80 | ||||
| 2026-04-28 | 13F | South Shore Capital Advisors | 18.013 | 36,29 | 1.521 | 42,55 | ||||
| 2026-04-29 | 13F | Montag A & Associates Inc | 0 | -100,00 | 0 | |||||
| 2026-01-26 | 13F | Consolidated Portfolio Review Corp | 0 | -100,00 | 0 | |||||
| 2026-02-10 | 13F | Advisor Resource Council | 53.584 | -2,10 | 4.326 | -1,46 | ||||
| 2026-02-17 | 13F | Massar Capital Management, LP | 0 | -100,00 | 0 | |||||
| 2026-02-17 | 13F | Black Maple Capital Management LP | 39.159 | 0,00 | 3.162 | 0,67 | ||||
| 2026-04-28 | 13F | Steigerwald, Gordon & Koch Inc. | 63 | 0,00 | 5 | 0,00 | ||||
| 2026-04-29 | 13F | Lmcg Investments, Llc | 74.480 | -11,81 | 6.289 | -7,77 | ||||
| 2026-01-14 | 13F | Clarius Group, LLC | 20.505 | 49,40 | 1.656 | 50,45 | ||||
| 2026-02-13 | 13F | Becker Capital Management Inc | 35.071 | 0,00 | 2.832 | 0,64 | ||||
| 2026-04-28 | 13F | Robertson Stephens Wealth Management, LLC | 7.459 | 9,71 | 630 | 14,57 | ||||
| 2026-02-17 | 13F | Alliancebernstein L.p. | 508.045 | -7,61 | 41.020 | -7,00 | ||||
| 2026-02-17 | 13F | Johns Hopkins University | 146.318 | 0,00 | 11.814 | 0,66 | ||||
| 2026-02-09 | 13F | Roundview Capital LLC | 32.193 | 4,21 | 2.599 | 4,93 | ||||
| 2026-02-17 | 13F | Old Mission Capital Llc | Put | 0 | -100,00 | 0 | ||||
| 2026-01-27 | 13F | Evergreen Capital Management Llc | 58.798 | 7,36 | 4.747 | 8,08 | ||||
| 2026-04-24 | 13F | Keystone Global Partners, LLC | 68.030 | 142,55 | 5.744 | 153,71 | ||||
| 2026-02-17 | 13F | Ancora Advisors, LLC | 1.542 | 116,88 | 125 | 117,54 | ||||
| 2026-02-06 | 13F | Empirical Asset Management, LLC | 5.537 | 1,41 | 447 | 2,29 | ||||
| 2026-02-12 | 13F | Stelac Advisory Services LLC | 47.452 | -9,88 | 3.831 | -9,28 | ||||
| 2026-04-22 | 13F | Onyx Bridge Wealth Group LLC | 21.267 | 1.796 | ||||||
| 2026-02-06 | 13F | HighTower Advisors, LLC | 262.779 | -1,04 | 21.217 | -0,39 | ||||
| 2026-02-11 | 13F | Syon Capital Llc | 57.592 | 1,60 | 4.650 | 2,27 | ||||
| 2026-04-23 | 13F | Rexford Capital Inc | 41 | 3 | ||||||
| 2026-04-29 | 13F | Harbour Capital Advisors, LLC | 3.525 | 0,00 | 309 | 8,04 | ||||
| 2026-04-29 | 13F | CVA Family Office, LLC | 837 | 0,00 | 71 | 4,48 | ||||
| 2026-01-26 | 13F | AE Wealth Management LLC | 1.526 | 10,82 | 123 | 11,82 | ||||
| 2026-02-02 | 13F | Principal Financial Group Inc | 40.576 | 28,08 | 3.276 | 28,98 | ||||
| 2026-02-06 | 13F | GPS Wealth Strategies Group, LLC | 154 | 0,00 | 12 | 0,00 | ||||
| 2026-02-12 | 13F | Moneta Group Investment Advisors Llc | 6.803 | 5,02 | 549 | 5,78 | ||||
| 2026-02-17 | 13F | Mpwm Advisory Solutions, Llc | 0 | -100,00 | 0 | |||||
| 2025-11-06 | 13F | Abich Financial Wealth Management LLC | 216 | -16,60 | 17 | -5,56 | ||||
| 2026-04-13 | 13F | Professional Financial Advisors, LLC | 3.247 | 7,13 | 274 | 12,30 | ||||
| 2026-02-10 | 13F | Goldman Sachs Group Inc | Put | 0 | -100,00 | 0 | ||||
| 2026-02-10 | 13F | Goldman Sachs Group Inc | Call | 0 | -100,00 | 0 | ||||
| 2026-02-12 | 13F | CIBC Private Wealth Group, LLC | 9.890 | 33,32 | 798 | 34,12 | ||||
| 2026-02-17 | 13F | Brevan Howard Capital Management LP | 0 | -100,00 | 0 | -100,00 | ||||
| 2026-02-10 | 13F | CIBC Asset Management Inc | 10.124 | -58,04 | 817 | -57,78 | ||||
| 2026-02-12 | 13F | Brueske Advisory Services, LLC | 0 | -100,00 | 0 | |||||
| 2026-02-05 | 13F | Elyxium Wealth, LLC | 1.549 | 125 | ||||||
| 2026-02-13 | 13F | Resources Investment Advisors, LLC. | 42.474 | 2,85 | 3.429 | 3,53 | ||||
| 2026-01-29 | 13F | Sava Infond d.o.o. | 48.330 | -12,65 | 3.902 | -12,08 | ||||
| 2026-02-10 | 13F | Cherry Tree Wealth Management, LLC | 381 | 0,00 | 31 | 0,00 | ||||
| 2026-04-21 | 13F | Paradigm Financial Partners, Llc | 0 | -100,00 | 0 | |||||
| 2026-04-03 | 13F | Coastline Trust Co | 179.894 | 1,28 | 15.190 | 5,92 | ||||
| 2026-04-22 | 13F | Genesee Capital Advisors, LLC | 14.274 | -1,90 | 1.205 | 2,64 | ||||
| 2026-02-10 | 13F | Marshall & Sterling Wealth Advisors Inc. | 97 | -51,01 | 8 | -53,33 | ||||
| 2026-02-17 | 13F | Sig Brokerage, Lp | 14.750 | -41,00 | 1.191 | -40,65 | ||||
| 2026-02-12 | 13F | Metlife Inc | 10.155 | -1,29 | 825 | -0,12 | ||||
| 2026-02-17 | 13F | Sig Brokerage, Lp | Call | 25.000 | 2.018 | |||||
| 2026-01-29 | 13F | Sanctuary Advisors, LLC | 107.220 | 17,66 | 8.657 | 18,43 | ||||
| 2026-04-24 | 13F | SOL Capital Management CO | 0 | -100,00 | 0 | |||||
| 2026-02-17 | 13F | Quantinno Capital Management LP | 44.607 | -8,72 | 3.602 | -8,11 | ||||
| 2026-04-08 | 13F | Beacon Financial Strategies CORP | 250 | 0,00 | 21 | 5,00 | ||||
| 2026-02-10 | 13F | Waterloo Capital, L.P. | 90.006 | -0,19 | 7.267 | 0,47 | ||||
| 2026-02-12 | 13F | Sprott Inc. | 6.620 | 0,00 | 534 | 0,75 | ||||
| 2026-02-10 | 13F | Private Wealth Asset Management, LLC | 537 | 0,00 | 43 | 0,00 | ||||
| 2026-02-17 | 13F | Susquehanna International Group, Llp | 187.697 | 2.969,95 | 15.155 | 2.992,65 | ||||
| 2026-04-24 | 13F | Keybank National Association/oh | 6.468 | 0,29 | 546 | 5,00 | ||||
| 2026-02-03 | 13F | Legacy Wealth Managment, LLC/ID | 495 | 0,00 | 40 | 0,00 | ||||
| 2026-01-28 | 13F | Salomon & Ludwin, LLC | 26 | 0,00 | 2 | 0,00 | ||||
| 2026-02-17 | 13F | XTX Topco Ltd | 5.701 | 52,31 | 460 | 53,33 | ||||
| 2026-04-23 | 13F | Ameliora Wealth Management Ltd. | 2.100 | 0,00 | 177 | 4,73 | ||||
| 2026-02-11 | 13F | Jpmorgan Chase & Co | 26.089.851 | -0,05 | 2.106.495 | 0,61 | ||||
| 2026-02-13 | 13F | Allianz Se | 1.010 | 0,00 | 82 | 0,00 | ||||
| 2025-11-14 | 13F | BlueCrest Capital Management Ltd | 62.956 | 5.050 | ||||||
| 2026-04-24 | 13F | ProShare Advisors LLC | 46.250 | 0,00 | 3.905 | 4,58 | ||||
| 2026-02-17 | 13F | Evercore Wealth Management, LLC | 2.830 | 0,00 | 228 | 0,88 | ||||
| 2026-04-28 | 13F | Stratos Wealth Advisors, LLC | 0 | -100,00 | 0 | |||||
| 2026-02-20 | 13F | Larch Capital Partners Llc | 50.733 | 4.096 | ||||||
| 2026-04-09 | 13F | Camelot Technology Advisors, Inc. | 14.047 | 0,00 | 1.186 | 4,59 | ||||
| 2026-02-10 | 13F | Portland Global Advisors LLC | 140.228 | -0,05 | 11.322 | 0,62 | ||||
| 2026-02-17 | 13F | Susquehanna International Group, Llp | Put | 773.400 | 853,64 | 62.444 | 859,94 | |||
| 2026-02-17 | 13F | Susquehanna International Group, Llp | Call | 128.200 | -62,69 | 10.351 | -62,45 | |||
| 2026-02-02 | 13F | Verger Capital Management LLC | 9.360 | -71,38 | 756 | -71,22 | ||||
| 2025-11-13 | 13F | Marshall Wace, Llp | 0 | -100,00 | 0 | |||||
| 2026-04-06 | 13F | GAMMA Investing LLC | 709 | 3,81 | 60 | 7,27 | ||||
| 2026-02-17 | 13F | Cetera Investment Advisers | 179.865 | 142,01 | 14.522 | 143,62 | ||||
| 2026-02-13 | 13F | Mml Investors Services, Llc | 304.490 | 472,08 | 24.584 | 475,87 | ||||
| 2026-02-11 | 13F | SOUTH STATE Corp | 127 | 8,55 | 10 | 11,11 | ||||
| 2026-02-17 | 13F | Blair William & Co/il | 57.693 | 9,50 | 4.658 | 10,25 | ||||
| 2026-02-12 | 13F | Brown Brothers Harriman & Co | 3.725 | -8,61 | 301 | -7,98 | ||||
| 2026-02-04 | 13F | Biltmore Family Office, LLC | 2.600 | 8,79 | 210 | 9,42 | ||||
| 2026-04-23 | 13F | iA Global Asset Management Inc. | 20.285 | 97,67 | 2 | |||||
| 2026-01-16 | 13F | Trust Co Of Vermont | 399 | 0,00 | 32 | 0,00 | ||||
| 2026-02-13 | 13F | Kayne Anderson Rudnick Investment Management Llc | 14.075 | -3,33 | 1.134 | -3,57 | ||||
| 2026-02-13 | 13F | Gts Securities Llc | 42.636 | 645,65 | 3.442 | 651,53 | ||||
| 2026-03-12 | 13F/A | Peak6 Llc | Call | 59.200 | 176,64 | 4.780 | 178,50 | |||
| 2026-01-21 | 13F | Newbridge Financial Services Group, Inc. | 79 | 6 | ||||||
| 2026-02-03 | 13F | Ballentine Partners, LLC | 115.690 | -4,00 | 9.341 | -3,36 | ||||
| 2026-02-02 | 13F | Mutual Advisors, LLC | 8.478 | 685 | ||||||
| 2026-01-27 | 13F | Silphium Asset Management Ltd | 79.761 | 111,01 | 6.440 | 112,44 | ||||
| 2026-02-12 | 13F | Cornerstone Capital, Inc. | 19.330 | 0,00 | 1.561 | 0,65 | ||||
| 2026-02-11 | 13F | Parallel Advisors, LLC | 13.850 | 72,41 | 1.118 | 73,60 | ||||
| 2026-04-28 | 13F | Cobblestone Asset Management LLC | 0 | -100,00 | 0 | |||||
| 2026-01-12 | 13F | Abound Wealth Management | 0 | -100,00 | 0 | |||||
| 2026-02-02 | 13F | Cornerstone Planning Group LLC | 46 | 4 | ||||||
| 2026-04-28 | 13F | Whittier Trust Co | 1.719 | 0,00 | 147 | 3,52 | ||||
| 2026-01-20 | 13F | Raab & Moskowitz Asset Management LLC | 18.508 | -4,27 | 1.494 | -3,61 | ||||
| 2026-04-27 | 13F | Osborne Partners Capital Management, Llc | 528.001 | 0,16 | 44.584 | 4,75 | ||||
| 2026-03-26 | 13F | Leonteq Securities AG | Call | 0 | -100,00 | 0 | ||||
| 2026-01-23 | 13F | Rsm Us Wealth Management Llc | 16.850 | -7,05 | 1.365 | -6,19 | ||||
| 2026-04-08 | 13F | Wealth Enhancement Advisory Services, Llc | 38.669 | 7,30 | 3.298 | 10,19 | ||||
| 2026-04-16 | 13F | SG Americas Securities, LLC | 40.769 | -38,86 | 3 | -40,00 | ||||
| 2026-02-04 | 13F | Centric Wealth Management | 2.539 | 0,16 | 218 | 3,32 | ||||
| 2026-02-10 | 13F | Td Asset Management Inc | 2.671.796 | 0,45 | 215.721 | 1,11 | ||||
| 2026-02-11 | 13F | Strategic Financial Partners, Ltd. | 0 | -100,00 | 0 | |||||
| 2026-02-09 | 13F | Smithfield Trust Co | 152 | 0,00 | 0 | |||||
| 2026-02-12 | 13F | Front Row Advisors LLC | 590 | 0,00 | 48 | 0,00 | ||||
| 2026-04-23 | 13F | SMART Wealth LLC | 3.636 | 307 | ||||||
| 2025-11-14 | 13F | Prelude Capital Management, Llc | 0 | -100,00 | 0 | |||||
| 2026-02-12 | 13F | Bank Of Montreal /can/ | 1.798.753 | 25,83 | 145.231 | 26,66 | ||||
| 2025-11-14 | 13F | Cubist Systematic Strategies, LLC | Put | 28.100 | 102,16 | 2.254 | 116,22 | |||
| 2026-02-13 | 13F | Pathstone Holdings, LLC | 86.606 | -5,46 | 6.993 | -4,83 | ||||
| 2025-11-14 | 13F | Cubist Systematic Strategies, LLC | Call | 24.400 | 37,85 | 1.957 | 47,59 | |||
| 2026-01-27 | 13F | Checchi Capital Advisers, LLC | 0 | -100,00 | 0 | |||||
| 2026-04-15 | 13F | Slocum, Gordon & Co LLP | 32.625 | 0,08 | 2.755 | 4,64 | ||||
| 2026-01-23 | 13F | Avion Wealth | 81 | 0,00 | 0 | |||||
| 2026-02-13 | 13F | Seven Mile Advisory | 0 | -100,00 | 0 | |||||
| 2026-02-12 | 13F | Jane Street Group, Llc | Call | 11.400 | -58,09 | 920 | -57,82 | |||
| 2026-04-28 | 13F | Stratos Wealth Partners, LTD. | 6.860 | 579 | ||||||
| 2026-02-12 | 13F | Jane Street Group, Llc | Put | 32.400 | 1,89 | 2.616 | 2,55 | |||
| 2026-04-22 | 13F | Coastal Investment Advisors, Inc. | 0 | -100,00 | 0 | |||||
| 2026-02-09 | 13F | HBK Sorce Advisory LLC | 5.645 | -39,57 | 505 | -33,60 | ||||
| 2026-02-09 | 13F | Delta Asset Management Llc/tn | 500 | 0,00 | 40 | 0,00 | ||||
| 2026-02-04 | 13F | Dynamic Wealth Strategies, LLC | 39.234 | -4,75 | 3.168 | -4,15 | ||||
| 2026-01-30 | 13F | Caldwell Securities, Inc | 20 | 0,00 | 2 | 0,00 | ||||
| 2026-04-16 | 13F | Capital Investment Advisors, LLC | 3.511 | 2,39 | 296 | 7,25 | ||||
| 2026-02-10 | 13F | Quantbot Technologies LP | 6.196 | 500 | ||||||
| 2026-04-28 | 13F | Golden State Equity Partners | 2.589 | 219 | ||||||
| 2026-04-16 | 13F | Clark Asset Management, LLC | 3.787 | -12,46 | 320 | -8,60 | ||||
| 2026-01-09 | 13F | 180 Wealth Advisors, Llc | 3.823 | -12,05 | 309 | -11,49 | ||||
| 2026-04-13 | 13F | Chesley Taft & Associates LLC | 27.212 | -2,70 | 2.298 | 1,73 | ||||
| 2026-04-21 | 13F | Pinnacle Associates Ltd | 2.629 | 222 | ||||||
| 2026-02-23 | 13F | Forthright Family Wealth Advisory LLC | 0 | -100,00 | 0 | |||||
| 2026-02-12 | 13F | Brinker Capital Investments, LLC | 15.042 | 314,04 | 1.215 | 317,18 | ||||
| 2026-02-17 | 13F | Angeles Wealth Management, Llc | 326.745 | 6,17 | 26.381 | 6,87 | ||||
| 2026-04-07 | 13F | CoreCap Advisors, LLC | 55.803 | 119,73 | 4.712 | 129,85 | ||||
| 2026-01-28 | 13F | Dentgroup LLC | 0 | -100,00 | 0 | |||||
| 2026-02-02 | 13F | Horizon Investments, LLC | 285.801 | -8,57 | 23.076 | -7,97 | ||||
| 2026-02-09 | 13F | Jefferies Financial Group Inc. | 21.626 | 14,64 | 1.746 | 15,40 | ||||
| 2026-02-11 | 13F | TruNorth Capital Management, LLC | 0 | -100,00 | 0 | |||||
| 2026-02-13 | 13F | Fiduciary Trust Co | 3.972 | 0,00 | 321 | 0,63 | ||||
| 2026-01-23 | 13F | Ogorek Anthony Joseph /ny/ /adv | 804 | -22,24 | 0 | |||||
| 2026-02-13 | 13F | Evelyn Partners Investment Management (Europe) Ltd | 1.345 | 0,00 | 109 | 0,93 | ||||
| 2026-04-15 | 13F | Register Financial Advisors LLC | 1.281 | 0,00 | 108 | 4,85 | ||||
| 2026-02-12 | 13F | Rossby Financial, LCC | 385 | 3.400,00 | 31 | |||||
| 2026-01-20 | 13F | Harbor Capital Advisors, Inc. | 0 | -100,00 | 0 | |||||
| 2026-02-05 | 13F | Allworth Financial LP | 13.773 | -10,83 | 1.112 | -10,18 | ||||
| 2026-02-17 | 13F | Ameriprise Financial Inc | 944.976 | -8,25 | 76.300 | -7,65 | ||||
| 2026-03-06 | 13F | Hsbc Holdings Plc | 430.518 | -84,96 | 34.760 | -84,98 | ||||
| 2026-02-02 | 13F | Sunesis Advisors, LLC | 2.964 | 0,00 | 239 | 0,84 | ||||
| 2026-02-13 | 13F | Capula Management Ltd | Put | 0 | -100,00 | 0 | ||||
| 2026-02-13 | 13F | Capula Management Ltd | 0 | -100,00 | 0 | |||||
| 2026-04-01 | 13F | GP Brinson Investments LLC | 3.750 | 0,00 | 317 | 4,64 | ||||
| 2026-02-13 | 13F | Capula Management Ltd | Call | 0 | -100,00 | 0 | ||||
| 2026-01-29 | 13F | Ashton Thomas Private Wealth, LLC | 13.158 | 5,64 | 1.062 | 6,41 | ||||
| 2026-02-02 | 13F | Pittenger & Anderson Inc | 68.375 | -13,42 | 5.521 | -12,85 | ||||
| 2026-02-17 | 13F | SageView Advisory Group, LLC | 17.027 | 1.375 | ||||||
| 2026-04-23 | 13F | North Star Investment Management Corp. | 6.807 | -75,13 | 575 | -74,02 | ||||
| 2026-02-13 | 13F | Manufacturers Life Insurance Company, The | 0 | -100,00 | 0 | |||||
| 2026-04-16 | 13F | Evolve Private Wealth, Llc | 9.574 | 808 | ||||||
| 2026-02-11 | 13F | Miller Investment Management, LP | 345.720 | -5,68 | 27.913 | -5,06 | ||||
| 2026-02-04 | 13F | Freedom Day Solutions, LLC | 38.654 | 17,96 | 3.121 | 18,72 | ||||
| 2026-02-12 | 13F | Menora Mivtachim Holdings Ltd. | 7.000 | -56,79 | 565 | -56,51 | ||||
| 2026-04-28 | 13F | Cordoba Advisory Partners LLC | 53.933 | -18,97 | 4.554 | -15,26 | ||||
| 2026-02-05 | 13F | Phoenix Holdings Ltd. | 63.999 | 15,24 | 5.167 | 16,01 | ||||
| 2026-01-27 | 13F | Institute for Wealth Management, LLC. | 17.842 | -1,18 | 1.441 | -0,55 | ||||
| 2026-02-17 | 13F | Millennium Management Llc | 65.561 | 21,90 | 5.293 | 22,72 | ||||
| 2026-04-23 | 13F | Embree Financial Group | 4.044 | 0,00 | 341 | 4,60 | ||||
| 2026-04-30 | 13F | Arista Wealth Management, LLC | 16.541 | 0,00 | 1.397 | 4,57 | ||||
| 2026-04-24 | 13F | National Asset Management, Inc. | 3.862 | 5,92 | 315 | 6,80 | ||||
| 2026-02-09 | 13F | Leavell Investment Management, Inc. | 13.188 | -0,66 | 1.065 | 0,00 | ||||
| 2025-11-14 | 13F | Schonfeld Strategic Advisors LLC | Call | 0 | -100,00 | 0 | ||||
| 2026-02-11 | 13F | Greykasell Wealth Strategies, Inc. | 195 | 16 | ||||||
| 2026-04-09 | 13F | Wedmont Private Capital | 3.151 | 0,00 | 282 | 7,66 | ||||
| 2026-02-13 | 13F | Atlas Capital Advisors Llc | 151 | 12 | ||||||
| 2026-02-17 | 13F | Qube Research & Technologies Ltd | 111.511 | 3.121,00 | 9.003 | 3.150,18 | ||||
| 2026-02-03 | 13F | Mma Asset Management Llc | 0 | -100,00 | 0 | |||||
| 2026-02-09 | 13F | Allstate Corp | 13.400 | 1.082 | ||||||
| 2026-01-30 | 13F | Urban Wealth Management, LLC | 0 | -100,00 | 0 | -100,00 | ||||
| 2026-04-23 | 13F | Dupont Capital Management Corp | 163.117 | 13.774 | ||||||
| 2026-04-27 | 13F | Pensionmark Financial Group, Llc | 34.527 | 30,49 | 2.915 | 36,47 | ||||
| 2026-02-06 | 13F | Cedar Wealth Management, LLC | 26.231 | 0,00 | 2.118 | 0,67 | ||||
| 2026-02-10 | 13F | Fpc Investment Advisory, Inc. | 67.592 | 1,58 | 5.457 | 2,25 | ||||
| 2026-02-17 | 13F | Birnam Oak Advisors, LP | 4.000 | 0,00 | 323 | 0,63 | ||||
| 2026-04-17 | 13F | RFG Advisory, LLC | 2.436 | 206 | ||||||
| 2026-02-17 | 13F | Cooperman Leon G | 14.305 | 0,00 | 1.155 | 0,61 | ||||
| 2026-02-09 | 13F | Hantz Financial Services, Inc. | 329 | 0,00 | 0 | |||||
| 2025-11-04 | 13F | Tsfg, Llc | 0 | -100,00 | 0 | |||||
| 2026-04-14 | 13F | Portfolio Resources Advisor Group, Inc. | 83 | 0,00 | 7 | 16,67 | ||||
| 2026-04-08 | 13F | Asempa Wealth Advisors | 2.904 | -1,96 | 251 | 5,02 | ||||
| 2026-02-06 | 13F | GLOBALT Investments LLC / GA | 9.783 | 0,00 | 790 | 0,64 | ||||
| 2026-02-09 | 13F | Hartland & Co., LLC | 3.553 | 0,00 | 287 | 0,70 | ||||
| 2026-04-20 | 13F | Edge Wealth Management LLC | 4.256 | 0,00 | 359 | 4,66 | ||||
| 2026-02-17 | 13F | Regal Investment Advisors LLC | 8.099 | 654 | ||||||
| 2026-02-13 | 13F | Stifel Financial Corp | 1.256.550 | 3,90 | 101.454 | 4,59 | ||||
| 2026-01-26 | 13F | Asset Dedication, LLC | 34 | 0,00 | 3 | 0,00 | ||||
| 2026-04-27 | 13F | Forte Asset Management Llc | 0 | -100,00 | 0 | |||||
| 2026-02-12 | 13F | Cloud Capital Management, LLC | 0 | -100,00 | 0 | |||||
| 2026-04-23 | 13F | Chelsea Counsel Co | 103 | 0,00 | 8 | 0,00 | ||||
| 2026-02-12 | 13F | Marex Group plc | 83.016 | 98,37 | 6.703 | 99,70 | ||||
| 2026-02-12 | 13F | Steward Partners Investment Advisory, Llc | 191.291 | 379,09 | 15.445 | 382,32 | ||||
| 2026-02-13 | 13F | Quarry LP | 5.000 | 404 | ||||||
| 2026-02-13 | 13F | Banque Transatlantique SA | 801 | 0,00 | 65 | 1,56 | ||||
| 2026-04-20 | 13F | Ronald Blue Trust, Inc. | 373 | 0,00 | 31 | 3,33 | ||||
| 2026-04-20 | 13F | TFB Advisors LLC | 0 | -100,00 | 0 | |||||
| 2026-02-10 | 13F | CIBC World Markets Inc. | 295.843 | 1,89 | 23.886 | 2,56 | ||||
| 2026-02-13 | 13F | Global Endowment Management, LP | 112.581 | 31,41 | 9.091 | 32,31 | ||||
| 2026-04-24 | 13F | APCM Wealth Management for Individuals | 9.933 | -44,32 | 839 | -41,81 | ||||
| 2026-02-05 | 13F | Rahlfs Capital, Llc | 14.760 | 0,00 | 1.192 | 0,68 | ||||
| 2026-04-30 | 13F | Private Trust Co Na | 3.033 | 5,79 | 256 | 10,82 | ||||
| 2026-04-27 | 13F | Mount Yale Investment Advisors, LLC | 61.537 | 18,85 | 5.196 | 24,31 | ||||
| 2026-02-19 | 13F | CI Private Wealth, LLC | 178.089 | 1,29 | 14.388 | 2,01 | ||||
| 2026-04-30 | 13F | Hyposwiss Advisors SA | 42.750 | 0,00 | 3.610 | 4,58 | ||||
| 2026-02-12 | 13F | Tiemann Investment Advisors, Llc | 15.982 | -1,08 | 1.290 | -0,39 | ||||
| 2026-02-12 | 13F | Mark Sheptoff Financial Planning, Llc | 850 | 69 | ||||||
| 2026-02-05 | 13F | Stonebridge Financial Planning Group, LLC | 16.862 | 25,69 | 1.361 | 26,49 | ||||
| 2026-04-17 | 13F | Viewpoint Capital Management LLC | 4.407 | 0,00 | 372 | 4,79 | ||||
| 2026-02-17 | 13F | DZ BANK AG Deutsche Zentral Genossenschafts Bank, Frankfurt am Main | 357.468 | -36,14 | 28.862 | -35,72 | ||||
| 2026-04-30 | 13F | Colton Groome Financial Advisors, Llc | 0 | -100,00 | 0 | |||||
| 2026-02-17 | 13F | Moneda S.A. Administradora General de Fondos | 3.609 | 20,58 | 291 | 16,87 | ||||
| 2025-11-12 | 13F | CIBC Bancorp USA Inc. | 7.418 | 595 | ||||||
| 2026-02-12 | 13F | Castleark Management Llc | 4.930 | 398 | ||||||
| 2026-04-28 | 13F | Angeles Investment Advisors, LLC | 0 | -100,00 | 0 | |||||
| 2026-02-17 | 13F | Summit Trail Advisors, Llc | 25.602 | -15,64 | 2.067 | -15,08 | ||||
| 2026-02-12 | 13F | Wealthspire Advisors, LLC | 2.765 | -11,24 | 223 | -10,44 | ||||
| 2026-02-17 | 13F | Twin Focus Capital Partners, Llc | 58.376 | 295,61 | 4.713 | 298,39 | ||||
| 2026-04-27 | 13F | Cooper Investors Pty Ltd | 71.850 | 6.067 | ||||||
| 2026-04-14 | 13F | Baldwin Brothers Inc/ma | 4.292 | 0,00 | 362 | 4,62 | ||||
| 2026-02-17 | 13F | Point72 Asset Management, L.P. | Call | 25.600 | 2.067 | |||||
| 2026-04-17 | 13F | Murphy & Mullick Capital Management Corp | 165 | 32,00 | 14 | 30,00 | ||||
| 2026-02-17 | 13F | Point72 Asset Management, L.P. | Put | 34.300 | 2.769 | |||||
| 2026-04-14 | 13F | Pictet & Cie (Europe) SA | 3.440 | 0,00 | 290 | 4,69 | ||||
| 2026-02-13 | 13F | Commerce Bank | 3.921 | 33,05 | 317 | 33,90 | ||||
| 2026-02-17 | 13F | Silvercrest Asset Management Group Llc | 385.806 | 0,00 | 31.150 | 0,66 | ||||
| 2026-02-12 | 13F | Jane Street Group, Llc | 0 | -100,00 | 0 | -100,00 | ||||
| 2026-04-20 | 13F | Payne Capital LLC | 3.342 | 282 | ||||||
| 2026-02-17 | 13F | Torno Capital, Llc | 4.000 | 323 | ||||||
| 2026-04-28 | 13F | Bfsg, Llc | 0 | -100,00 | 0 | |||||
| 2026-04-17 | 13F | CENTRAL TRUST Co | 50 | 0,00 | 4 | 0,00 | ||||
| 2026-02-13 | 13F | Vontobel Holding Ltd. | 267.337 | 2,02 | 21.585 | 2,69 | ||||
| 2026-02-12 | 13F | Adviser Investments LLC | 5.201 | -3,58 | 420 | -3,01 | ||||
| 2026-02-13 | 13F | BRITISH COLUMBIA INVESTMENT MANAGEMENT Corp | 841.186 | -28,83 | 67.917 | -28,36 | ||||
| 2025-11-10 | 13F | Trans-Canada Capital Inc. | 0 | -100,00 | 0 | |||||
| 2025-11-12 | 13F | BlackRock, Inc. | Put | 0 | -100,00 | 0 | -100,00 | |||
| 2026-04-14 | 13F | Tradewinds Capital Management, LLC | 287 | -96,27 | 24 | -96,13 | ||||
| 2026-02-13 | 13F | Kestra Advisory Services, LLC | 0 | -100,00 | 0 | |||||
| 2026-02-13 | 13F | Barclays Plc | 9.809 | 63,59 | 792 | 64,79 | ||||
| 2026-02-06 | 13F | Evoke Wealth, Llc | 4.477 | 361 | ||||||
| 2026-04-21 | 13F | E&G Advisors, LP | 21.383 | -0,34 | 1.805 | 4,27 | ||||
| 2026-02-13 | 13F | Barclays Plc | Call | 728.600 | 58.827 | |||||
| 2026-04-20 | 13F | Penobscot Wealth Management | 32.670 | 4,33 | 2.759 | 9,10 | ||||
| 2026-04-10 | 13F | Perigon Wealth Management, LLC | 7.308 | 6,87 | 617 | 11,78 | ||||
| 2025-11-14 | 13F | Guardian Wealth Advisors, Llc / Nc | 0 | -100,00 | 0 | |||||
| 2026-01-26 | 13F | Cwm, Llc | 4.701 | 22,84 | 0 | |||||
| 2026-02-17 | 13F | Parvin Asset Management, LLC | 445 | 36 | ||||||
| 2026-02-17 | 13F | Miller Capital Partners, Inc. | 189 | 15 | ||||||
| 2026-02-17 | 13F | Sona Asset Management (us) Llc | 61.500 | 0,00 | 4.966 | 0,67 | ||||
| 2026-02-13 | 13F | Aptus Capital Advisors, LLC | 1.509 | 46,36 | 122 | 47,56 | ||||
| 2026-02-13 | 13F | LM Advisors LLC | 2.473 | -91,84 | 31 | 1.400,00 | ||||
| 2026-04-13 | 13F | Bank & Trust Co | 236 | 0,00 | 20 | 0,00 | ||||
| 2026-02-04 | 13F | Atlantic Union Bankshares Corp | 136 | 0,00 | 11 | 0,00 | ||||
| 2026-02-13 | 13F | Evelyn Partners Asset Management Ltd | 3.750 | 0,00 | 303 | 0,67 | ||||
| 2026-02-12 | 13F | DRW Securities, LLC | 102.257 | 8.256 | ||||||
| 2026-02-11 | 13F | Lalia Capital, LLC | 120.000 | 9.689 | ||||||
| 2025-11-14 | 13F | Graham Capital Management, L.P. | 0 | -100,00 | 0 | |||||
| 2026-02-17 | 13F | Aspen Grove Capital, LLC | 13.339 | -43,52 | 1.077 | -43,14 | ||||
| 2026-04-10 | 13F | AssuredPartners Investment Advisors, LLC | 6.041 | 517 | ||||||
| 2026-02-13 | 13F | Evernest Financial Advisors, LLC | 29.525 | 19,07 | 2.695 | 35,56 | ||||
| 2026-04-30 | 13F | Vertex Investment Solutions Co., Ltd. | 0 | -100,00 | 0 | |||||
| 2026-02-10 | 13F | Bbr Partners, Llc | 8.204 | -0,39 | 662 | 0,30 | ||||
| 2026-02-12 | 13F | Scotia Capital Inc. | 135.246 | 62,12 | 10.919 | 63,17 | ||||
| 2026-04-15 | 13F | City Holding Co | 0 | -100,00 | 0 | |||||
| 2026-02-11 | 13F | Marvin & Palmer Associates Inc | 26.000 | -7,80 | 2.099 | -10,79 | ||||
| 2026-02-03 | 13F | International Assets Investment Management, Llc | 660 | 53 | ||||||
| 2026-04-24 | 13F | Yousif Capital Management, Llc | 174.754 | -25,32 | 14.756 | -24,68 | ||||
| 2026-04-13 | 13F | Lake Street Financial Llc | 113.613 | 57,39 | 9.593 | 64,60 | ||||
| 2025-11-06 | 13F | Oppenheimer Asset Management Inc. | 0 | -100,00 | 0 | -100,00 | ||||
| 2026-04-08 | 13F | Miracle Mile Advisors, LLC | 8.216 | 6,58 | 694 | 11,41 | ||||
| 2026-02-14 | 13F | Berkshire Asset Management Llc/pa | 5.801 | -6,87 | 468 | -6,21 | ||||
| 2026-02-10 | 13F | Belvedere Trading LLC | 3.230 | 261 | ||||||
| 2025-11-13 | 13F | Glenmede Investment Management, LP | 1.399.685 | -3,63 | 112.269 | 3,11 | ||||
| 2025-11-14 | 13F | Strategic Wealth Designers | 0 | -100,00 | 0 | |||||
| 2026-04-27 | 13F | Bulltick Wealth Management, LLC | 26.132 | 6,13 | 2.207 | 10,97 | ||||
| 2026-02-17 | 13F | GeoWealth Management, LLC | 6.178 | 499 | ||||||
| 2026-04-23 | 13F | SJS Investment Consulting Inc. | 50 | 0,00 | 4 | 0,00 | ||||
| 2026-01-27 | 13F | Proffitt & Goodson Inc | 51 | 0,00 | 4 | 0,00 | ||||
| 2026-02-18 | 13F | Vident Advisory, LLC | 7.084 | -5,32 | 572 | -4,83 | ||||
| 2026-02-13 | 13F | Brown Advisory Inc | 122.189 | 23,84 | 9.866 | 24,65 | ||||
| 2026-04-22 | 13F | Stone House Investment Management, LLC | 105 | 0,00 | 9 | 0,00 | ||||
| 2026-04-29 | 13F | Skopos Labs, Inc. | 8.292 | 0,00 | 700 | 4,17 | ||||
| 2026-02-02 | 13F | Sachetta, LLC | 0 | -100,00 | 0 | |||||
| 2026-02-17 | 13F | Green Harvest Asset Management LLC | 262.608 | 8,12 | 21.203 | 8,83 | ||||
| 2026-04-22 | 13F | Vinland Capital Management Gestora de Recursos LTDA. | 0 | -100,00 | 0 | -100,00 | ||||
| 2025-11-14 | 13F | Peak6 Llc | Put | 0 | -100,00 | 0 | -100,00 | |||
| 2026-01-29 | 13F | Concurrent Investment Advisors, LLC | 6.117 | 9,25 | 494 | 9,80 | ||||
| 2026-02-13 | 13F | Avos Capital Management, LLC | 7.000 | 0,00 | 565 | 0,71 | ||||
| 2026-02-17 | 13F | Zacks Investment Management | 88.899 | 12,42 | 7.178 | 13,15 | ||||
| 2026-01-28 | 13F | Financial Perspectives, Inc | 410 | 0,00 | 33 | 3,13 | ||||
| 2026-02-13 | 13F | Edgestream Partners, L.P. | 8.354 | 19,86 | 675 | 20,57 | ||||
| 2026-01-28 | 13F | CAPROCK Group, Inc. | 44.164 | 6,09 | 3.566 | 9,42 | ||||
| 2026-02-13 | 13F | Baldwin Investment Management, LLC | 7.921 | 0,00 | 640 | 0,63 | ||||
| 2026-02-10 | 13F | Goldman Sachs Group Inc | 6.346.793 | -12,75 | 512.440 | -12,17 | ||||
| 2025-11-14 | 13F | Marex Group plc | Put | 0 | -100,00 | 0 | -100,00 | |||
| 2026-04-17 | 13F | AdvisorNet Financial, Inc | 769 | 0,00 | 65 | 3,23 | ||||
| 2026-02-17 | 13F | Cdkv Holdings Llc | 335 | 27 | ||||||
| 2026-04-15 | 13F | DAVENPORT & Co LLC | 3.019 | 5,97 | 255 | 10,43 | ||||
| 2026-04-23 | 13F | McMillan Office, Inc. | 39 | 0,00 | 3 | 0,00 | ||||
| 2026-04-23 | 13F | Accurate Wealth Management, LLC | 4.176 | 44,85 | 368 | 51,44 | ||||
| 2026-01-30 | 13F | Jackson Hole Capital Partners, LLC | 47 | 0,00 | 4 | 0,00 | ||||
| 2026-04-13 | 13F | Creative Financial Designs Inc /adv | 276 | -36,41 | 23 | -34,29 | ||||
| 2026-02-13 | 13F | Hurley Capital, LLC | 855 | 0,00 | 69 | 1,47 | ||||
| 2026-02-13 | 13F | Glen Eagle Advisors, LLC | 3.541 | 4,98 | 286 | 5,56 | ||||
| 2026-02-05 | 13F | Pacitti Group Inc. | 3.215 | 0,25 | 260 | 0,78 | ||||
| 2026-02-12 | 13F | Colonial Trust Co / SC | 4.702 | -1,88 | 381 | -1,30 | ||||
| 2026-02-10 | 13F | Bank of New York Mellon Corp | 29.876 | -66,01 | 2.412 | -65,78 | ||||
| 2026-02-10 | 13F | Allen Investment Management LLC | 151.441 | 0,00 | 12.227 | 0,66 | ||||
| 2026-02-06 | 13F | Cullen/frost Bankers, Inc. | 54 | 3,85 | 4 | 0,00 | ||||
| 2026-02-12 | 13F | Great Valley Advisor Group, Inc. | 0 | -100,00 | 0 | -100,00 | ||||
| 2026-04-30 | 13F | Mmbg Investment Advisors Co. | 22.007 | 7,87 | 1.858 | 12,81 | ||||
| 2026-04-24 | 13F | Stock Yards Bank & Trust Co | 18.569 | 94,62 | 1.568 | 103,51 | ||||
| 2026-01-21 | 13F | MBL Wealth, LLC | 0 | -100,00 | 0 | |||||
| 2026-02-17 | 13F | Mbb Public Markets I Llc | 0 | -100,00 | 0 | |||||
| 2026-02-05 | 13F | Idaho Trust Bank | 61.055 | -1,39 | 4.930 | -0,75 | ||||
| 2026-02-12 | 13F | Azimuth Capital Investment Management LLC | 125.145 | 1,17 | 10.104 | 1,84 | ||||
| 2026-02-03 | 13F | Navellier & Associates Inc | 16.642 | -15,28 | 1.344 | -14,73 | ||||
| 2026-04-28 | 13F | Indiana Trust & Investment Management CO | 800 | 0,00 | 68 | 4,69 | ||||
| 2026-04-27 | 13F | Albion Financial Group /ut | 114 | 10 | ||||||
| 2025-11-14 | 13F | Wolverine Trading, Llc | Put | 25.400 | 2.045 | |||||
| 2025-11-14 | 13F | Wolverine Trading, Llc | 6.652 | 536 | ||||||
| 2026-04-20 | 13F | Independence Wealth Advisors, LLC | 12.391 | -38,22 | 1.046 | -35,39 | ||||
| 2025-11-14 | 13F | Wolverine Trading, Llc | Call | 116.900 | 9.412 | |||||
| 2026-01-22 | 13F | Brookwood Investment Group LLC | 2.885 | 2,05 | 233 | 2,65 | ||||
| 2026-02-17 | 13F | Lsp Investment Advisors, Llc | 30.000 | 0,00 | 2.422 | 0,67 | ||||
| 2026-02-13 | 13F | Change Path, LLC | 5.232 | 2,69 | 422 | 3,43 | ||||
| 2026-02-13 | 13F | Public Sector Pension Investment Board | 0 | -100,00 | 0 | |||||
| 2026-04-17 | 13F | Trinity Wealth Management, LLC | 43.925 | -1,44 | 3.709 | 3,09 | ||||
| 2025-11-14 | 13F | Jain Global LLC | Call | 0 | -100,00 | 0 | ||||
| 2026-04-07 | 13F | Boltwood Capital Management | 6.475 | 15,11 | 547 | 20,26 | ||||
| 2026-02-05 | 13F | Plante Moran Financial Advisors, LLC | 0 | -100,00 | 0 | |||||
| 2026-02-12 | 13F | Burke & Herbert Bank & Trust Co | 0 | -100,00 | 0 | |||||
| 2026-02-12 | 13F | Bradley Foster & Sargent Inc/ct | 8.639 | 3,60 | 698 | 4,34 | ||||
| 2026-02-12 | 13F | Sumitomo Mitsui Financial Group, Inc. | 0 | -100,00 | 0 | |||||
| 2026-04-22 | 13F | Spire Wealth Management | 9.213 | 0,00 | 778 | 4,58 | ||||
| 2026-04-13 | 13F | IFP Advisors, Inc | 25.459 | 51,10 | 2.150 | 58,01 | ||||
| 2026-04-27 | 13F | Nvwm, Llc | 0 | -100,00 | 0 | |||||
| 2026-01-20 | 13F | SOA Wealth Advisors, LLC. | 425 | 1,43 | 34 | 3,03 | ||||
| 2026-02-12 | 13F | Summit Financial, LLC | 191.156 | -0,57 | 15.434 | 0,08 | ||||
| 2026-02-17 | 13F | Prostatis Group LLC | 47.762 | 10,09 | 3.856 | 10,84 | ||||
| 2026-04-15 | 13F | Trust Co Of Toledo Na /oh/ | 163 | 14 | ||||||
| 2026-02-11 | 13F | Kranot Hishtalmut Le Morim Tichoniim Havera Menahelet LTD | 6.423 | 0,00 | 519 | 0,97 | ||||
| 2026-01-06 | 13F | Tucker Asset Management Llc | 0 | -100,00 | 0 | -100,00 | ||||
| 2026-04-30 | 13F | Red Cedar Investment Management, Llc | 392.224 | 0,00 | 33.119 | 4,58 | ||||
| 2026-02-13 | 13F | Victory Capital Management Inc | 399.820 | -1,05 | 32.281 | -0,40 | ||||
| 2026-02-17 | 13F | Tower Research Capital LLC (TRC) | 2 | -97,47 | 0 | -100,00 | ||||
| 2026-04-30 | 13F | Csenge Advisory Group | 26.322 | 60,11 | 2.223 | 67,45 | ||||
| 2026-02-10 | 13F | Envestnet Asset Management Inc | 6.276.966 | 21,41 | 506.802 | 22,22 | ||||
| 2026-02-13 | 13F | Vivaldi Capital Management, LLC | 9.847 | 9,80 | 795 | 10,57 | ||||
| 2026-04-21 | 13F | Maseco Llp | 265 | 204,60 | 22 | 214,29 | ||||
| 2026-04-09 | 13F | Rockingstone Advisors LLC | 14.020 | -0,03 | 1.184 | 4,51 | ||||
| 2026-02-09 | 13F | IPG Investment Advisors LLC | 57.386 | 726,17 | 4.633 | 731,78 | ||||
| 2026-01-28 | 13F | Geneos Wealth Management Inc. | 358 | 29 | ||||||
| 2026-02-11 | 13F | Meeder Asset Management Inc | 26.822 | 2.166 | ||||||
| 2026-02-03 | 13F | Patten & Patten Inc/tn | 29.131 | 12,56 | 2.352 | 13,35 | ||||
| 2026-02-17 | 13F | Jones Financial Companies Lllp | 47.687 | 26,48 | 3.850 | 26,98 | ||||
| 2026-04-22 | 13F | Coston, McIsaac & Partners | 67 | 0,00 | 0 | |||||
| 2026-02-13 | 13F | Mill Creek Capital Advisors, LLC | 5.164 | 2,66 | 417 | 3,23 | ||||
| 2025-11-07 | 13F | Atticus Wealth Management, Llc | 0 | -100,00 | 0 | |||||
| 2026-02-12 | 13F | ICICI Prudential Asset Management Co Ltd | 82.850 | 0,00 | 6.689 | 0,65 | ||||
| 2026-04-15 | 13F | Exchange Traded Concepts, Llc | 1.050 | -27,49 | 89 | -24,14 | ||||
| 2026-02-11 | 13F | Wealthgarden F.s. Llc | 4.573 | 85,37 | 387 | 87,86 | ||||
| 2026-02-13 | 13F | Arkadios Wealth Advisors | 9.751 | 8,34 | 787 | 9,15 | ||||
| 2026-04-14 | 13F | Prospera Financial Services Inc | 3.064 | 19,73 | 259 | 25,24 | ||||
| 2026-04-17 | 13F | Richards, Merrill & Peterson, Inc. | 0 | -100,00 | 0 | |||||
| 2026-04-15 | 13F | Silverlake Wealth Management Llc | 3.311 | 7,64 | 280 | 12,50 | ||||
| 2026-02-13 | 13F | Morgan Dempsey Capital Management Llc | 480 | 0,00 | 39 | 0,00 | ||||
| 2026-02-10 | 13F | Titan Global Capital Management Usa Llc | 24.587 | -23,18 | 1.985 | -22,64 | ||||
| 2026-02-17 | 13F | RMB Capital Management, LLC | 17.048 | 14,14 | 1.376 | 14,86 | ||||
| 2026-01-23 | 13F | Transcend Wealth Collective, Llc | 2.580 | 208 | ||||||
| 2026-02-17 | 13F | Carret Asset Management, Llc | 3.870 | 4,62 | 312 | 5,41 | ||||
| 2026-04-24 | 13F | Bellevue Asset Management, Llc | 50 | 0,00 | 4 | 0,00 | ||||
| 2026-04-22 | 13F | Tru Independence Asset Management 2, Llc | 13.297 | 1,62 | 1.123 | 6,25 | ||||
| 2026-04-13 | 13F | Fiduciary Financial Group, Llc | 20.222 | -1,04 | 1.708 | 3,52 | ||||
| 2026-01-21 | 13F | Capital Investment Advisory Services, LLC | 954 | 23.750,00 | 77 | |||||
| 2026-02-17 | 13F | Advisory Services Network, LLC | 12.918 | 1,88 | 1.043 | 2,46 | ||||
| 2026-02-11 | 13F | Franklin Resources Inc | 132.651 | 15,54 | 10.710 | 16,31 | ||||
| 2026-04-27 | 13F | Cumberland Advisors Inc | 29.455 | -0,64 | 2.487 | 3,93 | ||||
| 2026-02-17 | 13F | Wiley Bros.-aintree Capital, Llc | 37.117 | 126,05 | 2.997 | 127,49 | ||||
| 2026-02-17 | 13F | Consultiva Wealth Management, Corp. | 138 | 0,00 | 11 | 0,00 | ||||
| 2026-04-29 | 13F | American Capital Advisory, LLC | 438 | 0,00 | 37 | 2,86 | ||||
| 2026-02-05 | 13F | Bank Julius Baer & Co. Ltd, Zurich | 49.437 | -0,03 | 3.992 | 0,63 | ||||
| 2026-02-10 | 13F | Rock Creek Group, LP | 36.880 | 0,00 | 2.978 | 0,64 | ||||
| 2026-02-13 | 13F | OpenArc Corporate Advisory, LLC | 3.154 | 255 | ||||||
| 2026-02-17 | 13F | London & Capital Asset Management Ltd | 7.616 | 615 | ||||||
| 2026-04-23 | 13F | Laurel Wealth Planning LLC | 62.889 | -5,38 | 5.310 | -1,04 | ||||
| 2026-02-12 | 13F | Providence Capital Advisors, LLC | 0 | -100,00 | 0 | |||||
| 2026-04-08 | 13F | JGP Wealth Management, LLC | 15.919 | 4,24 | 1.344 | 9,00 | ||||
| 2026-02-17 | 13F | 1607 Capital Partners, LLC | 0 | -100,00 | 0 | |||||
| 2026-01-22 | 13F | Hager Investment Management Services, Llc | 44 | 0,00 | 4 | 0,00 | ||||
| 2026-02-03 | 13F | We Are One Seven, LLC | 35.723 | 33,23 | 2.884 | 34,14 | ||||
| 2026-02-18 | 13F | GWM Advisors LLC | 0 | -100,00 | 0 | |||||
| 2026-04-10 | 13F | Cerro Pacific Wealth Advisors LLC | 4.044 | 0,00 | 341 | 4,60 | ||||
| 2026-02-12 | 13F | Federation des caisses Desjardins du Quebec | 176.101 | 23,99 | 14.218 | 24,81 | ||||
| 2026-02-06 | 13F | Kimelman & Baird, LLC | 0 | -100,00 | 0 | |||||
| 2026-02-06 | 13F | Redmont Wealth Advisors Llc | 6.287 | 0,00 | 508 | 0,60 | ||||
| 2026-02-02 | 13F | Breakwater Investment Management | 464 | 0,00 | 37 | 0,00 | ||||
| 2026-04-23 | 13F | J.w. Cole Advisors, Inc. | 3.149 | 266 | ||||||
| 2026-04-15 | 13F | Archford Capital Strategies, LLC | 52.963 | 110,55 | 4.472 | 120,19 | ||||
| 2026-04-30 | 13F | Mascoma Wealth Management LLC | 70 | 0,00 | 6 | 0,00 | ||||
| 2026-02-12 | 13F | Circle Wealth Management, LLC | 21.256 | 12,83 | 1.716 | 13,57 | ||||
| 2026-02-12 | 13F | Betterment LLC | 72.085 | 5,91 | 6 | 0,00 | ||||
| 2026-04-27 | 13F | Truist Financial Corp | 123.250 | 0,34 | 10.407 | 4,94 | ||||
| 2026-02-10 | 13F | Performa Ltd (US), LLC | 40.323 | -29,06 | 3.256 | -28,60 | ||||
| 2026-04-24 | 13F | UMA Financial Services, Inc. | 148 | 0,00 | 13 | 9,09 | ||||
| 2026-04-28 | 13F | SeaBridge Investment Advisors LLC | 0 | -100,00 | 0 | |||||
| 2026-02-10 | 13F | Bnp Paribas Arbitrage, Sa | 51.168 | 62,13 | 4.131 | 63,22 | ||||
| 2026-01-16 | 13F | Beaumont Financial Advisors, LLC | 4.793 | -25,16 | 387 | -24,76 | ||||
| 2026-02-04 | 13F | Valeo Financial Advisors, LLC | 2.918 | 0,00 | 236 | 0,43 | ||||
| 2026-02-10 | 13F | Bnp Paribas Arbitrage, Sa | Call | 7.500 | 60.555 | |||||
| 2026-02-18 | 13F | Beacon Pointe Advisors, LLC | 5.057 | 62,08 | 408 | 63,20 | ||||
| 2026-04-29 | 13F/A | Salem Investment Counselors Inc | 7.337 | 0,00 | 620 | 4,56 | ||||
| 2026-02-12 | 13F | Principal Securities, Inc. | 4.352 | 1.896,33 | 351 | 1.964,71 | ||||
| 2026-03-19 | 13F | Painted Porch Advisors LLC | 0 | -100,00 | 0 | |||||
| 2026-04-21 | 13F | GHP Investment Advisors, Inc. | 24 | 2 | ||||||
| 2026-02-17 | 13F | DV Trading LLC | Call | 10.000 | 807 | |||||
| 2026-04-21 | 13F | Abbington Investment Group | 3.607 | 0,00 | 305 | 4,47 | ||||
| 2026-04-16 | 13F | Phillips Financial Management, Llc | 0 | -100,00 | 0 | |||||
| 2026-02-13 | 13F | Ieq Capital, Llc | 7.547 | 133,94 | 609 | 136,05 | ||||
| 2026-03-12 | 13F | Nalls Sherbakoff Group, Llc | 500 | -9,58 | 40 | 14,29 | ||||
| 2026-02-09 | 13F | Keating Financial Advisory Services, Inc. | 25 | 2 | ||||||
| 2026-02-12 | 13F | Barometer Capital Management Inc. | 0 | -100,00 | 0 | |||||
| 2026-02-13 | 13F | Allie Family Office LLC | 3.229 | 0,00 | 261 | 0,78 | ||||
| 2026-02-12 | 13F | Renaissance Technologies Llc | 68.563 | 5.536 | ||||||
| 2026-01-20 | 13F | Wall Street Access Asset Management, LLC | 81 | 0,00 | 7 | 0,00 | ||||
| 2025-11-13 | 13F | Quantitative Investment Management, LLC | 0 | -100,00 | 0 | |||||
| 2026-02-13 | 13F | Flow Traders U.s. Llc | 0 | -100,00 | 0 | |||||
| 2026-02-17 | 13F | Grantham, Mayo, Van Otterloo & Co. LLC | 311.177 | 0,00 | 25.124 | 0,66 | ||||
| 2026-02-12 | 13F | Ci Investments Inc. | 93.140 | 7.520 | ||||||
| 2026-02-18 | 13F | SkyView Investment Advisors, LLC | 63.224 | -0,32 | 5 | 0,00 | ||||
| 2026-02-11 | 13F | Alteri Wealth LLC | 2.861 | 5,53 | 231 | 5,99 | ||||
| 2026-04-24 | 13F | Royal Harbor Partners, LLC | 2.831 | 0,00 | 239 | 4,82 | ||||
| 2026-02-17 | 13F | Hamilton Wealth, LLC | 16.689 | 466,11 | 1.075 | 355,51 |