Grundlæggende statistik
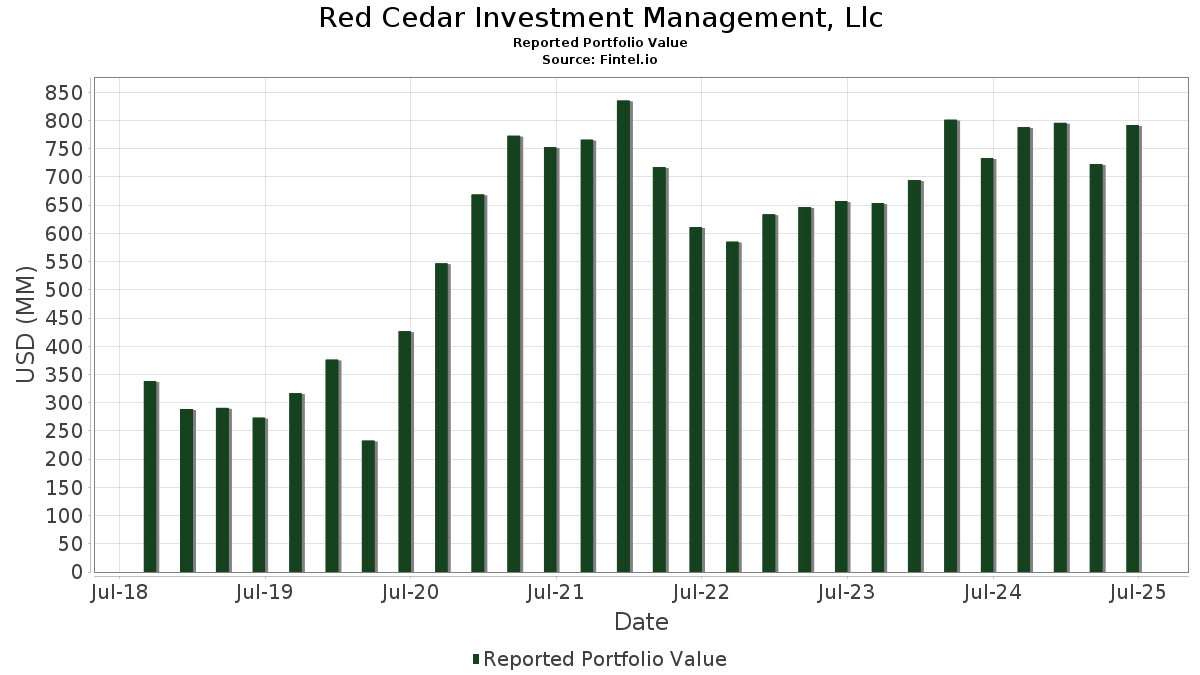
| Porteføljeværdi | $ 792.099.304 |
| Nuværende stillinger | 81 |
Seneste beholdninger, ydeevne, AUM (fra 13F, 13D)
Red Cedar Investment Management, Llc har afsløret 81 samlede besiddelser i deres seneste SEC-arkivering. Den seneste porteføljeværdi er beregnet til at være $ 792.099.304 USD. Faktiske aktiver under forvaltning (AUM) er denne værdi plus kontanter (som ikke er oplyst). Red Cedar Investment Management, Llcs største beholdninger er Vanguard Scottsdale Funds - Vanguard Russell 1000 ETF (US:VONE) , iShares Trust - iShares Russell 1000 ETF (US:IWB) , iShares Trust - iShares Core S&P Mid-Cap ETF (US:IJH) , iShares, Inc. - iShares Core MSCI Emerging Markets ETF (US:IEMG) , and iShares, Inc. - iShares MSCI Japan ETF (US:EWJ) . Red Cedar Investment Management, Llcs nye stillinger omfatter iShares Trust - iShares Core S&P Mid-Cap ETF (US:IJH) , SPDR Gold Trust (US:GLD) , Vanguard Index Funds - Vanguard Mid-Cap ETF (US:VO) , .
Top øger dette kvartal
Vi bruger ændringen i porteføljeallokeringen, fordi dette er den mest meningsfulde metrik. Ændringer kan skyldes handler eller ændringer i aktiekurser.
| Sikkerhed | Aktier (MM) |
Værdi (MM$) |
Portefølje % | ΔPortefølje % |
|---|---|---|---|---|
| 0,82 | 51,03 | 6,4429 | 6,4429 | |
| 0,21 | 20,38 | 2,5735 | 2,0145 | |
| 0,05 | 14,04 | 1,7724 | 1,7724 | |
| 0,01 | 5,39 | 0,6804 | 0,6804 | |
| 0,05 | 14,68 | 1,8530 | 0,5425 | |
| 0,01 | 3,06 | 0,3868 | 0,3868 | |
| 0,10 | 5,50 | 0,6948 | 0,2583 | |
| 0,02 | 11,75 | 1,4836 | 0,2566 | |
| 0,27 | 4,22 | 0,5326 | 0,1369 | |
| 0,02 | 3,47 | 0,4380 | 0,1264 |
Top falder i dette kvartal
Vi bruger ændringen i porteføljeallokeringen, fordi dette er den mest meningsfulde metrik. Ændringer kan skyldes handler eller ændringer i aktiekurser.
| Sikkerhed | Aktier (MM) |
Værdi (MM$) |
Portefølje % | ΔPortefølje % |
|---|---|---|---|---|
| 0,12 | 10,75 | 1,3577 | -4,4842 | |
| 0,05 | 10,65 | 1,3449 | -4,4206 | |
| 0,56 | 157,56 | 19,8918 | -0,7603 | |
| 0,43 | 147,42 | 18,6118 | -0,6479 | |
| 0,45 | 13,60 | 1,7173 | -0,3442 | |
| 0,66 | 16,04 | 2,0255 | -0,1832 | |
| 0,01 | 8,06 | 1,0170 | -0,1638 | |
| 0,03 | 5,05 | 0,6376 | -0,1511 | |
| 0,02 | 6,63 | 0,8374 | -0,1181 | |
| 0,01 | 2,99 | 0,3769 | -0,0912 |
13F og Fondsarkivering
Denne formular blev indsendt den 2025-08-08 for rapporteringsperioden 2025-06-30. Klik på linkikonet for at se den fulde transaktionshistorik.
Opgrader for at låse op for premium-data og eksportere til Excel ![]() .
.
| Sikkerhed | Type | Gennemsnitlig aktiekurs | Aktier (MM) |
Δ Aktier (%) |
Δ Aktier (%) |
Værdi ($MM) |
Portefølje (%) |
ΔPortefølje (%) |
|
|---|---|---|---|---|---|---|---|---|---|
| VONE / Vanguard Scottsdale Funds - Vanguard Russell 1000 ETF | 0,56 | -4,60 | 157,56 | 5,55 | 19,8918 | -0,7603 | |||
| IWB / iShares Trust - iShares Russell 1000 ETF | 0,43 | -4,34 | 147,42 | 5,90 | 18,6118 | -0,6479 | |||
| IJH / iShares Trust - iShares Core S&P Mid-Cap ETF | 0,82 | 51,03 | 6,4429 | 6,4429 | |||||
| IEMG / iShares, Inc. - iShares Core MSCI Emerging Markets ETF | 0,57 | 0,84 | 34,32 | 12,17 | 4,3327 | 0,0997 | |||
| EWJ / iShares, Inc. - iShares MSCI Japan ETF | 0,40 | 0,08 | 30,21 | 9,44 | 3,8133 | -0,0051 | |||
| SCHF / Schwab Strategic Trust - Schwab International Equity ETF | 1,09 | 0,65 | 24,11 | 12,46 | 3,0432 | 0,0777 | |||
| EFA / iShares Trust - iShares MSCI EAFE ETF | 0,26 | 0,56 | 22,86 | 9,99 | 2,8855 | 0,0104 | |||
| AGG / iShares Trust - iShares Core U.S. Aggregate Bond ETF | 0,21 | 403,07 | 20,38 | 404,55 | 2,5735 | 2,0145 | |||
| GDX / VanEck ETF Trust - VanEck Gold Miners ETF | 0,32 | 0,00 | 16,52 | 13,24 | 2,0855 | 0,0674 | |||
| SCHX / Schwab Strategic Trust - Schwab U.S. Large-Cap ETF | 0,66 | -9,21 | 16,04 | 0,49 | 2,0255 | -0,1832 | |||
| AVGO / Broadcom Inc. | 0,05 | -5,88 | 14,68 | 54,95 | 1,8530 | 0,5425 | |||
| GLD / SPDR Gold Trust | 0,05 | 14,04 | 1,7724 | 1,7724 | |||||
| SPSB / SPDR Series Trust - SPDR Portfolio Short Term Corporate Bond ETF | 0,45 | -8,98 | 13,60 | -8,71 | 1,7173 | -0,3442 | |||
| MSFT / Microsoft Corporation | 0,02 | 0,00 | 11,75 | 32,51 | 1,4836 | 0,2566 | |||
| VTWO / Vanguard Scottsdale Funds - Vanguard Russell 2000 ETF | 0,12 | -76,45 | 10,75 | -74,53 | 1,3577 | -4,4842 | |||
| IWM / iShares Trust - iShares Russell 2000 ETF | 0,05 | -76,37 | 10,65 | -74,44 | 1,3449 | -4,4206 | |||
| VOO / Vanguard Index Funds - Vanguard S&P 500 ETF | 0,01 | -5,42 | 8,21 | 4,55 | 1,0365 | -0,0500 | |||
| JPM / JPMorgan Chase & Co. | 0,03 | 0,00 | 8,20 | 18,19 | 1,0354 | 0,0753 | |||
| LLY / Eli Lilly and Company | 0,01 | 0,00 | 8,06 | -5,61 | 1,0170 | -0,1638 | |||
| ETN / Eaton Corporation plc | 0,02 | -10,06 | 7,16 | 18,12 | 0,9044 | 0,0653 | |||
| MSI / Motorola Solutions, Inc. | 0,02 | 0,00 | 6,63 | -3,97 | 0,8374 | -0,1181 | |||
| PH / Parker-Hannifin Corporation | 0,01 | 0,00 | 6,46 | 14,91 | 0,8154 | 0,0378 | |||
| META / Meta Platforms, Inc. | 0,01 | 0,00 | 6,13 | 28,05 | 0,7735 | 0,1116 | |||
| AMP / Ameriprise Financial, Inc. | 0,01 | 0,00 | 5,62 | 10,25 | 0,7090 | 0,0043 | |||
| GLW / Corning Incorporated | 0,10 | 51,83 | 5,50 | 74,42 | 0,6948 | 0,2583 | |||
| SPY / SPDR S&P 500 ETF | 0,01 | 5,39 | 0,6804 | 0,6804 | |||||
| QTPI / Exchange Place Advisors Trust - North Square RCIM Tax-Advantaged Preferred and Income Securities ETF | 0,20 | 0,00 | 5,06 | 1,14 | 0,6390 | -0,0533 | |||
| ABBV / AbbVie Inc. | 0,03 | 0,00 | 5,05 | -11,42 | 0,6376 | -0,1511 | |||
| COST / Costco Wholesale Corporation | 0,00 | 0,00 | 4,39 | 4,68 | 0,5538 | -0,0260 | |||
| HD / The Home Depot, Inc. | 0,01 | 0,00 | 4,26 | 0,05 | 0,5374 | -0,0513 | |||
| KGC / Kinross Gold Corporation | 0,27 | 19,01 | 4,22 | 47,48 | 0,5326 | 0,1369 | |||
| MCD / McDonald's Corporation | 0,01 | 0,00 | 4,15 | -6,47 | 0,5240 | -0,0899 | |||
| SO / The Southern Company | 0,04 | 0,00 | 4,12 | -0,15 | 0,5205 | -0,0506 | |||
| GSG / iShares S&P GSCI Commodity-Indexed Trust | 0,18 | 0,00 | 4,06 | -3,22 | 0,5130 | -0,0678 | |||
| AGI / Alamos Gold Inc. | 0,15 | 43,14 | 4,05 | 42,18 | 0,5111 | 0,1171 | |||
| VTHR / Vanguard Scottsdale Funds - Vanguard Russell 3000 ETF | 0,01 | -9,13 | 3,96 | 0,46 | 0,5001 | -0,0455 | |||
| AEM / Agnico Eagle Mines Limited | 0,03 | 19,05 | 3,75 | 30,58 | 0,4729 | 0,0761 | |||
| BLK / BlackRock, Inc. | 0,00 | 0,00 | 3,70 | 10,85 | 0,4671 | 0,0054 | |||
| QCOM / QUALCOMM Incorporated | 0,02 | 0,00 | 3,68 | 3,66 | 0,4646 | -0,0265 | |||
| RTX / RTX Corporation | 0,02 | 39,75 | 3,47 | 54,04 | 0,4380 | 0,1264 | |||
| V / Visa Inc. | 0,01 | 0,00 | 3,36 | 1,33 | 0,4241 | -0,0346 | |||
| PAYX / Paychex, Inc. | 0,02 | 0,00 | 3,24 | -5,70 | 0,4093 | -0,0664 | |||
| PG / The Procter & Gamble Company | 0,02 | 0,00 | 3,13 | -6,51 | 0,3952 | -0,0681 | |||
| VO / Vanguard Index Funds - Vanguard Mid-Cap ETF | 0,01 | 3,06 | 0,3868 | 0,3868 | |||||
| ADI / Analog Devices, Inc. | 0,01 | -25,24 | 2,99 | -11,79 | 0,3769 | -0,0912 | |||
| MMC / Marsh & McLennan Companies, Inc. | 0,01 | 0,00 | 2,97 | -10,41 | 0,3748 | -0,0836 | |||
| SYK / Stryker Corporation | 0,01 | 0,00 | 2,75 | 6,27 | 0,3467 | -0,0108 | |||
| AAPL / Apple Inc. | 0,01 | 0,00 | 2,45 | -7,67 | 0,3088 | -0,0576 | |||
| AXP / American Express Company | 0,01 | 0,00 | 2,43 | 18,57 | 0,3072 | 0,0232 | |||
| ACN / Accenture plc | 0,01 | 0,00 | 2,35 | -4,24 | 0,2965 | -0,0427 | |||
| WELL / Welltower Inc. | 0,01 | 5,11 | 2,30 | 5,45 | 0,2908 | -0,0113 | |||
| PNC / The PNC Financial Services Group, Inc. | 0,01 | 0,00 | 2,26 | 6,06 | 0,2851 | -0,0095 | |||
| NEE / NextEra Energy, Inc. | 0,03 | 0,00 | 2,18 | -2,07 | 0,2747 | -0,0327 | |||
| WEC / WEC Energy Group, Inc. | 0,02 | 0,00 | 2,09 | -4,40 | 0,2637 | -0,0385 | |||
| TJX / The TJX Companies, Inc. | 0,02 | 56,06 | 2,07 | 58,27 | 0,2610 | 0,0802 | |||
| SPG / Simon Property Group, Inc. | 0,01 | 0,00 | 2,05 | -3,21 | 0,2587 | -0,0342 | |||
| CTAS / Cintas Corporation | 0,01 | 0,00 | 2,03 | 8,43 | 0,2567 | -0,0027 | |||
| MDLZ / Mondelez International, Inc. | 0,03 | 0,00 | 1,91 | -0,62 | 0,2413 | -0,0247 | |||
| MCK / McKesson Corporation | 0,00 | 84,33 | 1,74 | 100,81 | 0,2198 | 0,0998 | |||
| MRK / Merck & Co., Inc. | 0,02 | 0,00 | 1,67 | -11,83 | 0,2108 | -0,0511 | |||
| CVX / Chevron Corporation | 0,01 | 0,00 | 1,62 | -14,39 | 0,2050 | -0,0575 | |||
| EQIX / Equinix, Inc. | 0,00 | 0,00 | 1,55 | -2,46 | 0,1956 | -0,0241 | |||
| LMT / Lockheed Martin Corporation | 0,00 | 0,00 | 1,52 | 3,69 | 0,1914 | -0,0109 | |||
| MAR / Marriott International, Inc. | 0,01 | 0,00 | 1,47 | 14,71 | 0,1852 | 0,0083 | |||
| GD / General Dynamics Corporation | 0,00 | 0,00 | 1,45 | 7,00 | 0,1834 | -0,0044 | |||
| PSX / Phillips 66 | 0,01 | 0,00 | 1,38 | -3,35 | 0,1747 | -0,0234 | |||
| CIWV / Citizens Financial Corp. | 0,03 | 0,00 | 1,37 | 9,17 | 0,1729 | -0,0006 | |||
| XOM / Exxon Mobil Corporation | 0,01 | 0,00 | 1,36 | -9,41 | 0,1714 | -0,0358 | |||
| APD / Air Products and Chemicals, Inc. | 0,00 | 0,00 | 1,25 | -4,37 | 0,1576 | -0,0230 | |||
| MINT / PIMCO ETF Trust - PIMCO Enhanced Short Maturity Active Exchange-Traded Fund | 0,01 | 0,00 | 1,09 | -0,09 | 0,1376 | -0,0133 | |||
| VCSH / Vanguard Scottsdale Funds - Vanguard Short-Term Corporate Bond ETF | 0,01 | 0,00 | 1,07 | 0,76 | 0,1345 | -0,0119 | |||
| IGSB / iShares Trust - iShares 1-5 Year Investment Grade Corporate Bond ETF | 0,02 | 0,00 | 1,05 | 0,77 | 0,1326 | -0,0116 | |||
| VICI / VICI Properties Inc. | 0,03 | 0,00 | 1,03 | 0,00 | 0,1298 | -0,0125 | |||
| DLR / Digital Realty Trust, Inc. | 0,01 | 11,56 | 0,95 | 35,71 | 0,1200 | 0,0231 | |||
| FPE / First Trust Exchange-Traded Fund III - First Trust Preferred Securities and Income ETF | 0,05 | 0,00 | 0,87 | 1,29 | 0,1093 | -0,0091 | |||
| BSV / Vanguard Bond Index Funds - Vanguard Short-Term Bond ETF | 0,01 | 0,00 | 0,83 | 0,61 | 0,1049 | -0,0094 | |||
| VLO / Valero Energy Corporation | 0,01 | 0,00 | 0,77 | 1,73 | 0,0967 | -0,0074 | |||
| PEP / PepsiCo, Inc. | 0,00 | 0,00 | 0,37 | -11,88 | 0,0469 | -0,0115 | |||
| KO / The Coca-Cola Company | 0,00 | 0,00 | 0,34 | -1,17 | 0,0426 | -0,0047 | |||
| FIS / Fidelity National Information Services, Inc. | 0,00 | 0,00 | 0,31 | 8,93 | 0,0385 | -0,0002 | |||
| MPC / Marathon Petroleum Corporation | 0,00 | 0,00 | 0,24 | 14,35 | 0,0302 | 0,0012 | |||
| IWF / iShares Trust - iShares Russell 1000 Growth ETF | 0,00 | -100,00 | 0,00 | 0,0000 | |||||
| URI / United Rentals, Inc. | 0,00 | -100,00 | 0,00 | 0,0000 | |||||
| VTWV / Vanguard Scottsdale Funds - Vanguard Russell 2000 Value ETF | 0,00 | -100,00 | 0,00 | 0,0000 |