Grundlæggende statistik
| Institutionelle ejere | 1405 total, 1330 long only, 5 short only, 70 long/short - change of -21,28% MRQ |
| Gennemsnitlig porteføljeallokering | 0.5491 % - change of -28,41% MRQ |
| Institutionelle aktier (lange) | 259.306.717 (ex 13D/G) - change of -118,36MM shares -31,34% MRQ |
| Institutionel værdi (lang) | $ 36.566.725 USD ($1000) |
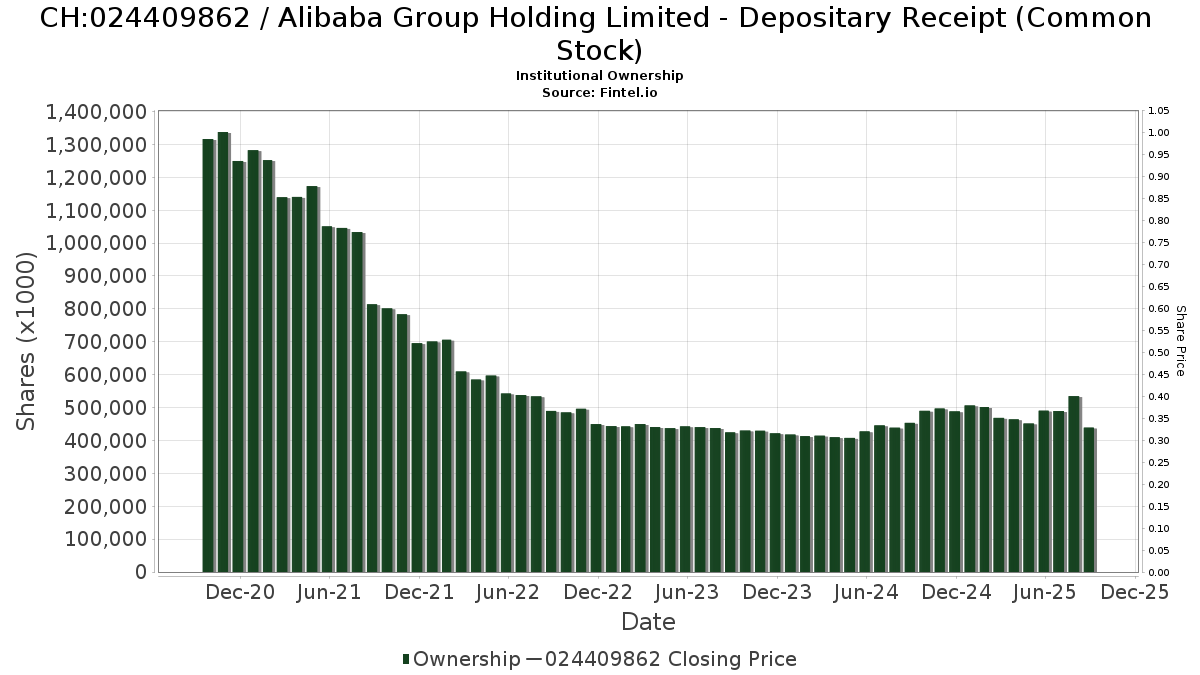
Institutionelt ejerskab og aktionærer
Alibaba Group Holding Limited - Depositary Receipt (Common Stock) (CH:024409862) har 1405 institutionelle ejere og aktionærer, der har indsendt 13D/G- eller 13F-formularer til Securities Exchange Commission (SEC). Disse institutioner har i alt 259,306,717 aktier. Største aktionærer omfatter Jpmorgan Chase & Co, Susquehanna International Group, Llp, Primecap Management Co/ca/, Susquehanna International Group, Llp, Jane Street Group, Llc, UBS Group AG, Jane Street Group, Llc, Fmr Llc, Dodge & Cox, and Citadel Advisors Llc .
Alibaba Group Holding Limited - Depositary Receipt (Common Stock) (BRSE:024409862) institutionel ejerskabsstruktur viser aktuelle positioner i virksomheden efter institutioner og fonde, samt seneste ændringer i positionsstørrelse. Større aktionærer kan omfatte individuelle investorer, investeringsforeninger, hedgefonde eller institutioner. Skema 13D angiver, at investoren besidder (eller besidder) mere end 5 % af virksomheden og har til hensigt (eller har til hensigt at) aktivt at forfølge en ændring i forretningsstrategi. Skema 13G indikerer en passiv investering på over 5%.
Fondens stemningsscore
Fund Sentiment Score (fka Ownership Accumulation Score) finder de aktier, der bliver mest købt af fonde. Det er resultatet af en sofistikeret, multi-faktor kvantitativ model, der identificerer virksomheder med de højeste niveauer af institutionel akkumulering. Scoringsmodellen bruger en kombination af den samlede stigning i oplyste ejere, ændringerne i porteføljeallokeringer i disse ejere og andre målinger. Tallet går fra 0 til 100, hvor højere tal indikerer et højere niveau af akkumulering for sine jævnaldrende, og 50 er gennemsnittet.
Opdateringsfrekvens: Dagligt
Se Ownership Explorer, som giver en liste over højest rangerende virksomheder.
AI+ Ask Fintel’s AI assistant about Alibaba Group Holding Limited - Depositary Receipt (Common Stock).
Select a question to share a public post with an AI-crafted answer.
Thinking of good questions…
13F og NPORT arkivering
Detaljer om 13F-arkivering er gratis. Detaljer om NP-ansøgninger kræver et premium-medlemskab. Grønne rækker angiver nye positioner. Røde rækker angiver lukkede positioner. Klik på linket ikon for at se den fulde transaktionshistorik.
Opgrader
for at låse premium-data op og eksportere til Excel ![]() .
.
Important Note
In an effort to reduce load times for our mobile users, we are testing some ways to deliver lighter pages.
In this first test, we will deliver only the most recent 750 transactions (out of 1951 for this stock). If you are interested in loading *all* the transactions for this company, click the "load all" button below. This is just a test and if you don't like it, please let us know by submitting some gentle feedback via the link at the bottom of this page.
Load All| Fil dato | Kilde | Investor | Type | Gennemsnitlig pris (Øst) |
Aktier | Δ Aktier (%) |
Rapporteret Værdi ($1000) |
Δ Værdi (%) |
Port Alloc (%) |
|
|---|---|---|---|---|---|---|---|---|---|---|
| 2026-02-17 | 13F | Cardiff Park Advisors, Llc | 2.297 | 0,00 | 337 | -18,05 | ||||
| 2026-04-15 | 13F | Cypress Wealth Services, LLC | 0 | -100,00 | 0 | |||||
| 2026-04-15 | 13F | AlphaStar Capital Management, LLC | 6.200 | -36,27 | 778 | -45,47 | ||||
| 2026-02-10 | 13F | Rational Advisors Llc | 2.890 | 424 | ||||||
| 2026-02-17 | 13F | Cape Investment Advisory, Inc. | 2.752 | 498,26 | 403 | 391,46 | ||||
| 2026-04-16 | 13F | Blue Zone Wealth Advisors, LLC | 50.606 | 0,86 | 6.349 | -13,67 | ||||
| 2026-04-14 | 13F | Yarbrough Capital, LLC | 111.581 | 0,00 | 13.999 | -14,41 | ||||
| 2026-02-17 | 13F | Jain Global LLC | Call | 65.500 | 9.601 | |||||
| 2026-02-17 | 13F | Jain Global LLC | Put | 463.000 | 67.867 | |||||
| 2026-02-17 | 13F | Jain Global LLC | 84.688 | 12.414 | ||||||
| 2026-02-13 | 13F | Sei Investments Co | 350.743 | 17,68 | 51.413 | -3,48 | ||||
| 2025-11-06 | 13F | Claudia M.p. Batlle, Crp (r) Llc | 0 | -100,00 | 0 | |||||
| 2026-04-24 | 13F | Mitchell Mcleod Pugh & Williams Inc | 2.908 | 0,48 | 365 | -22,55 | ||||
| 2025-11-13 | 13F | Quinn Opportunity Partners LLC | 0 | -100,00 | 0 | |||||
| 2026-02-13 | 13F | Ausdal Financial Partners, Inc. | 7.392 | 0,09 | 1.083 | -17,89 | ||||
| 2026-02-17 | 13F | Elequin Capital Lp | 1.235 | 181 | ||||||
| 2026-04-23 | 13F | Emerald Advisors, LLC | 1.644 | 206 | ||||||
| 2026-01-30 | 13F | Jennison Associates Llc | 54.235 | 11,88 | 7.950 | -8,24 | ||||
| 2026-02-12 | 13F | Keel Point, LLC | 1.877 | 0,81 | 275 | -17,17 | ||||
| 2026-02-13 | 13F | Umb Bank N A/mo | 2.450 | 0,57 | 359 | -17,47 | ||||
| 2026-02-11 | 13F | IvyRock Asset Management (HK) Ltd | 96.700 | -12,80 | 14.174 | -28,49 | ||||
| 2026-02-17 | 13F | Gladstone Capital Management LLP | 900 | 132 | ||||||
| 2026-01-16 | 13F | Crewe Advisors LLC | 7 | 0,00 | 1 | 0,00 | ||||
| 2026-02-12 | 13F | AI-Squared Management Ltd | 0 | -100,00 | 0 | |||||
| 2026-02-12 | 13F | Adviser Investments LLC | 55.480 | 102,29 | 8.132 | 65,93 | ||||
| 2026-02-04 | 13F | Tsfg, Llc | 135 | -6,90 | 0 | |||||
| 2026-02-12 | 13F | Ankerstar Wealth, LLC | 1.808 | 265 | ||||||
| 2026-01-07 | 13F | Vigilare Wealth Management | 0 | -100,00 | 0 | |||||
| 2026-04-03 | 13F | Investors Research Corp | 3.119 | -2,80 | 391 | -16,81 | ||||
| 2026-02-13 | 13F | Platform Technology Partners | 0 | -100,00 | 0 | |||||
| 2026-02-12 | 13F | Triumph Capital Management | 256 | -40,19 | 38 | -51,32 | ||||
| 2026-04-21 | 13F | Maseco Llp | 0 | -100,00 | 0 | |||||
| 2026-02-13 | 13F | Causeway Capital Management Llc | 1.203.049 | -2,31 | 176.343 | -19,88 | ||||
| 2025-11-14 | 13F | Gluskin Sheff & Assoc Inc | 0 | -100,00 | 0 | -100,00 | ||||
| 2026-02-05 | 13F | Proactive Wealth Strategies LLC | 2.039 | 0,05 | 299 | -18,13 | ||||
| 2026-02-17 | 13F | Credit Agricole S A | 304.227 | 10,75 | 44.594 | -9,18 | ||||
| 2026-01-15 | 13F | Burns Matteson Capital Management, LLC | 1.412 | 207 | ||||||
| 2026-02-17 | 13F | Credit Agricole S A | Put | 50.000 | 7.329 | |||||
| 2025-10-30 | 13F | Traub Capital Management LLC | 0 | -100,00 | 0 | -100,00 | ||||
| 2026-01-13 | 13F | Guerra Pan Advisors, Llc | 4.633 | 0,00 | 679 | -18,00 | ||||
| 2026-02-17 | 13F | Shay Capital LLC | Put | 30.000 | 4.397 | |||||
| 2026-02-11 | 13F | Hughes Financial Services, LLC | 4 | 0,00 | 1 | |||||
| 2026-01-16 | 13F | Genesis Financial Group, LLC | 11.055 | 1.620 | ||||||
| 2026-02-17 | 13F | Ninepoint Partners LP | 27 | 4 | ||||||
| 2026-04-20 | 13F | Sowell Financial Services LLC | 6.892 | -0,75 | 865 | -15,04 | ||||
| 2026-02-03 | 13F | RD Finance Ltd | 24.850 | 4 | ||||||
| 2026-02-13 | 13F | Lord, Abbett & Co. Llc | 0 | -100,00 | 0 | |||||
| 2026-02-10 | 13F | Fideuram Asset Management (Ireland) dac | 7.700 | 1.076 | ||||||
| 2026-02-17 | 13F | Shay Capital LLC | Call | 46.000 | 0,00 | 6.743 | -17,99 | |||
| 2026-02-17 | 13F | Shay Capital LLC | 44.100 | 47,00 | 6.464 | 20,57 | ||||
| 2026-04-22 | 13F | CrossGen Wealth, LLC | 75 | 0,00 | 9 | -10,00 | ||||
| 2026-02-13 | 13F | Bridgefront Capital, LLC | 3.599 | 194,04 | 528 | 141,74 | ||||
| 2026-02-06 | 13F | Mizuho Markets Americas Llc | Put | 54.557 | -41,28 | 3.247 | 17,64 | |||
| 2026-02-11 | 13F | Cookson Peirce & Co Inc | 12.420 | 1.821 | ||||||
| 2026-02-06 | 13F | Mizuho Markets Americas Llc | Call | 54.557 | -41,28 | 19.002 | 131,10 | |||
| 2026-02-13 | 13F | Verition Fund Management LLC | Put | 363.000 | 53.209 | |||||
| 2026-04-22 | 13F | Truefg, Llc | 2.090 | 0,00 | 262 | -14,38 | ||||
| 2026-02-13 | 13F | Verition Fund Management LLC | 342.895 | 50.262 | ||||||
| 2026-04-23 | 13F | CWM Advisors, LLC | 131 | 0,00 | 16 | -15,79 | ||||
| 2026-02-09 | 13F | Hartland & Co., LLC | 2.076 | -34,12 | 304 | -46,00 | ||||
| 2026-02-10 | 13F | Peapack Gladstone Financial Corp | 4.921 | 31,82 | 1 | |||||
| 2026-02-17 | 13F | Ancora Advisors, LLC | 209 | 102,91 | 31 | 66,67 | ||||
| 2026-04-10 | 13F | Country Trust Bank | 49 | 6 | ||||||
| 2026-02-10 | 13F | Godfrey Financial Associates, Inc. | 10 | 1 | ||||||
| 2026-02-17 | 13F | DZ BANK AG Deutsche Zentral Genossenschafts Bank, Frankfurt am Main | 0 | -100,00 | 0 | |||||
| 2026-02-17 | 13F | Steamboat Capital Partners, LLC | 7.912 | 0,20 | 1.160 | -17,86 | ||||
| 2026-02-11 | 13F | Sunrise Financial Services, LLC | 70 | 10 | ||||||
| 2026-02-09 | 13F | William Blair Investment Management, Llc | 11.067 | 1.622 | ||||||
| 2026-04-07 | 13F | Farther Finance Advisors, LLC | 21.203 | 11,03 | 2.624 | -6,29 | ||||
| 2026-02-10 | 13F | Bruce G. Allen Investments, LLC | 289 | -4,30 | 42 | -20,75 | ||||
| 2025-11-03 | 13F | Scion Asset Management, LLC | Call | 0 | -100,00 | 0 | -100,00 | |||
| 2026-02-13 | 13F | Truvestments Capital Llc | 70 | 0,00 | 10 | -16,67 | ||||
| 2026-04-20 | 13F | North of South Capital LLP | 36.054 | -8,49 | 4.523 | -21,67 | ||||
| 2026-02-12 | 13F | Caerus Investment Advisors, LLC | 0 | -100,00 | 0 | |||||
| 2026-02-10 | 13F | Argent Trust Co | 4.533 | -16,44 | 664 | -31,48 | ||||
| 2026-02-12 | 13F | M&G Plc | 228.645 | 8,87 | 33.611 | -10,59 | ||||
| 2026-02-06 | 13F | Vestmark Advisory Solutions, Inc. | 20.775 | 34,29 | 3.045 | 10,13 | ||||
| 2026-02-13 | 13F | Pathstone Holdings, LLC | 33.916 | -4,02 | 4.983 | -20,68 | ||||
| 2026-02-13 | 13F | Icon Wealth Advisors, LLC | 0 | -100,00 | 0 | |||||
| 2026-02-17 | 13F | IHT Wealth Management, LLC | 10.556 | -1,00 | 1.551 | -18,55 | ||||
| 2026-04-23 | 13F | Oppenheimer & Co Inc | 55.176 | -5,38 | 6.922 | -19,01 | ||||
| 2026-02-17 | 13F | Integrated Advisors Network LLC | Call | 29 | 11,54 | |||||
| 2026-01-29 | 13F | Dunhill Financial, LLC | 47 | -85,22 | 10 | -82,14 | ||||
| 2026-02-17 | 13F | Integrated Advisors Network LLC | 7.640 | -0,27 | 1.120 | -18,26 | ||||
| 2026-04-15 | 13F | Hartford Financial Management Inc. | 30 | 0,00 | 4 | -25,00 | ||||
| 2026-02-17 | 13F | Jones Financial Companies Lllp | 55.033 | 55,32 | 8.067 | 32,45 | ||||
| 2026-02-06 | 13F | Cullen/frost Bankers, Inc. | 334 | 153,03 | 49 | 108,70 | ||||
| 2026-02-12 | 13F | Intesa Sanpaolo Wealth Management | 22.683 | 3.325 | ||||||
| 2026-04-22 | 13F | Traphagen Investment Advisors Llc | 3.006 | -0,40 | 377 | -14,71 | ||||
| 2026-04-21 | 13F | Wesbanco Bank Inc | 3.623 | -8,88 | 455 | -21,99 | ||||
| 2026-02-13 | 13F | Cornerstone Financial Management LLC | 73 | 11 | ||||||
| 2026-04-16 | 13F | Davis Capital Management | 24 | 0,00 | 3 | 0,00 | ||||
| 2026-04-20 | 13F | Kercheville Advisors, LLC | 0 | -100,00 | 0 | |||||
| 2026-02-09 | 13F | Arnhold LLC | 150.736 | 0,00 | 22.095 | -17,99 | ||||
| 2026-02-12 | 13F | Xponance, Inc. | 4.937 | 3,22 | 724 | -15,34 | ||||
| 2026-02-05 | 13F | Atria Investments Llc | 39.552 | 18,63 | 5.797 | -2,72 | ||||
| 2026-04-10 | 13F | Henry James International Management Inc. | 28.856 | 0,08 | 3.620 | -14,34 | ||||
| 2026-02-06 | 13F | Mizuho Markets Americas Llc | 54.557 | -41,28 | 7.997 | -51,85 | ||||
| 2026-02-17 | 13F | Clough Capital Partners L P | 0 | -100,00 | 0 | |||||
| 2026-04-16 | 13F | SG Americas Securities, LLC | Put | 288.100 | -58,59 | 2 | ||||
| 2026-04-23 | 13F | Lazari Capital Management, Inc. | 8.183 | -0,90 | 1.027 | -15,21 | ||||
| 2026-02-12 | 13F | Foster Dykema Cabot & Partners, Llc | 0 | -100,00 | 0 | |||||
| 2026-02-09 | 13F | Knights of Columbus Asset Advisors LLC | 2.594 | 0,00 | 380 | -17,93 | ||||
| 2026-02-18 | 13F | Garton & Associates Financial Advisors LLC | 30 | 4 | ||||||
| 2026-02-11 | 13F | LPL Financial LLC | Call | 4.600 | 674 | |||||
| 2026-02-11 | 13F | LPL Financial LLC | Put | 16.500 | 117,11 | 2.419 | 78,06 | |||
| 2026-02-12 | 13F | Keystone Financial Services | 1.445 | -0,82 | 212 | -18,85 | ||||
| 2026-02-11 | 13F | LPL Financial LLC | 635.179 | 1,42 | 93.104 | -16,82 | ||||
| 2026-02-13 | 13F | AlTi Global, Inc. | 12.994 | 16,85 | 1.905 | -4,18 | ||||
| 2026-04-17 | 13F | Webster Bank, N. A. | 1.023 | 0,00 | 128 | -14,09 | ||||
| 2026-04-01 | 13F | Bangor Savings Bank | 0 | -100,00 | 0 | |||||
| 2026-02-11 | 13F | EULAV Asset Management | 43.000 | 22,86 | 6.303 | 0,75 | ||||
| 2026-04-08 | 13F | Hardin Capital Partners, LLC | 6.841 | 2,53 | 858 | -12,18 | ||||
| 2026-01-16 | 13F | Standard Life Aberdeen plc | 34.593 | 45,62 | 5.071 | 18,65 | ||||
| 2026-02-13 | 13F | Bollard Group LLC | 1.937 | 0 | ||||||
| 2026-04-09 | 13F | Wincap Financial Llc | 8.884 | 3,69 | 1.115 | -11,24 | ||||
| 2026-02-17 | 13F | Quantitative Investment Management, LLC | 44.046 | 1.348,88 | 6 | |||||
| 2026-04-21 | 13F | Avaii Wealth Management, Llc | 2.389 | -44,66 | 300 | -52,69 | ||||
| 2026-02-17 | 13F | Maytus Capital Management, LLC | 41.000 | -45,76 | 6.010 | -55,52 | ||||
| 2026-02-11 | 13F | OPTIMAS CAPITAL Ltd | 25.400 | -76,41 | 3.723 | -80,66 | ||||
| 2026-02-13 | 13F | Harber Asset Management Llc | 47.127 | 0,00 | 6.908 | -18,00 | ||||
| 2026-02-10 | 13F | DT Investment Partners, LLC | 75 | 11 | ||||||
| 2026-02-05 | 13F | Center for Financial Planning, Inc. | 192 | 0,00 | 28 | -17,65 | ||||
| 2026-02-14 | 13F | Rockefeller Capital Management L.P. | 650.078 | -9,15 | 95.289 | -25,49 | ||||
| 2026-02-06 | 13F | Lazard Freres Gestion S.A.S. | 1.625 | 0,00 | 0 | |||||
| 2026-01-12 | 13F | Arkfeld Wealth Strategies, L.L.C. | 0 | -100,00 | 0 | -100,00 | ||||
| 2026-02-12 | 13F | BlackRock, Inc. | 3.817.181 | -30,17 | 559.522 | -42,73 | ||||
| 2026-01-30 | 13F | W.G. Shaheen & Associates DBA Whitney & Co | 0 | -100,00 | 0 | |||||
| 2026-04-10 | 13F | Daytona Street Capital LLC | 567 | -17,47 | 70 | -30,00 | ||||
| 2026-02-12 | 13F | Longitude (Cayman) Ltd. | Call | 0 | -100,00 | 0 | ||||
| 2026-04-15 | 13F | Journey Strategic Wealth Llc | 2.668 | 11,45 | 335 | -4,57 | ||||
| 2026-01-28 | 13F | Migdal Insurance & Financial Holdings Ltd. | 288.498 | -0,16 | 42 | -17,65 | ||||
| 2026-02-09 | 13F | Wcm Investment Management, Llc | 55.789 | 80,73 | 8.221 | 48,05 | ||||
| 2026-02-17 | 13F | HighVista Strategies LLC | 0 | -100,00 | 0 | |||||
| 2026-01-20 | 13F | Savvy Advisors, Inc. | 6.430 | 8,05 | 942 | -11,38 | ||||
| 2026-04-20 | 13F | Focused Wealth Management, Inc | 1.761 | -3,88 | 221 | -17,91 | ||||
| 2026-02-09 | 13F | Frazier Financial Advisors, LLC | 0 | -100,00 | 0 | -100,00 | ||||
| 2026-02-13 | 13F | Thornburg Investment Management Inc | 584.028 | 5,54 | 85.607 | -13,45 | ||||
| 2026-04-13 | 13F | Foster Group, Inc. | 1.893 | -10,50 | 237 | -23,55 | ||||
| 2026-02-17 | 13F | Laidlaw Wealth Management LLC | 10.092 | 6,13 | 1.479 | -12,95 | ||||
| 2026-02-12 | 13F | Polen Capital Management Llc | 0 | -100,00 | 0 | |||||
| 2026-02-17 | 13F | Laird Norton Trust Company, Llc | 37.061 | 5.432 | ||||||
| 2026-04-23 | 13F | Orca Wealth Management, LLC | 4.442 | 0,38 | 557 | -23,59 | ||||
| 2026-02-17 | 13F | Bitterroot Capital Advisors Llc | 10 | 1 | ||||||
| 2026-02-13 | 13F | Citigroup Inc | 2.844.328 | 30,44 | 416.922 | 6,98 | ||||
| 2026-02-06 | 13F | Mach-1 Financial Group, Inc. | 0 | -100,00 | 0 | |||||
| 2026-02-13 | 13F | Cladis Investment Advisory, LLC | 0 | -100,00 | 0 | |||||
| 2026-02-17 | 13F | Limestone Investment Advisors LP | 39.405 | 0,00 | 5.776 | -17,99 | ||||
| 2026-02-17 | 13F | Engineers Gate Manager LP | 4.788 | 702 | ||||||
| 2026-02-13 | 13F | Citigroup Inc | Call | 986.300 | 24,80 | 144.572 | 2,35 | |||
| 2026-02-17 | 13F | Limestone Investment Advisors LP | Call | 8.100 | 1.187 | |||||
| 2026-02-13 | 13F | Citigroup Inc | Put | 873.300 | 1,99 | 128.008 | -16,36 | |||
| 2026-02-17 | 13F | Limestone Investment Advisors LP | Put | 11.100 | 1.627 | |||||
| 2026-04-15 | 13F | Daily Journal Corp | 195.000 | 0,00 | 24.465 | -14,41 | ||||
| 2026-01-28 | 13F | One River Asset Management, LLC | Call | 14.000 | 2.061 | |||||
| 2026-04-24 | 13F | Vision Financial Markets Llc | 650 | 0,00 | 82 | -14,74 | ||||
| 2026-02-13 | 13F | Infusive Asset Management Inc. | 46.570 | -24,30 | 6.826 | -37,91 | ||||
| 2026-02-20 | 13F | Sunbelt Securities, Inc. | 7.587 | -4,28 | 1.112 | -21,47 | ||||
| 2026-02-17 | 13F | BTG Pactual Asset Management US LLC | 4.411 | -34,26 | 647 | -46,12 | ||||
| 2026-02-17 | 13F | Mane Global Capital Management Lp | 2.670 | -98,33 | 391 | -98,63 | ||||
| 2026-02-17 | 13F | First Manhattan Co | 2.359 | 7,52 | 346 | -11,99 | ||||
| 2026-01-27 | 13F | Osborne Partners Capital Management, Llc | 107.814 | -3,66 | 15.803 | -20,99 | ||||
| 2026-01-28 | 13F | DekaBank Deutsche Girozentrale | 71.870 | 0,00 | 6 | -53,85 | ||||
| 2026-02-13 | 13F | Sands Capital Management, Llc | 7.511 | 1.101 | ||||||
| 2026-02-17 | 13F | Mangrove Partners | 6.588 | 966 | ||||||
| 2026-01-26 | 13F | Private Trust Co Na | 4.077 | -0,29 | 598 | -18,22 | ||||
| 2026-03-03 | 13F/A | Caitong International Asset Management Co., Ltd | 72 | 11 | ||||||
| 2026-01-12 | 13F | Seacrest Wealth Management, Llc | 0 | -100,00 | 0 | |||||
| 2026-02-12 | 13F | Longitude (Cayman) Ltd. | 5.000 | 733 | ||||||
| 2026-04-07 | 13F | Heartwood Wealth Advisors LLC | 0 | -100,00 | 0 | |||||
| 2026-01-13 | 13F | Stephens Consulting, LLC | 15 | 0,00 | 2 | 0,00 | ||||
| 2026-02-05 | 13F | Eubel Brady & Suttman Asset Management Inc | 2.032 | 0,00 | 0 | |||||
| 2026-02-14 | 13F | Frec Markets, Inc. | 9.304 | 1.364 | ||||||
| 2026-04-17 | 13F | Mainstream Capital Management LLC | 8.597 | 1,09 | 1.079 | -13,48 | ||||
| 2026-04-17 | 13F | Brown, Lisle/cummings, Inc. | 40 | 207,69 | 5 | 400,00 | ||||
| 2026-02-03 | 13F | Maxi Investments CY Ltd | 78.400 | 292,00 | 11 | 266,67 | ||||
| 2026-02-06 | 13F | Griffin Asset Management, Inc. | 0 | -100,00 | 0 | |||||
| 2026-01-29 | 13F | Financial Life Planners | 0 | -100,00 | 0 | |||||
| 2026-02-04 | 13F | Valeo Financial Advisors, LLC | 4.906 | -2,74 | 719 | -20,20 | ||||
| 2025-11-10 | 13F | Dearborn Partners Llc | 0 | -100,00 | 0 | |||||
| 2026-02-17 | 13F | Blair William & Co/il | 130.030 | 47,00 | 19.060 | 20,56 | ||||
| 2026-02-02 | 13F | Avidian Wealth Solutions, LLC | 6.443 | 4,41 | 944 | -14,34 | ||||
| 2026-02-12 | 13F | SWAN Capital LLC | 36 | 0,00 | 5 | -16,67 | ||||
| 2026-02-10 | 13F | Natixis Advisors, L.p. | 199.154 | -19,97 | 29 | -34,09 | ||||
| 2026-01-13 | 13F | Dakota Wealth Management | 0 | -100,00 | 0 | |||||
| 2026-04-13 | 13F | Nvest Wealth Strategies, Inc. | 5 | -66,67 | 1 | -100,00 | ||||
| 2026-02-13 | 13F | Rhumbline Advisers | 7.798 | -14,66 | 1.143 | -30,01 | ||||
| 2026-02-12 | 13F | Insigneo Advisory Services, Llc | 19.124 | -27,27 | 2.803 | -40,35 | ||||
| 2026-02-17 | 13F | Nwi Management Lp | 45.000 | 0,00 | 7 | -25,00 | ||||
| 2026-04-24 | 13F | Triasima Portfolio Management inc. | 0 | -100,00 | 0 | |||||
| 2026-02-13 | 13F | Patient Capital Management, LLC | 0 | -100,00 | 0 | |||||
| 2026-02-13 | 13F | Banco Santander, S.A. | 43.145 | 22,66 | 6.324 | 0,60 | ||||
| 2026-01-22 | 13F | Personal Cfo Solutions, Llc | 2.976 | 94,13 | 436 | 59,12 | ||||
| 2026-04-08 | 13F | Miracle Mile Advisors, LLC | 11.767 | 12,79 | 1.476 | -3,47 | ||||
| 2026-02-13 | 13F | Polymer Capital Management (HK) LTD | 16.103 | -84,94 | 2.360 | -87,65 | ||||
| 2026-04-15 | 13F | Cranbrook Wealth Management, LLC | 10 | 0,00 | 1 | 0,00 | ||||
| 2026-02-02 | 13F | Nkcfo Llc | 13.800 | -33,65 | 2 | -33,33 | ||||
| 2026-02-03 | 13F | Wilson Asset Management (international) Pty Ltd | 63.338 | 20,17 | 9.284 | -1,43 | ||||
| 2026-02-12 | 13F | Barings Llc | 10.195 | 1.494 | ||||||
| 2026-02-17 | 13F | Rwc Asset Advisors (us) Llc | 450.350 | -6,66 | 66.012 | -23,45 | ||||
| 2026-02-02 | 13F | Mutual Advisors, LLC | 4.208 | -34,47 | 617 | -44,15 | ||||
| 2026-02-02 | 13F | Summit Place Financial Advisors, LLC | 2.570 | 0,00 | 377 | -18,08 | ||||
| 2026-02-11 | 13F | West Family Investments, Inc. | 10.267 | -1,67 | 1.505 | -19,40 | ||||
| 2026-02-17 | 13F | SageView Advisory Group, LLC | 2.022 | 46,84 | 296 | 20,33 | ||||
| 2026-01-26 | 13F | KBC Group NV | 25.374 | 1,50 | 4 | -25,00 | ||||
| 2026-02-14 | 13F | Adalta Capital Management LLC | 0 | -100,00 | 0 | |||||
| 2026-04-08 | 13F | Icapital Wealth Llc | 32.490 | -10,30 | 4.076 | -23,22 | ||||
| 2026-02-13 | 13F | Templeton & Phillips Capital Management, LLC | 0 | -100,00 | 0 | |||||
| 2026-02-13 | 13F | Davis Asset Management, L.P. | 500.000 | 0,00 | 73.290 | -17,99 | ||||
| 2026-01-26 | 13F | Quadrant Private Wealth Management, LLC | 11.308 | 1,30 | 1.658 | -16,94 | ||||
| 2026-02-11 | 13F | Holowesko Partners Ltd. | 95.100 | 0,00 | 13.940 | -17,99 | ||||
| 2026-02-09 | 13F | Hantz Financial Services, Inc. | 68.735 | 15,07 | 10 | 0,00 | ||||
| 2026-02-10 | 13F/A | Northwestern Mutual Wealth Management Co | 77.097 | -0,26 | 11.301 | -18,20 | ||||
| 2026-02-13 | 13F | Morgan Stanley | 5.445.261 | 7,97 | 798.167 | -11,45 | ||||
| 2026-04-21 | 13F | Trueblood Wealth Management, LLC | 2.740 | 0,00 | 344 | -14,46 | ||||
| 2026-02-17 | 13F | Ghisallo Capital Management LLC | 100.000 | 0,00 | 14.658 | -17,99 | ||||
| 2026-01-29 | 13F | China Universal Asset Management Co., Ltd. | 22.282 | -27,94 | 3.266 | -40,90 | ||||
| 2026-02-18 | 13F | EP Wealth Advisors, Inc. | 15.457 | 175,18 | 2.266 | 255,57 | ||||
| 2026-02-02 | 13F | Principal Financial Group Inc | 8.734 | -20,78 | 1.280 | -35,03 | ||||
| 2026-02-12 | 13F | Elevated Private Wealth, LLC | 5.718 | 838 | ||||||
| 2026-02-13 | 13F | Y-Intercept (Hong Kong) Ltd | 68.620 | 10.058 | ||||||
| 2026-02-14 | 13F | Triata Capital Ltd | 111.700 | -31,15 | 16.373 | -43,54 | ||||
| 2026-04-24 | 13F | Means Investment Co., Inc. | 15.252 | -0,70 | 1.914 | -15,02 | ||||
| 2026-02-03 | 13F | Koshinski Asset Management, Inc. | 2.200 | 5,87 | 322 | -13,21 | ||||
| 2026-01-27 | 13F | Meritage Portfolio Management | 131.873 | -2,67 | 19.330 | -20,18 | ||||
| 2026-02-13 | 13F | Arrowstreet Capital, Limited Partnership | 106.225 | -49,16 | 15.570 | -58,31 | ||||
| 2026-02-12 | 13F | Callan Family Office, LLC | 17.548 | 313,58 | 2.572 | 239,31 | ||||
| 2026-01-27 | 13F | Zurcher Kantonalbank (Zurich Cantonalbank) | 17.794 | 13,15 | 2.608 | -7,19 | ||||
| 2026-02-03 | 13F | Ballentine Partners, LLC | 15.674 | -1,96 | 2.297 | -19,60 | ||||
| 2026-02-12 | 13F | Penserra Capital Management LLC | 251.478 | 9,14 | 37 | -12,20 | ||||
| 2026-04-16 | 13F | Aegon Asset Management Uk Plc | 10.887 | -28,61 | 1.366 | -38,85 | ||||
| 2026-02-11 | 13F | Investors Towarzystwo Funduszy Inwestycyjnych Spolka Akcyjna | 1.495 | 219 | ||||||
| 2026-02-06 | 13F | GPS Wealth Strategies Group, LLC | 0 | -100,00 | 0 | |||||
| 2026-02-11 | 13F | Cypress Capital Group | 33.781 | -1,42 | 4.952 | -19,15 | ||||
| 2026-04-17 | 13F | Vermillion Wealth Management, Inc. | 57 | 7 | ||||||
| 2026-02-06 | 13F/A | Rathbone Brothers plc | 67.687 | -0,21 | 9.922 | -18,16 | ||||
| 2026-04-22 | 13F | Bravera Wealth | 0 | -100,00 | 0 | |||||
| 2025-11-13 | 13F | Van Hulzen Asset Management, LLC | 0 | -100,00 | 0 | -100,00 | ||||
| 2026-04-15 | 13F | Steadtrust LLC | 5.152 | -5,50 | 646 | -19,15 | ||||
| 2026-01-15 | 13F | Nisa Investment Advisors, Llc | 986 | 3,79 | 145 | -14,79 | ||||
| 2025-11-20 | 13F | Maven Securities LTD | Call | 0 | -100,00 | 0 | ||||
| 2025-11-14 | 13F | Alphadyne Asset Management, LLC | Call | 0 | -100,00 | 0 | -100,00 | |||
| 2026-02-17 | 13F | Fund 1 Investments, LLC | 35.300 | 108,88 | 5.174 | 71,32 | ||||
| 2025-11-12 | 13F | CIBC Bancorp USA Inc. | 399.583 | 71.418 | ||||||
| 2026-04-21 | 13F | PDS Planning, Inc | 7.484 | -6,29 | 939 | -19,83 | ||||
| 2026-01-29 | 13F | Quent Capital, LLC | Call | 200 | 29 | |||||
| 2026-01-29 | 13F | Quent Capital, LLC | 10 | 1 | ||||||
| 2026-02-13 | 13F | Cullen Capital Management, LLC | 42.462 | -7,01 | 6.224 | -23,73 | ||||
| 2026-01-29 | 13F | Nbc Securities, Inc. | Call | 0 | -100,00 | 0 | -100,00 | |||
| 2026-04-06 | 13F | CX Institutional | 1.891 | 10,13 | 0 | |||||
| 2026-02-13 | 13F | Mariner, LLC | 83.657 | 27,17 | 12.266 | 4,33 | ||||
| 2026-02-11 | 13F | Commonwealth Retirement Investments LLC | 94 | 14 | ||||||
| 2026-01-12 | 13F | Perkins Coie Trust Co | 0 | -100,00 | 0 | |||||
| 2026-04-23 | 13F | Game Plan Financial Advisors, LLC | 0 | -100,00 | 0 | |||||
| 2026-04-20 | 13F | Provenance Wealth Advisors, LLC | 221 | 0,00 | 28 | -15,62 | ||||
| 2026-02-09 | 13F | Fidelis Capital Partners, LLC | 6.619 | 3,00 | 970 | -15,51 | ||||
| 2025-11-17 | 13F | LGT Financial Advisors LLC | 0 | -100,00 | 0 | |||||
| 2026-01-28 | 13F | Oversea-Chinese Banking CORP Ltd | 7.927 | 220,80 | 1.177 | 177,59 | ||||
| 2026-02-04 | 13F | Fourth Dimension Wealth, LLC | 200 | 0,00 | 29 | -17,14 | ||||
| 2026-01-28 | 13F | Headland Capital, LLC | 2.500 | 3,99 | 366 | -14,69 | ||||
| 2025-11-14 | 13F | Axiom International Investors Llc /de | 0 | -100,00 | 0 | |||||
| 2026-04-23 | 13F | North Star Investment Management Corp. | 1.388 | -0,43 | 174 | -14,71 | ||||
| 2026-04-23 | 13F | Analyst IMS Investment Management Services Ltd. | 40.305 | 0,00 | 5 | 0,00 | ||||
| 2026-02-09 | 13F | Jefferies Financial Group Inc. | Put | 32.500 | 85,71 | 4.764 | 52,32 | |||
| 2026-01-27 | 13F | Evergreen Capital Management Llc | 65.336 | -1,76 | 9.577 | -19,44 | ||||
| 2026-02-10 | 13F | IFG Advisory, LLC | 0 | -100,00 | 0 | |||||
| 2026-02-17 | 13F | Lighthouse Investment Partners, LLC | 0 | -100,00 | 0 | |||||
| 2026-02-10 | 13F | CIBC World Markets Inc. | 254.414 | 3,59 | 37.292 | -15,04 | ||||
| 2026-02-11 | 13F | Gordian Capital Singapore Pte Ltd | 893 | -89,96 | 131 | -91,82 | ||||
| 2026-02-13 | 13F | PCM Encore, LLC | 9.226 | 1.352 | ||||||
| 2026-02-13 | 13F | Sofos Investments, Inc. | 0 | -100,00 | 0 | |||||
| 2026-04-02 | 13F | Somerset Trust Co | 7.351 | 0,00 | 922 | -14,39 | ||||
| 2026-04-20 | 13F | Naples Global Advisors, Llc | 26.028 | 7,52 | 3.265 | -7,98 | ||||
| 2026-02-17 | 13F | Hilltop Holdings Inc. | 3.613 | -22,98 | 529 | -36,87 | ||||
| 2026-02-26 | 13F | Anchor Investment Management, LLC | 425 | 0,00 | 62 | -17,33 | ||||
| 2026-02-09 | 13F | Jefferies Financial Group Inc. | Call | 25.000 | -79,94 | 3.664 | -83,55 | |||
| 2026-02-09 | 13F | Jefferies Financial Group Inc. | 5.809 | 16,60 | 851 | -4,38 | ||||
| 2026-04-22 | 13F | Bluesphere Advisors, LLC | 2.377 | -10,97 | 298 | -23,79 | ||||
| 2026-02-11 | 13F | Contrarius Group Holdings Ltd | 212.054 | 31.083 | ||||||
| 2026-01-20 | 13F | Ethos Financial Group, LLC | 1.424 | 209 | ||||||
| 2026-02-13 | 13F | Ubs Asset Management Americas Inc | 5.750.996 | -0,20 | 842.981 | -18,15 | ||||
| 2026-01-23 | 13F | Bridgewater Advisors Inc. | 4.535 | -0,04 | 765 | 0,53 | ||||
| 2026-02-13 | 13F | Botty Investors LLC | 17.850 | 0,00 | 2.616 | -17,99 | ||||
| 2026-01-16 | 13F | Trust Co Of Vermont | 15 | 2 | ||||||
| 2026-02-09 | 13F | Kingsview Wealth Management, LLC | 4.732 | -2,39 | 694 | -19,98 | ||||
| 2026-02-13 | 13F | Arete Wealth Advisors, LLC | 6.125 | -3,07 | 1 | -100,00 | ||||
| 2026-02-12 | 13F | Miller Financial Services LLC | 1.350 | 15,58 | 218 | 4,33 | ||||
| 2026-02-11 | 13F | Franklin Resources Inc | 58.365 | -49,62 | 8.555 | -58,68 | ||||
| 2026-04-23 | 13F | Interchange Capital Partners, LLC | Call | 1.500 | 6 | |||||
| 2026-02-17 | 13F | Kerrisdale Advisers, LLC | 1.366 | -26,40 | 200 | -39,58 | ||||
| 2026-04-23 | 13F | Interchange Capital Partners, LLC | 2.702 | -50,47 | 356 | -55,57 | ||||
| 2026-01-28 | 13F | Barrett & Company, Inc. | 100 | 0,00 | 15 | -17,65 | ||||
| 2026-02-03 | 13F | Orion Capital Management LLC | 1.000 | -1,09 | 147 | -18,89 | ||||
| 2026-04-13 | 13F | Loring Wolcott & Coolidge Fiduciary Advisors Llp/ma | 162 | 0,00 | 21 | -25,93 | ||||
| 2026-02-11 | 13F | Vestor Capital, Llc | 269.961 | 205,44 | 0 | -100,00 | ||||
| 2026-04-07 | 13F | Eastern Bank | 6 | -33,33 | 1 | -100,00 | ||||
| 2026-04-08 | 13F | First Heartland Consultants, Inc. | 3.131 | -24,57 | 393 | -35,53 | ||||
| 2026-02-13 | 13F | Chou Associates Management Inc. | 41.900 | 0,00 | 6.142 | -17,99 | ||||
| 2026-01-06 | 13F | Sanctuary Advisors, LLC | Call | 0 | -100,00 | 0 | -100,00 | |||
| 2026-02-23 | 13F | Beaird Harris Wealth Management, LLC | 11 | 0,00 | 2 | 0,00 | ||||
| 2026-02-17 | 13F | Caption Management, LLC | Put | 80.000 | 11.726 | |||||
| 2026-04-14 | 13F | Corecam Pte. Ltd. | 4.600 | 100,00 | 577 | 71,22 | ||||
| 2026-02-03 | 13F | Cheviot Value Management, LLC | 20 | 0,00 | 4 | 0,00 | ||||
| 2026-02-17 | 13F | Sandler Capital Management | 0 | -100,00 | 0 | |||||
| 2026-04-22 | 13F | Union Bancaire Privee, UBP SA | 214.003 | -9,13 | 24.950 | -23,06 | ||||
| 2026-02-17 | 13F | Boreal Capital Management LLC | 80 | 0,00 | 12 | -21,43 | ||||
| 2026-02-04 | 13F | BCJ Capital Management, LLC | 0 | -100,00 | 0 | |||||
| 2026-02-13 | 13F | 1248 Management, LLC | 193 | 0,00 | 28 | -17,65 | ||||
| 2026-02-09 | 13F | Cary Street Partners Financial Llc | 4.725 | -2,32 | 693 | -19,91 | ||||
| 2026-02-17 | 13F | Caption Management, LLC | Call | 120.000 | 60,00 | 17.590 | 31,22 | |||
| 2026-02-17 | 13F | Liontrust Investment Partners LLP | 207.431 | 13,21 | 30.405 | -7,15 | ||||
| 2026-01-21 | 13F | Brown Shipley& Co Ltd | 527 | -18,92 | 77 | -33,62 | ||||
| 2026-01-30 | 13F/A | M&t Bank Corp | 22.164 | 355,96 | 3.249 | 274,19 | ||||
| 2026-02-12 | 13F | Integrated Quantitative Investments LLC | 36.881 | -28,60 | 5.406 | -41,44 | ||||
| 2026-04-20 | 13F | Independent Wealth Network Inc. | 1.939 | -13,51 | 243 | -25,91 | ||||
| 2026-04-10 | 13F | Magnus Financial Group LLC | 11.189 | -1,02 | 1.404 | -15,28 | ||||
| 2026-02-17 | 13F | Amundi | 656.627 | 11,15 | 96.248 | -12,98 | ||||
| 2026-04-20 | 13F | Arta Finance Wealth Management LLC | 3.033 | 8,63 | 381 | -7,09 | ||||
| 2026-04-24 | 13F | Essex Financial Services, Inc. | 19.123 | -0,22 | 2.399 | -14,60 | ||||
| 2026-02-13 | 13F | Financial Sense Advisors, Inc. | 17.276 | 185,74 | 2.532 | 134,44 | ||||
| 2026-02-13 | 13F | Beacon Financial Advisory LLC | 5.087 | -6,52 | 746 | -23,35 | ||||
| 2026-02-13 | 13F | Forest Avenue Capital Management LP | 0 | -100,00 | 0 | |||||
| 2026-02-20 | 13F | White Knight Strategic Wealth Advisors, LLC | 0 | -100,00 | 0 | |||||
| 2026-01-20 | 13F | Hanson & Doremus Investment Management | 0 | -100,00 | 0 | |||||
| 2026-04-08 | 13F | Heritage Family Offices, LLP | 0 | -100,00 | 0 | |||||
| 2026-01-22 | 13F | Massachusetts Financial Services Co /ma/ | 193.982 | -4,82 | 28.434 | -21,94 | ||||
| 2026-04-17 | 13F | Essex Savings Bank | 0 | -100,00 | 0 | |||||
| 2026-02-18 | 13F/A | Empowered Funds, LLC | 16.728 | -44,25 | 2.452 | -54,29 | ||||
| 2026-04-17 | 13F | Bellecapital International Ltd. | 2.285 | 0,00 | 287 | -14,37 | ||||
| 2026-02-06 | 13F | Saranac Partners Ltd | 0 | -100,00 | 0 | -100,00 | ||||
| 2026-04-24 | 13F | CHICAGO TRUST Co NA | 0 | -100,00 | 0 | |||||
| 2026-02-13 | 13F | Missouri Trust & Investment Co | 13.950 | 9,41 | 2.045 | -10,27 | ||||
| 2026-02-13 | 13F | Diametric Capital, LP | 0 | -100,00 | 0 | |||||
| 2026-01-16 | 13F | Marino, Stram & Associates Llc | 3.494 | 0,00 | 512 | -17,95 | ||||
| 2026-02-10 | 13F | Bnp Paribas Arbitrage, Sa | 1.151.403 | -25,35 | 168.773 | -38,77 | ||||
| 2026-02-17 | 13F | Modern Wealth Management, LLC | 0 | -100,00 | 0 | |||||
| 2026-02-10 | 13F | Bnp Paribas Arbitrage, Sa | Put | 3.611 | -57,88 | 52.930 | -65,46 | |||
| 2026-02-17 | 13F | Eddie Patel Inc | 1.619 | 237 | ||||||
| 2026-02-10 | 13F | Bnp Paribas Arbitrage, Sa | Call | 17.102 | 111,84 | 250.681 | 73,74 | |||
| 2026-02-17 | 13F | Moore Capital Management, Lp | 18.006 | 2.639 | ||||||
| 2026-02-17 | 13F | Fountainhead AM, LLC | 88 | 13 | ||||||
| 2026-04-07 | 13F | O'Keefe Stevens Advisory, Inc. | 2.880 | -96,58 | 361 | -97,08 | ||||
| 2026-02-20 | 13F | Kovitz Investment Group Partners, LLC | 4.108 | -27,88 | 602 | -40,86 | ||||
| 2026-01-28 | 13F | Momentum Wealth Planning, LLC | 0 | -100,00 | 0 | -100,00 | ||||
| 2026-02-17 | 13F | Eminence Capital, Lp | 825.761 | -4,60 | 121.040 | -21,76 | ||||
| 2026-02-12 | 13F | StoneX Group Inc. | 6.243 | 926 | ||||||
| 2026-04-21 | 13F | Vanguard Capital Wealth Advisors This fund is a listed as child fund of Vanguard Group Inc and if that institution has disclosed ownership in this security, then these positions will not be double counted when calculating total shares and total value | 2.200 | 0,00 | 276 | -14,29 | ||||
| 2026-02-17 | 13F | Public Employees Retirement System Of Ohio | 158.635 | 0,45 | 23.253 | -17,62 | ||||
| 2026-02-12 | 13F | Brinker Capital Investments, LLC | 42.962 | 8,43 | 6.297 | -11,07 | ||||
| 2026-02-17 | 13F | Third Point LLC | 825.000 | 120.928 | ||||||
| 2026-02-18 | 13F | Caitlin John, LLC | 10 | 0,00 | 1 | 0,00 | ||||
| 2026-01-29 | 13F | Calamos Advisors LLC | 58.704 | 15,55 | 8.605 | -5,23 | ||||
| 2026-02-11 | 13F | Deutsche Bank Ag\ | 129.736 | 138,31 | 19.017 | 95,44 | ||||
| 2026-02-12 | 13F | Xxi Wealth, Llc | 4.645 | 681 | ||||||
| 2025-11-14 | 13F | Sompo Japan Nipponkoa Asset Management Co.,ltd. | 0 | -100,00 | 0 | |||||
| 2026-02-13 | 13F | Squarepoint Ops LLC | 323.260 | -45,39 | 47.383 | -55,21 | ||||
| 2026-02-10 | 13F | Hazlett, Burt & Watson, Inc. | 251 | 6,36 | 0 | |||||
| 2026-04-21 | 13F | Wedbush Securities Inc | 16.200 | -4,35 | 2 | 0,00 | ||||
| 2026-01-14 | 13F | ORG Wealth Partners, LLC | 11.164 | 0,25 | 1.636 | -17,79 | ||||
| 2026-02-13 | 13F | Wells Fargo & Company/mn | Put | 105.000 | -66,67 | 15.391 | -72,66 | |||
| 2026-02-13 | 13F | Squarepoint Ops LLC | Call | 593.400 | 94,88 | 86.981 | 59,82 | |||
| 2026-02-17 | 13F | Maniro Ltd | 35.739 | 5.239 | ||||||
| 2026-02-13 | 13F | Squarepoint Ops LLC | Put | 1.500.000 | -14,18 | 219.870 | -29,62 | |||
| 2026-01-21 | 13F | Prime Capital Investment Advisors, LLC | 27.562 | 17,15 | 4.040 | -3,92 | ||||
| 2026-02-13 | 13F | Wells Fargo & Company/mn | Call | 250.000 | 23,27 | 36.645 | 1,10 | |||
| 2026-02-13 | 13F | Wells Fargo & Company/mn | 1.900.503 | -21,19 | 278.576 | -35,36 | ||||
| 2026-01-21 | 13F | Modera Wealth Management, LLC | 0 | -100,00 | 0 | |||||
| 2026-02-13 | 13F | Eschler Asset Management LLP | 0 | -100,00 | 0 | |||||
| 2026-02-13 | 13F | Dodge & Cox | 10.016.870 | -8,73 | 1.468.273 | -25,15 | ||||
| 2026-04-10 | 13F | Abound Wealth Management | 191 | 122,09 | 24 | 91,67 | ||||
| 2026-01-23 | 13F | Factory Mutual Insurance Co | 53.446 | 12,00 | 7.834 | -8,15 | ||||
| 2026-02-17 | 13F | Advisory Services Network, LLC | 19.057 | -4,49 | 2.793 | -21,68 | ||||
| 2026-02-13 | 13F | Atlas Capital Advisors Llc | 609 | 0,00 | 89 | 28,99 | ||||
| 2026-02-13 | 13F | Golden State Wealth Management, LLC | 571 | -53,24 | 84 | -61,93 | ||||
| 2025-11-06 | 13F | Abich Financial Wealth Management LLC | 43 | 8 | ||||||
| 2026-01-16 | 13F | FNY Investment Advisers, LLC | 0 | -100,00 | 0 | -100,00 | ||||
| 2026-01-16 | 13F | FNY Investment Advisers, LLC | Put | 0 | -100,00 | 0 | ||||
| 2026-01-26 | 13F | Cwm, Llc | 12.183 | 20,22 | 2 | 0,00 | ||||
| 2026-04-22 | 13F | Pinnacle Bancorp, Inc. | 327 | -1,51 | 41 | -14,58 | ||||
| 2026-02-11 | 13F | Mirae Asset Securities (usa) Inc. | Put | 175.413 | 250,83 | 25.652 | 187,05 | |||
| 2026-02-13 | 13F | Aptus Capital Advisors, LLC | 2.413 | 17,14 | 354 | -4,08 | ||||
| 2026-04-14 | 13F | Banque de Luxembourg S.A. | 1.019 | 30,98 | 128 | 11,40 | ||||
| 2026-02-11 | 13F | Palladiem, Llc | 255 | 38 | ||||||
| 2026-02-17 | 13F | XTX Topco Ltd | 0 | -100,00 | 0 | |||||
| 2026-02-17 | 13F | Bellevue Group AG | 4.700 | 689 | ||||||
| 2026-04-09 | 13F | Wedmont Private Capital | 2.930 | 2,63 | 367 | -12,20 | ||||
| 2026-02-05 | 13F | Central Asset Investments & Management Holdings (HK) Ltd | 33.409 | 51,80 | 4.897 | 24,51 | ||||
| 2026-02-12 | 13F | Concorde Asset Management, LLC | 6.293 | -0,08 | 922 | -22,52 | ||||
| 2026-04-24 | 13F | UMA Financial Services, Inc. | 312 | 2,63 | 39 | -11,36 | ||||
| 2026-02-11 | 13F | Jessup Wealth Management, Inc | 75.107 | 0,57 | 11.009 | -17,52 | ||||
| 2026-01-23 | 13F | Portman Square Capital LLP | Put | 282.900 | 41.467 | |||||
| 2026-02-17 | 13F | Main Street Financial Solutions, LLC | 0 | -100,00 | 0 | |||||
| 2026-01-29 | 13F | Atlas Legacy Advisors, LLC | 2.229 | -26,82 | 331 | -39,15 | ||||
| 2026-04-06 | 13F | Old Port Advisors | 1.819 | -17,88 | 228 | -29,63 | ||||
| 2026-02-05 | 13F | Cardinal Point Capital Management, ULC | 0 | -100,00 | 0 | |||||
| 2026-02-12 | 13F | JPL Wealth Management, LLC | 0 | -100,00 | 0 | |||||
| 2026-04-15 | 13F | Riversedge Advisors, Llc | 4.374 | 3,92 | 549 | -11,04 | ||||
| 2026-02-11 | 13F | Mirae Asset Securities (usa) Inc. | 175.413 | 249,99 | 25.712 | 187,06 | ||||
| 2026-04-09 | 13F | Meriwether Wealth & Planning, LLC | 1.993 | -0,15 | 250 | -14,38 | ||||
| 2026-02-06 | 13F | Intrust Bank Na | 0 | -100,00 | 0 | |||||
| 2026-01-28 | 13F | Eagle Global Advisors Llc | 37.624 | 7,63 | 5.515 | -11,75 | ||||
| 2025-11-14 | 13F | Summit Partners Public Asset Management, Llc | Call | 0 | -100,00 | 0 | -100,00 | |||
| 2026-01-30 | 13F | Bell & Brown Wealth Advisors, Llc | 37.375 | -4,18 | 5.478 | -21,42 | ||||
| 2026-02-10 | 13F | Acadian Asset Management Llc | 16.600 | -24,58 | 2 | -33,33 | ||||
| 2026-02-13 | 13F | Clear Street Group Inc. | 725.753 | 0,00 | 106.381 | -17,99 | ||||
| 2026-02-10 | 13F | Ritter Daniher Financial Advisory LLC / DE | 233 | 0,00 | 34 | -17,07 | ||||
| 2026-02-11 | 13F | Prestige Wealth Management Group LLC | 10 | 0,00 | 1 | 0,00 | ||||
| 2025-10-31 | 13F | Whittier Trust Co Of Nevada Inc | 0 | -100,00 | 0 | |||||
| 2026-02-12 | 13F | Moneta Group Investment Advisors Llc | 2.412 | 43,83 | 354 | 18,06 | ||||
| 2026-02-18 | 13F | Vident Advisory, LLC | 80.572 | 210,29 | 11.810 | 154,47 | ||||
| 2026-04-10 | 13F | Syquant Capital Sas | 0 | -100,00 | 0 | |||||
| 2026-02-17 | 13F | Discovery Capital Management, Llc / Ct | 0 | -100,00 | 0 | |||||
| 2026-01-23 | 13F | Nbt Bank N A /ny | 147 | -17,88 | 7 | -12,50 | ||||
| 2026-02-12 | 13F | Marex Group plc | 194.435 | 4,53 | 28.500 | -14,27 | ||||
| 2026-02-17 | 13F | Sig Brokerage, Lp | Put | 38.600 | -53,21 | 5.658 | -61,63 | |||
| 2026-02-05 | 13F | High Note Wealth, LLC | 98 | 0,00 | 14 | -17,65 | ||||
| 2026-02-17 | 13F | Sig Brokerage, Lp | Call | 79.700 | 7,85 | 11.682 | -11,55 | |||
| 2026-02-13 | 13F | Flow Traders U.s. Llc | 13.602 | -19,86 | 2 | -66,67 | ||||
| 2026-02-17 | 13F | Sig Brokerage, Lp | 8.047 | -60,45 | 1.180 | -67,57 | ||||
| 2026-02-17 | 13F | Pinnacle Financial Partners, Inc. | 6.557 | 962 | ||||||
| 2026-01-27 | 13F | Fortis Capital Advisors, LLC | 7.640 | -7,48 | 1.120 | -24,14 | ||||
| 2026-01-05 | 13F | Catherine Avery Investment Management LLC | 0 | -100,00 | 0 | -100,00 | ||||
| 2026-02-17 | 13F | Engle Capital Management, L.P. | 0 | -100,00 | 0 | |||||
| 2026-01-21 | 13F | South Shore Capital Advisors | 1.545 | 226 | ||||||
| 2026-02-13 | 13F | Parkside Financial Bank & Trust | 115 | 0,00 | 17 | -20,00 | ||||
| 2026-02-12 | 13F | Bradley Foster & Sargent Inc/ct | 8.523 | 5,46 | 1.249 | -13,50 | ||||
| 2026-01-21 | 13F | Newbridge Financial Services Group, Inc. | 263 | -93,68 | 39 | -94,89 | ||||
| 2026-04-16 | 13F | Intergy Private Wealth, LLC | 1.675 | 2,38 | 210 | -12,13 | ||||
| 2026-02-10 | 13F | Goldman Sachs Group Inc | 7.665.293 | -34,89 | 1.123.579 | -46,60 | ||||
| 2026-04-17 | 13F | RFG Advisory, LLC | 2.971 | -9,25 | 373 | -22,34 | ||||
| 2026-02-10 | 13F | Goldman Sachs Group Inc | Call | 4.243.500 | -4,44 | 622.012 | -21,63 | |||
| 2026-02-10 | 13F | Goldman Sachs Group Inc | Put | 2.811.800 | -43,28 | 412.154 | -53,48 | |||
| 2026-02-12 | 13F | Aviva Plc | 348.228 | -8,92 | 51.043 | -25,30 | ||||
| 2026-02-19 | 13F/A | Headwater Capital Co Ltd | 16.000 | -86,67 | 2.345 | -89,07 | ||||
| 2026-02-13 | 13F | Yakira Capital Management, Inc. | 0 | -100,00 | 0 | |||||
| 2026-02-12 | 13F | Rossby Financial, LCC | 111 | -13,28 | 16 | -30,43 | ||||
| 2026-04-09 | 13F | Chemistry Wealth Management LLC | 14.347 | -1,41 | 1.800 | -15,66 | ||||
| 2026-02-13 | 13F | Wealth Alliance | 8.402 | -4,11 | 1.232 | -21,39 | ||||
| 2025-11-14 | 13F | Parkwood LLC | 0 | -100,00 | 0 | |||||
| 2026-01-29 | 13F | Ariose Capital Management Ltd | 0 | -100,00 | 0 | |||||
| 2026-02-13 | 13F | ShawSpring Partners LLC | 378.155 | 55.430 | ||||||
| 2026-02-04 | 13F | Atlantic Union Bankshares Corp | 757 | -2,57 | 111 | -20,29 | ||||
| 2026-01-15 | 13F | Bernard Wealth Management Corp. | 150 | 0,00 | 22 | -19,23 | ||||
| 2025-11-14 | 13F | Concentric Capital Strategies, LP | 0 | -100,00 | 0 | |||||
| 2026-04-17 | 13F | Bell Investment Advisors, Inc | 116 | 39,76 | 15 | 16,67 | ||||
| 2026-04-23 | 13F | Powell Investment Advisors, LLC | 3.500 | 0,00 | 439 | -14,42 | ||||
| 2026-02-11 | 13F | Simplex Trading, Llc | 228.100 | 66.401,46 | 33.435 | |||||
| 2026-02-11 | 13F | Simplex Trading, Llc | Call | 3.483.000 | -29,56 | 490.947 | 60.064,95 | |||
| 2026-02-17 | 13F | Rings Capital Management LLC | 0 | -100,00 | 0 | |||||
| 2025-11-10 | 13F | Optiver Holding B.V. | Call | 0 | -100,00 | 0 | -100,00 | |||
| 2026-02-11 | 13F | Simplex Trading, Llc | Put | 2.559.200 | -14,50 | 350.048 | 65.451,87 | |||
| 2026-04-23 | 13F | Kohmann Bosshard Financial Services, LLC | 0 | -100,00 | 0 | |||||
| 2026-02-03 | 13F | Alpha Cubed Investments, LLC | 5.667 | 2,61 | 831 | -15,91 | ||||
| 2026-02-13 | 13F | Headlands Technologies LLC | 0 | -100,00 | 0 | |||||
| 2026-01-06 | 13F | Canal Capital Management, LLC | 36.207 | -12,20 | 5.307 | -27,99 | ||||
| 2026-02-17 | 13F | Fwl Investment Management, Llc | 17 | 2 | ||||||
| 2026-04-14 | 13F | Thurston, Springer, Miller, Herd & Titak, Inc. | 52 | 0,00 | 7 | -14,29 | ||||
| 2026-04-13 | 13F | True Wealth Design, LLC | 101 | 12,22 | 13 | -7,69 | ||||
| 2026-02-17 | 13F | J. Goldman & Co LP | 7.000 | 1.026 | ||||||
| 2026-04-15 | 13F | Polunin Capital Partners Ltd | 862.604 | -37,66 | 106 | -53,95 | ||||
| 2026-02-10 | 13F | GKV Capital Management Co., Inc. | 24.650 | 9,65 | 3.613 | -10,06 | ||||
| 2026-02-17 | 13F | J. Goldman & Co LP | Call | 43.000 | 6.303 | |||||
| 2026-02-02 | 13F | JDM Financial Group LLC | 110 | 0,00 | 16 | -15,79 | ||||
| 2026-02-13 | 13F | Gmt Capital Corp | 30.800 | -81,47 | 4.515 | -84,80 | ||||
| 2026-04-13 | 13F | CGC Financial Services, LLC | 25 | 0,00 | 3 | 0,00 | ||||
| 2026-04-17 | 13F | Community Bank & Trust, Waco, Texas | 4.513 | 11,08 | 1 | |||||
| 2026-04-20 | 13F | Ronald Blue Trust, Inc. | 16.457 | 0,57 | 2.065 | -13,93 | ||||
| 2025-10-27 | 13F | Hardman Johnston Global Advisors LLC | 0 | -100,00 | 0 | |||||
| 2026-02-13 | 13F | GM Advisory Group, Inc. | 0 | -100,00 | 0 | |||||
| 2026-01-21 | 13F | Summa Corp. | 4.079 | -87,68 | 598 | -89,91 | ||||
| 2026-02-17 | 13F | Millennium Management Llc | 146.487 | -26,61 | 21.472 | -39,81 | ||||
| 2025-11-04 | 13F | Twenty Acre Capital LP | 0 | -100,00 | 0 | |||||
| 2026-02-17 | 13F | Millennium Management Llc | Call | 2.167.400 | 119,39 | 317.697 | 79,93 | |||
| 2025-11-07 | 13F | Sierra Ocean, Llc | 0 | -100,00 | 0 | |||||
| 2026-02-17 | 13F | Millennium Management Llc | Put | 2.132.400 | 27,32 | 312.567 | 4,41 | |||
| 2026-02-26 | 13F | TD Capital Management LLC | 105 | 0,00 | 15 | -16,67 | ||||
| 2026-04-23 | 13F | Ameliora Wealth Management Ltd. | 0 | -100,00 | 0 | |||||
| 2025-11-12 | 13F | NewSquare Capital LLC | 0 | -100,00 | 0 | |||||
| 2026-02-11 | 13F | Marest Capital, LLC | 0 | -100,00 | 0 | |||||
| 2026-02-10 | 13F | Meitav Dash Investments Ltd | 12.601 | -0,20 | 1.849 | -18,19 | ||||
| 2026-02-12 | 13F | Elo Mutual Pension Insurance Co | 117.748 | 378,09 | 17.260 | 292,16 | ||||
| 2026-02-05 | 13F | IMG Wealth Management, Inc. | 7 | 0,00 | 1 | 0,00 | ||||
| 2026-02-06 | 13F | Cedar Wealth Management, LLC | 57 | 0,00 | 8 | -20,00 | ||||
| 2026-01-15 | 13F | J. Safra Sarasin Holding AG | 6.532 | 66,21 | 957 | 36,32 | ||||
| 2026-02-03 | 13F | Virtus Family Office LLC | 28.081 | -1,29 | 4.116 | -19,04 | ||||
| 2026-04-13 | 13F | Creative Financial Designs Inc /adv | 211 | 0,00 | 26 | -13,33 | ||||
| 2026-02-09 | 13F | Unified Investment Management | 1.728 | 3,29 | 253 | -15,38 | ||||
| 2026-02-03 | 13F | Mma Asset Management Llc | 0 | -100,00 | 0 | |||||
| 2026-01-27 | 13F | TD Waterhouse Canada Inc. | 24.132 | -10,84 | 3.536 | -28,52 | ||||
| 2026-02-11 | 13F | Primecap Management Co/ca/ | 18.977.436 | -5,06 | 2.781.713 | -22,14 | ||||
| 2026-02-17 | 13F | CALIFORNIA FIRST LEASING Corp | 0 | -100,00 | 0 | |||||
| 2025-11-14 | 13F | KEYWISE CAPITAL MANAGEMENT (HK) Ltd | 0 | -100,00 | 0 | -100,00 | ||||
| 2026-02-12 | 13F | Steward Partners Investment Advisory, Llc | 343.098 | -7,77 | 50.291 | -24,36 | ||||
| 2026-01-30 | 13F | Us Bancorp \de\ | 25.885 | -0,72 | 3.795 | -18,58 | ||||
| 2026-02-17 | 13F | BlueCrest Capital Management Ltd | 138.911 | 993,79 | 20.362 | 797,36 | ||||
| 2026-04-22 | 13F | Atlantic Edge Private Wealth Management, LLC | 125 | 0,00 | 16 | -16,67 | ||||
| 2026-02-03 | 13F | Ethic Inc. | 28.392 | 1,24 | 4.162 | -16,98 | ||||
| 2026-02-09 | 13F | HBK Sorce Advisory LLC | 3.929 | 0,95 | 639 | -1,09 | ||||
| 2025-11-17 | 13F | FSA Wealth Management LLC | 64 | 357,14 | 11 | 1.000,00 | ||||
| 2026-02-09 | 13F | Choate Investment Advisors | 2.993 | 18,82 | 439 | -2,67 | ||||
| 2026-02-09 | 13F | Bleakley Financial Group, LLC | 16.420 | 0,41 | 2.407 | -17,66 | ||||
| 2025-11-12 | 13F | Quantbot Technologies LP | 0 | -100,00 | 0 | |||||
| 2025-11-14 | 13F | Intrinsic Value Partners, LLC | 0 | -100,00 | 0 | -100,00 | ||||
| 2026-04-23 | 13F | UG Investment Advisers Ltd. | 148.819 | -89,05 | 18.671 | -90,63 | ||||
| 2026-02-17 | 13F | Edmond De Rothschild Holding S.a. | 321.847 | -13,74 | 47.176 | -29,26 | ||||
| 2026-01-23 | 13F | Diversify Advisory Services, LLC | 1.334 | 221 | ||||||
| 2026-02-13 | 13F | SRS Capital Advisors, Inc. | 7.162 | 79,45 | 1.050 | 47,12 | ||||
| 2026-02-18 | 13F | Beacon Pointe Advisors, LLC | 8.732 | 18,71 | 1.280 | -2,66 | ||||
| 2026-02-17 | 13F | Two Sigma Securities, Llc | 8.875 | 637,74 | 1.301 | 504,65 | ||||
| 2026-02-17 | 13F | Nomura Holdings Inc | 2.727 | 400 | ||||||
| 2026-01-26 | 13F | Shelton Wealth Management, Llc | Call | 0 | -100,00 | 0 | ||||
| 2026-02-17 | 13F | Nomura Holdings Inc | Call | 1.783.500 | 476,81 | 261.425 | 373,06 | |||
| 2026-02-12 | 13F | Federated Hermes, Inc. | 395.993 | 6.279,78 | 58.045 | 5.133,90 | ||||
| 2026-02-17 | 13F | Nomura Holdings Inc | Put | 200.000 | -38,29 | 29.316 | -49,39 | |||
| 2026-01-26 | 13F | Shelton Wealth Management, Llc | 0 | -100,00 | 0 | |||||
| 2026-02-12 | 13F | Voya Investment Management Llc | 548.393 | 1,93 | 80.383 | -16,41 | ||||
| 2026-02-13 | 13F | Keystone Investors Pte Ltd | 0 | -100,00 | 0 | |||||
| 2026-01-26 | 13F | SeaBridge Investment Advisors LLC | 32.411 | -0,48 | 4.751 | -18,38 | ||||
| 2026-02-17 | 13F | Tudor Investment Corp Et Al | Put | 534.100 | 29,92 | 78.288 | 6,55 | |||
| 2026-02-18 | 13F | Mackenzie Financial Corp | 0 | -100,00 | 0 | |||||
| 2026-04-22 | 13F | Stone House Investment Management, LLC | 75 | -3,85 | 9 | -18,18 | ||||
| 2026-01-16 | 13F | Empirical Financial Services, LLC d.b.a. Empirical Wealth Management | 6.085 | 85,63 | 892 | 52,31 | ||||
| 2026-02-17 | 13F | Tudor Investment Corp Et Al | Call | 345.500 | 84,96 | 50.643 | 51,69 | |||
| 2026-02-02 | 13F | Pittenger & Anderson Inc | 33.850 | 0,00 | 4.962 | -18,00 | ||||
| 2025-11-14 | 13F | Avenir Tech Ltd | 0 | -100,00 | 0 | |||||
| 2026-02-17 | 13F | Aperture Investors, LLC | 0 | -100,00 | 0 | |||||
| 2026-01-12 | 13F | AllSquare Wealth Management LLC | 115 | 0,00 | 21 | 53,85 | ||||
| 2026-02-03 | 13F | Costello Asset Management, INC | 229 | 34 | ||||||
| 2026-02-17 | 13F | Tudor Investment Corp Et Al | 3.000 | -93,96 | 440 | -95,05 | ||||
| 2026-02-11 | 13F | Clifford Swan Investment Counsel Llc | 4.255 | 0,00 | 624 | -18,03 | ||||
| 2026-02-11 | 13F | Entelevest, LLC | 1.812 | 266 | ||||||
| 2026-02-19 | 13F | Connective Capital Management, LLC | 0 | -100,00 | 0 | |||||
| 2026-01-15 | 13F | Gunderson Capital Management Inc. | 0 | -100,00 | 0 | |||||
| 2026-02-02 | 13F | Del-Sette Capital Management, LLC | 0 | -100,00 | 0 | |||||
| 2026-04-23 | 13F | Farmers & Merchants Trust Co of Chambersburg PA | 1.750 | 0,00 | 0 | |||||
| 2026-04-21 | 13F | Merkkuri Wealth Advisors LLC | 37 | 5 | ||||||
| 2026-04-20 | 13F | Assenagon Asset Management S.A. | 0 | -100,00 | 0 | |||||
| 2026-02-13 | 13F | Glen Eagle Advisors, LLC | 313 | -19,33 | 46 | -34,78 | ||||
| 2026-02-17 | 13F | Clear Street Markets Llc | 0 | -100,00 | 0 | |||||
| 2026-01-28 | 13F | B. Metzler seel. Sohn & Co. AG | 23.101 | 60,49 | 3.386 | 31,65 | ||||
| 2026-01-14 | 13F | ORG Partners LLC | 127 | -75,39 | 19 | -80,43 | ||||
| 2025-11-13 | 13F | Quartz Partners, LLC | 0 | -100,00 | 0 | |||||
| 2026-04-24 | 13F | TT International Asset Management LTD | 927.535 | 118,34 | 116.369 | 187.590,32 | ||||
| 2026-04-20 | 13F | Contravisory Investment Management, Inc. | 2.063 | -5,24 | 259 | -19,12 | ||||
| 2026-02-17 | 13F | VestGen Advisors, LLC | 3.545 | -81,87 | 520 | -85,15 | ||||
| 2026-01-27 | 13F | Checchi Capital Advisers, LLC | 2.809 | -0,92 | 412 | -18,77 | ||||
| 2026-04-21 | 13F | Pinnacle Associates Ltd | 7.745 | -37,62 | 972 | -46,62 | ||||
| 2026-01-09 | 13F | 180 Wealth Advisors, Llc | 9.035 | 8,82 | 1.324 | -10,72 | ||||
| 2026-04-21 | 13F | Capital Investment Counsel, Inc | 19.086 | -2,73 | 2.395 | -16,76 | ||||
| 2026-02-17 | 13F | Kamunting Street Capital Management, L.P. | 50.000 | 7.329 | ||||||
| 2026-02-13 | 13F | Ieq Capital, Llc | 83.880 | -10,69 | 12.295 | -26,75 | ||||
| 2026-02-12 | 13F | Qtron Investments LLC | 0 | -100,00 | 0 | |||||
| 2026-04-16 | 13F | Quotient Wealth Partners, LLC | 1.802 | 226 | ||||||
| 2026-02-10 | 13F | Future Fund LLC | 11.434 | 1.676 | ||||||
| 2026-02-11 | 13F | Cedar Mountain Advisors, LLC | 11 | 0,00 | 2 | 0,00 | ||||
| 2026-02-12 | 13F | Mosley Wealth Management | 5.532 | 0,60 | 1.002 | 88,51 | ||||
| 2026-02-11 | 13F | X-Square Capital, LLC | 2.327 | -8,35 | 0 | |||||
| 2026-01-28 | 13F | CAPROCK Group, Inc. | 47.104 | 6,53 | 6.905 | 15,66 | ||||
| 2026-02-06 | 13F | Gsa Capital Partners Llp | 0 | -100,00 | 0 | |||||
| 2026-02-17 | 13F | Masters Capital Management Llc | Call | 1.000.000 | 900,00 | 146.580 | 720,12 | |||
| 2025-11-06 | 13F | Financial Advocates Investment Management | 0 | -100,00 | 0 | |||||
| 2026-01-29 | 13F | RMG Wealth Management LLC | 149 | 0,00 | 27 | 8,33 | ||||
| 2026-02-10 | 13F | Zweig-DiMenna Associates LLC | 137.000 | 149,77 | 20.081 | 104,85 | ||||
| 2026-04-17 | 13F | CENTRAL TRUST Co | 203 | -91,03 | 25 | -92,45 | ||||
| 2026-02-13 | 13F | Arkadios Wealth Advisors | Call | 100 | 15 | |||||
| 2026-02-13 | 13F | Arkadios Wealth Advisors | 25.890 | 1,43 | 3.795 | -16,81 | ||||
| 2026-04-10 | 13F | Granite FO LLC | 976 | 0,00 | 122 | -14,69 | ||||
| 2026-04-13 | 13F | Trust Co | 9 | 0,00 | 1 | 0,00 | ||||
| 2026-02-10 | 13F | Garde Capital, Inc. | 2.207 | 14,06 | 324 | -6,38 | ||||
| 2026-02-17 | 13F | Polymer Capital Management (US) LLC | 0 | -100,00 | 0 | |||||
| 2026-04-20 | 13F | Eagle Strategies LLC | 2.037 | 3,09 | 256 | -11,76 | ||||
| 2026-02-06 | 13F | Mizuho Markets Cayman LP | 0 | -100,00 | 0 | |||||
| 2026-02-09 | 13F | CBIZ Investment Advisory Services, LLC | 20 | 3 | ||||||
| 2026-01-27 | 13F | CenterStar Asset Management, LLC | Put | 4.700 | -9,62 | 689 | -25,94 | |||
| 2026-04-20 | 13F | Ritholtz Wealth Management | 50.053 | -0,87 | 6.280 | -15,15 | ||||
| 2026-02-09 | 13F | Wellington Shields & Co., LLC | 0 | -100,00 | 0 | |||||
| 2026-02-11 | 13F | Manchester Capital Management LLC | 575 | 84 | ||||||
| 2026-04-24 | 13F | Root Financial Partners, LLC | 2.588 | -2,82 | 325 | -16,92 | ||||
| 2026-02-13 | 13F | Marshall Wace, Llp | Call | 45.900 | 6.728 | |||||
| 2026-04-21 | 13F | Robeco Institutional Asset Management B.V. | 10.318 | -9,86 | 1.294 | -22,84 | ||||
| 2026-02-13 | 13F | Marshall Wace, Llp | Put | 12.500 | 1.832 | |||||
| 2026-04-02 | 13F | Hilltop National Bank | 465 | 8,39 | 58 | -6,45 | ||||
| 2026-02-13 | 13F | Marshall Wace, Llp | 268.531 | 39.361 | ||||||
| 2026-02-03 | 13F | SBI Securities Co., Ltd. | 23.794 | -8,77 | 3.488 | -25,19 | ||||
| 2026-02-06 | 13F | Mizuho Markets Cayman LP | Call | 0 | -100,00 | 0 | ||||
| 2025-11-19 | 13F/A | Regions Financial Corp | 0 | -100,00 | 0 | |||||
| 2026-04-17 | 13F | Weaver Capital Management LLC | 0 | -100,00 | 0 | |||||
| 2026-02-17 | 13F | Strive Financial Group ,LLC | 58 | 9 | ||||||
| 2026-02-05 | 13F | LGT Fund Management Co Ltd. | 6.200 | 181,82 | 914 | 127,11 | ||||
| 2026-02-12 | 13F | UniSuper Management Pty Ltd | 0 | -100,00 | 0 | |||||
| 2026-04-20 | 13F | Cherrydale Wealth Management, Llc | 1.598 | 0,00 | 200 | -14,53 | ||||
| 2026-02-17 | 13F | Align Financial, LLC | 14.658 | 15 | ||||||
| 2026-02-11 | 13F | First Command Advisory Services, Inc. | 196 | 0,00 | 29 | -20,00 | ||||
| 2026-02-11 | 13F | Capital Group Private Client Services, Inc. | 4.252 | 0,00 | 623 | -17,92 | ||||
| 2026-02-06 | 13F | Greenwoods Asset Management Hong Kong Ltd. | 843.409 | 0,00 | 123.627 | -17,99 | ||||
| 2026-04-09 | 13F | TrueWealth Advisors, LLC | 5.049 | 21,46 | 633 | 3,94 | ||||
| 2026-04-09 | 13F | Diversified Management Inc | 0 | -100,00 | 0 | |||||
| 2026-04-15 | 13F | Eaton Financial Holdings Company, LLC | 8.642 | 0,65 | 1.084 | -13,83 | ||||
| 2026-04-10 | 13F | Intellectus Partners, LLC | 21.357 | -4,78 | 2.679 | -18,50 | ||||
| 2026-02-12 | 13F | Ci Investments Inc. | 990.036 | 95,06 | 145.119 | 161.143,33 | ||||
| 2026-04-09 | 13F | Park Place Capital Corp | 439 | -0,23 | 55 | -14,06 | ||||
| 2026-02-17 | 13F | Claar Advisors LLC | 57.689 | 0,26 | 8.456 | -17,77 | ||||
| 2026-02-13 | 13F | Woodbridge CO LTD | 39.000 | 0,00 | 5.717 | -17,99 | ||||
| 2026-02-17 | 13F | Brevan Howard Capital Management LP | Call | 248.200 | -30,08 | 36.185 | -42,97 | |||
| 2026-01-07 | 13F | Sagespring Wealth Partners, Llc | 9.565 | 5,84 | 1.402 | -13,19 | ||||
| 2026-02-17 | 13F | Brevan Howard Capital Management LP | 379.350 | 232,46 | 55.305 | 171,20 | ||||
| 2026-02-17 | 13F | Lazard Asset Management Llc | 1.030.104 | -3,87 | 150.993 | -21,16 | ||||
| 2026-02-17 | 13F | Brevan Howard Capital Management LP | Put | 613.000 | 107,80 | 89.380 | 69,52 | |||
| 2026-02-09 | 13F | Integrity Advisory Solutions, LLC | 3.295 | 3,16 | 483 | -15,41 | ||||
| 2026-04-14 | 13F | Cohen Capital Management, Inc. | 5.926 | 0,00 | 743 | -14,40 | ||||
| 2026-04-16 | 13F | Sterneck Capital Management, LLC | 3.124 | -0,06 | 392 | -14,63 | ||||
| 2026-04-13 | 13F | Highland Capital Management, Llc | 5.390 | 0,00 | 676 | -14,43 | ||||
| 2026-02-12 | 13F | Summit Financial, LLC | 16.110 | -0,12 | 2.361 | -18,08 | ||||
| 2026-02-11 | 13F | BLI - Banque de Luxembourg Investments | 1.400 | 206 | ||||||
| 2026-04-23 | 13F | J.w. Cole Advisors, Inc. | 7.025 | 13,75 | 881 | 5,13 | ||||
| 2026-02-17 | 13F | Tang Capital Management Llc | 0 | -100,00 | 0 | |||||
| 2026-01-08 | 13F | Chesapeake Asset Management Llc | 1.639 | -44,27 | 240 | -54,29 | ||||
| 2026-02-06 | 13F | Envestnet Portfolio Solutions, Inc. | 4.729 | 8,94 | 693 | -10,58 | ||||
| 2026-04-17 | 13F | Murphy & Mullick Capital Management Corp | 65 | 18,18 | 8 | 0,00 | ||||
| 2026-02-17 | 13F | Marathon Asset Management Lp | 10.000 | 0,00 | 1.696 | -5,15 | ||||
| 2026-02-06 | 13F | Nano Cap New Millennium Growth Fund L P | 8.500 | 1.246 | ||||||
| 2026-02-11 | 13F | Myriad Asset Management Advisors LLC | 55.606 | 8.151 | ||||||
| 2026-02-17 | 13F | Teewinot Capital Advisers, L.L.C. | 355.811 | -22,76 | 52.155 | -36,65 | ||||
| 2026-02-12 | 13F | XY Capital Ltd | 93.944 | 10,27 | 13.770 | -9,57 | ||||
| 2026-04-20 | 13F | Jfs Wealth Advisors, Llc | 595 | 0,00 | 75 | -14,94 | ||||
| 2026-04-15 | 13F | Bayforest Capital Ltd | 100 | 13 | ||||||
| 2026-01-29 | 13F | Golden State Equity Partners | 1.665 | 244 | ||||||
| 2026-01-29 | 13F | WT Asset Management Ltd | 20.000 | -92,31 | 2.932 | -93,69 | ||||
| 2026-02-06 | 13F | Alta Capital Management Llc/ | 0 | -100,00 | 0 | |||||
| 2026-02-17 | 13F | Parallax Volatility Advisers, L.P. | Put | 1.341.000 | 32,72 | 196.564 | 8,85 | |||
| 2026-02-17 | 13F | Parallax Volatility Advisers, L.P. | 337.770 | 637,73 | 49.510 | 505,03 | ||||
| 2026-02-17 | 13F | Parallax Volatility Advisers, L.P. | Call | 568.500 | -23,52 | 83.331 | -37,28 | |||
| 2026-02-17 | 13F | BLKBRD Asset Management, LP | 19.995 | -77,09 | 2.931 | -81,22 | ||||
| 2026-04-22 | 13F | Janney Montgomery Scott LLC | 60.715 | -8,23 | 8 | -22,22 | ||||
| 2026-01-23 | 13F | Sumitomo Mitsui Trust Holdings, Inc. | 448.310 | 110,85 | 65.713 | 72,92 | ||||
| 2026-02-09 | 13F | Cypress Capital Management LLC (WY) | 28 | 0,00 | 4 | -20,00 | ||||
| 2026-01-30 | 13F | Strategic Blueprint, LLC | 0 | -100,00 | 0 | |||||
| 2026-02-12 | 13F | Alps Advisors Inc | 7.894 | -0,97 | 1.157 | -18,75 | ||||
| 2026-03-10 | 13F | PeakShares LLC | 1.500 | 220 | ||||||
| 2026-02-13 | 13F | Panagora Asset Management Inc | 43.243 | -2,52 | 6.339 | -20,06 | ||||
| 2026-04-21 | 13F | Forteris Wealth Management Inc. | 5.307 | 3,92 | 666 | -11,10 | ||||
| 2026-02-17 | 13F | Ameriprise Financial Inc | 404.497 | 13,58 | 59.291 | -6,96 | ||||
| 2026-02-17 | 13F | Silvercrest Asset Management Group Llc | 4.803 | 122,16 | 704 | 82,38 | ||||
| 2026-01-21 | 13F | MBA Advisors LLC | 0 | -100,00 | 0 | |||||
| 2026-01-20 | 13F/A | Miller Wealth Advisors, Llc | 100 | 0,00 | 15 | -17,65 | ||||
| 2026-02-12 | 13F | Bank of Jackson Hole Trust | 7 | 1 | ||||||
| 2026-02-17 | 13F | Gladstone Institutional Advisory LLC | 6.723 | 17,19 | 986 | -3,90 | ||||
| 2026-02-13 | 13F | JustInvest LLC | 32.375 | 6,63 | 4.746 | -12,55 | ||||
| 2026-01-27 | 13F | Gf Fund Management Co. Ltd. | 0 | -100,00 | 0 | |||||
| 2026-02-12 | 13F | Davy Global Fund Management Ltd | 41.393 | 6.067 | ||||||
| 2026-02-13 | 13F | Cloverfields Capital Group, Lp | 20.655 | 11,87 | 3.028 | -8,24 | ||||
| 2026-02-10 | 13F | Greenspring Advisors, LLC | 2.383 | 349 | ||||||
| 2026-02-12 | 13F | Federation des caisses Desjardins du Quebec | 135.728 | 8,41 | 19.895 | -11,09 | ||||
| 2026-02-13 | 13F | Klingenstein Fields & Co Lp | 0 | -100,00 | 0 | |||||
| 2026-02-17 | 13F | Warren Averett Asset Management, LLC | 27.139 | 3,89 | 3.978 | -14,80 | ||||
| 2026-02-17 | 13F | Family Management Corp | 16.833 | -23,14 | 2.467 | -36,97 | ||||
| 2026-04-16 | 13F | Stanley-Laman Group, Ltd. | 13.000 | -10,34 | 1.631 | -23,29 | ||||
| 2026-02-10 | 13F | Texas Yale Capital Corp. | 0 | -100,00 | 0 | |||||
| 2026-01-27 | 13F | Oriental Harbor Investment Fund | 0 | -100,00 | 0 | -100,00 | ||||
| 2025-11-14 | 13F | Grafton Street Partners Fund, LP | 27.355 | 0,00 | 4.889 | 57,61 | ||||
| 2026-02-13 | 13F | Segall Bryant & Hamill, Llc | 20.970 | -4,98 | 3.074 | -22,08 | ||||
| 2026-01-28 | 13F | Financial Perspectives, Inc | 1.139 | 0,00 | 167 | -17,73 | ||||
| 2026-04-20 | 13F | SILVER OAK SECURITIES, Inc | 1.995 | 0,00 | 250 | -14,68 | ||||
| 2026-02-10 | 13F | Thoroughbred Financial Services, Llc | 10.485 | 0,00 | 2 | 0,00 | ||||
| 2026-04-20 | 13F | Davis Investment Partners, LLC | 1.728 | 217 | ||||||
| 2026-02-13 | 13F | Capula Management Ltd | Call | 0 | -100,00 | 0 | -100,00 | |||
| 2026-02-20 | 13F/A | CMT Capital Markets Trading GmbH | Put | 498.800 | 73 | |||||
| 2026-02-17 | 13F | Mercer Global Advisors Inc /adv | 31.630 | 71,74 | 4.636 | 40,87 | ||||
| 2026-02-20 | 13F/A | CMT Capital Markets Trading GmbH | Call | 1.140.800 | 390,67 | 167 | 307,32 | |||
| 2026-02-13 | 13F | Titan Investment Solutions Ltd | 38.699 | 5.672 | ||||||
| 2026-04-15 | 13F | Exchange Traded Concepts, Llc | 73.985 | -26,58 | 9.282 | -37,15 | ||||
| 2026-02-11 | 13F | Cooper/haims Advisors, Llc | 3.371 | 5,15 | 494 | -13,79 | ||||
| 2026-02-19 | 13F | Atomi Financial Group, Inc. | 29.820 | 8,88 | 4.371 | -10,70 | ||||
| 2026-01-20 | 13F | Philip James Wealth Mangement, LLC | 56.138 | -4,28 | 8.229 | -21,50 | ||||
| 2026-04-14 | 13F | Westend Capital Management LLC | 25 | 3 | ||||||
| 2026-01-23 | 13F | Assetmark, Inc | 70.295 | 28,88 | 10.304 | 5,69 | ||||
| 2026-02-09 | 13F | Todd Asset Management Llc | 329.018 | -1,33 | 48.228 | -19,08 | ||||
| 2026-02-12 | 13F | Wealthspire Advisors, LLC | 7.613 | 162,16 | 1.116 | 115,25 | ||||
| 2026-02-13 | 13F | Hurley Capital, LLC | 361 | -21,69 | 53 | -36,59 | ||||
| 2026-02-13 | 13F | Hurley Capital, LLC | Call | 5 | 25,00 | 4 | -69,23 | |||
| 2026-02-12 | 13F | Sycomore Asset Management | 2.800 | 0,00 | 0 | |||||
| 2026-02-12 | 13F | Hudock, Inc. | 0 | -100,00 | 0 | |||||
| 2026-01-15 | 13F | Victory Financial Group, Llc | 3.599 | 13,57 | 528 | -6,89 | ||||
| 2026-04-06 | 13F | Washington Trust Advisors, Inc. | 16 | 0,00 | 2 | 0,00 | ||||
| 2026-02-13 | 13F | Evelyn Partners Investment Management Services Ltd | 150 | -58,10 | 22 | -66,67 | ||||
| 2026-02-10 | 13F | Transatlantique Private Wealth Llc | 2.409 | -6,56 | 353 | -23,26 | ||||
| 2026-02-17 | 13F | Lagoda Investment Management, L.P. | 5.508 | 807 | ||||||
| 2026-01-16 | 13F | Selective Wealth Management, Inc. | 11.618 | -7,31 | 1.986 | -12,63 | ||||
| 2026-02-17 | 13F | Appaloosa Lp | 5.137.931 | -20,34 | 753.118 | -34,67 | ||||
| 2026-04-17 | 13F | AdvisorNet Financial, Inc | 1.783 | -0,06 | 224 | -14,56 | ||||
| 2026-02-10 | 13F | SCS Capital Management LLC | 1.437 | -18,31 | 211 | -33,12 | ||||
| 2026-02-10 | 13F | Twin Peaks Wealth Advisors, LLC | 1.284 | 209 | ||||||
| 2026-02-06 | 13F | New Millennium Group LLC | 36 | -41,94 | 5 | -54,55 | ||||
| 2026-02-17 | 13F | Wellington Management Group Llp | Call | 0 | -100,00 | 0 | ||||
| 2026-01-15 | 13F | Frank, Rimerman Advisors LLC | 13.965 | 19,72 | 2.047 | -1,82 | ||||
| 2026-02-13 | 13F | Towarzystwo Funduszy Inwestycyjnych Pzu Sa | 4.750 | 696 | ||||||
| 2026-02-13 | 13F | Carmignac Gestion | 9.540 | 1.398 | ||||||
| 2026-03-10 | 13F | MY.Alpha Management HK Advisors Ltd | 0 | -100,00 | 0 | |||||
| 2026-02-20 | 13F/A | CMT Capital Markets Trading GmbH | 43.725 | -15,91 | 6 | -33,33 | ||||
| 2026-02-06 | 13F | Keystone Financial Group | 0 | -100,00 | 0 | -100,00 | ||||
| 2025-11-13 | 13F | Riggs Asset Managment Co. Inc. | 0 | -100,00 | 0 | |||||
| 2026-02-03 | 13F | Sequoia Financial Advisors, LLC | 23.515 | 10,93 | 3.447 | -9,03 | ||||
| 2026-02-17 | 13F | Fairscale Capital, LLC | 0 | -100,00 | 0 | |||||
| 2026-02-17 | 13F | GeoWealth Management, LLC | 3.206 | 86,72 | 470 | 53,27 | ||||
| 2026-01-05 | 13F | Chesapeake Asset Management Llc | Put | 2 | -87,50 | 0 | ||||
| 2025-11-12 | 13F | HAP Trading, LLC | Put | 211.900 | 1.253 | |||||
| 2026-04-23 | 13F | Harbor Investment Advisory, Llc | 1.248 | -98,15 | 157 | -45,83 | ||||
| 2026-02-17 | 13F | Bbfit Investments Pte Ltd | 728.800 | 106.828 | ||||||
| 2025-11-12 | 13F | HAP Trading, LLC | Call | 366.900 | 11.773 | |||||
| 2025-11-03 | 13F | Private Wealth Asset Management, LLC | 0 | -100,00 | 0 | |||||
| 2025-11-12 | 13F | Waverton Investment Management Ltd | 16.971 | 0,00 | 3.032 | 57,59 | ||||
| 2026-04-15 | 13F | Merit Financial Group, LLC | 11.650 | -25,99 | 1.462 | -36,67 | ||||
| 2026-04-24 | 13F | Yousif Capital Management, Llc | 20.031 | 0,28 | 2.513 | -22,51 | ||||
| 2026-02-11 | 13F | Harvest Fund Management Co., Ltd | 84.808 | 3,55 | 12 | -14,29 | ||||
| 2026-02-17 | 13F | Wealth Watch Advisors, INC | 20 | 3 | ||||||
| 2026-02-05 | 13F | Stephens Inc /ar/ | 9.571 | -7,14 | 1.403 | -26,67 | ||||
| 2026-02-03 | 13F | Strengthening Families & Communities, LLC | 92 | -69,84 | 13 | -66,67 | ||||
| 2026-02-17 | 13F | Lombard Odier Asset Management (USA) Corp | 1.680 | -77,91 | 246 | -81,90 | ||||
| 2026-04-14 | 13F | Prospera Financial Services Inc | 5.087 | -50,62 | 640 | -57,71 | ||||
| 2026-04-22 | 13F | Yelin Lapidot Holdings Management Ltd. | 69.320 | 0,00 | 8.697 | -14,41 | ||||
| 2026-02-13 | 13F | FirstWave Capital Management LLC | 6.185 | 907 | ||||||
| 2026-02-17 | 13F | Meridiem Capital Partners LP | Call | 50.000 | 7.329 | |||||
| 2026-02-13 | 13F | Colony Group, LLC | 48.061 | 10,02 | 7.221 | -7,41 | ||||
| 2026-04-09 | 13F | Whitaker-Myers Wealth Managers, LTD. | 13.881 | 45,14 | 1.742 | 24,27 | ||||
| 2026-04-20 | 13F | Inscription Capital, LLC | 1.612 | 12,10 | 202 | -3,81 | ||||
| 2026-02-03 | 13F | Crossmark Global Holdings, Inc. | 140.025 | -11,99 | 20.525 | -27,83 | ||||
| 2026-01-27 | 13F | Brighton Jones Llc | 0 | -100,00 | 0 | |||||
| 2026-02-17 | 13F | Qube Research & Technologies Ltd | Put | 434.200 | 63,48 | 63.645 | 34,07 | |||
| 2026-04-24 | 13F | Strs Ohio | 289.494 | -22,56 | 36.320 | -33,71 | ||||
| 2026-02-17 | 13F | Qube Research & Technologies Ltd | Call | 651.100 | 46,74 | 95.438 | 20,35 | |||
| 2026-02-20 | 13F/A | Capital Markets Trading UK LLP | Put | 165.500 | 24 | |||||
| 2026-02-17 | 13F | EFG International AG | 32.192 | 4.719 | ||||||
| 2026-02-17 | 13F | 3G Capital Partners LP | 75.000 | 275,00 | 10.994 | 207,58 | ||||
| 2026-02-17 | 13F | Qube Research & Technologies Ltd | 426.956 | 62.583 | ||||||
| 2026-02-20 | 13F/A | Capital Markets Trading UK LLP | Call | 210.100 | 31 | |||||
| 2026-02-12 | 13F | BRYN MAWR TRUST Co | 450 | 0,00 | 66 | -18,75 | ||||
| 2026-02-17 | 13F | DV Trading LLC | Put | 17.600 | 2.580 | |||||
| 2026-02-13 | 13F | ICONIQ Capital, LLC | 7.990 | -10,36 | 1.171 | -26,49 | ||||
| 2026-02-17 | 13F | DV Trading LLC | Call | 1.300 | 191 | |||||
| 2026-02-17 | 13F | Royal Bank Of Canada | Put | 30.700 | 4.500 | |||||
| 2026-02-05 | 13F | Accredited Investors Inc. | 2.778 | -0,29 | 407 | -18,11 | ||||
| 2026-02-17 | 13F | Hancock Whitney Corp | 6.514 | 42,76 | 955 | 17,06 | ||||
| 2026-02-17 | 13F | Royal Bank Of Canada | Call | 28.200 | 0,00 | 4.134 | -17,98 | |||
| 2026-02-11 | 13F | Brandywine Global Investment Management, LLC | 86.528 | -6,20 | 12.683 | -23,07 | ||||
| 2026-02-17 | 13F | Royal Bank Of Canada | 2.007.605 | -11,04 | 294.275 | -27,04 | ||||
| 2026-02-09 | 13F | Fisher Asset Management, LLC | 5.335.894 | 0,80 | 782.135 | -17,33 | ||||
| 2026-02-17 | 13F | Clark Capital Management Group, Inc. | 0 | -100,00 | 0 | |||||
| 2026-02-10 | 13F | PARUS FINANCE (UK) Ltd | 220.055 | 1,50 | 32.256 | -16,76 | ||||
| 2025-11-05 | 13F | Koesten, Hirschmann & Crabtree, INC. | 0 | -100,00 | 0 | |||||
| 2026-02-10 | 13F | IAG Wealth Partners, LLC | 353 | 0,00 | 52 | -19,05 |