Grundlæggende statistik
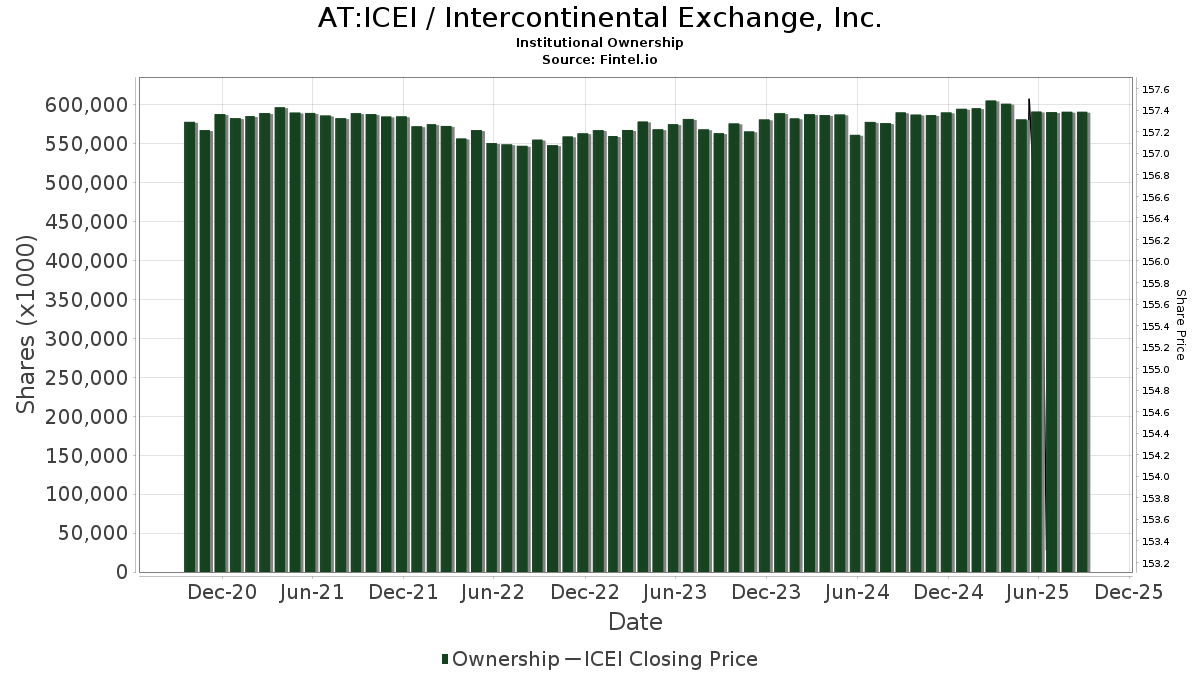
| Institutionelle aktier (lange) | 575.601.444 - 101,62% (ex 13D/G) - change of -7,11MM shares -1,22% MRQ |
| Institutionel værdi (lang) | $ 80.100.809 USD ($1000) |
Institutionelt ejerskab og aktionærer
Intercontinental Exchange, Inc. (AT:ICEI) har 1745 institutionelle ejere og aktionærer, der har indsendt 13D/G- eller 13F-formularer til Securities Exchange Commission (SEC). Disse institutioner har i alt 575,601,444 aktier. Største aktionærer omfatter Vanguard Group Inc, J. Stern & Co. LLP, BlackRock, Inc., State Street Corp, Morgan Stanley, Harris Associates L P, Geode Capital Management, Llc, Royal Bank Of Canada, Norges Bank, and Price T Rowe Associates Inc /md/ .
Intercontinental Exchange, Inc. (WBAG:ICEI) institutionel ejerskabsstruktur viser aktuelle positioner i virksomheden efter institutioner og fonde, samt seneste ændringer i positionsstørrelse. Større aktionærer kan omfatte individuelle investorer, investeringsforeninger, hedgefonde eller institutioner. Skema 13D angiver, at investoren besidder (eller besidder) mere end 5 % af virksomheden og har til hensigt (eller har til hensigt at) aktivt at forfølge en ændring i forretningsstrategi. Skema 13G indikerer en passiv investering på over 5%.
The share price as of April 24, 2026 is 133,50 / share. Previously, on May 9, 2025, the share price was 158,02 / share. This represents a decline of 15,52% over that period.
Fondens stemningsscore
Fund Sentiment Score (fka Ownership Accumulation Score) finder de aktier, der bliver mest købt af fonde. Det er resultatet af en sofistikeret, multi-faktor kvantitativ model, der identificerer virksomheder med de højeste niveauer af institutionel akkumulering. Scoringsmodellen bruger en kombination af den samlede stigning i oplyste ejere, ændringerne i porteføljeallokeringer i disse ejere og andre målinger. Tallet går fra 0 til 100, hvor højere tal indikerer et højere niveau af akkumulering for sine jævnaldrende, og 50 er gennemsnittet.
Opdateringsfrekvens: Dagligt
Se Ownership Explorer, som giver en liste over højest rangerende virksomheder.
AI+ Ask Fintel’s AI assistant about Intercontinental Exchange, Inc..
Select a question to share a public post with an AI-crafted answer.
Thinking of good questions…
13F og NPORT arkivering
Detaljer om 13F-arkivering er gratis. Detaljer om NP-ansøgninger kræver et premium-medlemskab. Grønne rækker angiver nye positioner. Røde rækker angiver lukkede positioner. Klik på linket ikon for at se den fulde transaktionshistorik.
Opgrader
for at låse premium-data op og eksportere til Excel ![]() .
.
Important Note
In an effort to reduce load times for our mobile users, we are testing some ways to deliver lighter pages.
In this first test, we will deliver only the most recent 750 transactions (out of 2053 for this stock). If you are interested in loading *all* the transactions for this company, click the "load all" button below. This is just a test and if you don't like it, please let us know by submitting some gentle feedback via the link at the bottom of this page.
Load All| Fil dato | Kilde | Investor | Type | Gennemsnitlig pris (Øst) |
Aktier | Δ Aktier (%) |
Rapporteret Værdi ($1000) |
Δ Værdi (%) |
Port Alloc (%) |
|
|---|---|---|---|---|---|---|---|---|---|---|
| 2026-02-17 | 13F | Gladstone Capital Management LLP | 100 | -99,94 | 16 | -99,94 | ||||
| 2026-04-23 | 13F | Iridian Asset Management Llc/ct | 15.515 | -4,03 | 2.440 | -6,80 | ||||
| 2026-02-12 | 13F | BRYN MAWR TRUST Co | 7.195 | 19,36 | 1.165 | 14,78 | ||||
| 2026-01-28 | 13F | Proathlete Wealth Management Llc | 20 | 3 | ||||||
| 2026-01-28 | 13F | West Michigan Advisors, Llc | 2.303 | 79,08 | 373 | 72,22 | ||||
| 2026-04-09 | 13F | Generali Investments, Management Co LLC | 3.799 | -1,35 | 598 | -4,17 | ||||
| 2025-11-14 | 13F | Binnacle Investments Inc | 142 | 0,00 | 24 | -11,54 | ||||
| 2026-02-10 | 13F | American Money Management, LLC | 32.892 | 1,58 | 5.327 | -2,35 | ||||
| 2026-04-21 | 13F | Fruth Investment Management | 6.000 | 0,00 | 1 | |||||
| 2026-02-17 | 13F | Two Sigma Securities, Llc | 8.647 | 1.400 | ||||||
| 2026-04-13 | 13F | Hm Payson & Co | 1.595 | 407,96 | 251 | 400,00 | ||||
| 2026-02-13 | 13F | FORA Capital, LLC | 0 | -100,00 | 0 | -100,00 | ||||
| 2026-04-14 | 13F | Congress Asset Management Co /ma | 1.980 | -21,74 | 311 | -23,96 | ||||
| 2026-02-10 | 13F | Westpac Banking Corp | 28.054 | -13,82 | 4.544 | -17,16 | ||||
| 2026-04-22 | 13F | CrossGen Wealth, LLC | 326 | 0,00 | 51 | -1,92 | ||||
| 2026-02-04 | 13F | Valeo Financial Advisors, LLC | 7.257 | -24,98 | 1.175 | -27,87 | ||||
| 2026-02-17 | 13F | Tcw Group Inc | 713.787 | 11,30 | 115.605 | 6,99 | ||||
| 2026-02-10 | 13F | Ellevest, Inc. | 2.551 | -3,52 | 413 | -7,19 | ||||
| 2026-02-17 | 13F | Delta Global Management LP | 219.839 | 477,72 | 35.605 | 455,37 | ||||
| 2026-02-17 | 13F | Brevan Howard Capital Management LP | 3.461 | -64,07 | 561 | -65,47 | ||||
| 2026-02-02 | 13F | Ashton Thomas Securities, Llc | 0 | -100,00 | 0 | |||||
| 2026-02-10 | 13F | Principia Wealth Advisory, LLC | 32 | 18,52 | 5 | 25,00 | ||||
| 2026-02-04 | 13F | HighPoint Advisor Group LLC | 8.870 | -0,86 | 1.437 | -4,71 | ||||
| 2026-02-13 | 13F | Fairbanks Capital Management, Inc. | 10.133 | 2,50 | 1.641 | -1,44 | ||||
| 2026-02-10 | 13F | Core Wealth Advisors, Llc | 28 | 5 | ||||||
| 2026-02-17 | 13F | Harvey Capital Management Inc | 56.360 | 32,67 | 9.128 | 27,54 | ||||
| 2026-04-09 | 13F | Nelson, Van Denburg & Campbell Wealth Management Group, LLC | 12.735 | 1,02 | 2.003 | -1,86 | ||||
| 2026-01-29 | 13F | State Of Michigan Retirement System | 232.842 | -2,35 | 37.711 | -6,13 | ||||
| 2026-02-11 | 13F | Fjarde Ap-fonden /fourth Swedish National Pension Fund | 101.706 | 16.472 | ||||||
| 2026-02-12 | 13F | Advisors Asset Management, Inc. | 12.526 | 46,30 | 2.029 | 40,64 | ||||
| 2026-02-02 | 13F | Caisse Des Depots Et Consignations | 13.247 | -40,86 | 2.145 | -43,16 | ||||
| 2026-04-17 | 13F | Hanson & Doremus Investment Management | 367 | 0,00 | 0 | |||||
| 2026-04-16 | 13F | Baron Wealth Management LLC | 2.229 | 46,16 | 351 | 42,28 | ||||
| 2026-02-13 | 13F | Delos Wealth Advisors, LLC | 282 | 0,00 | 46 | -4,26 | ||||
| 2025-11-14 | 13F | ICONIQ Capital, LLC | 0 | -100,00 | 0 | |||||
| 2026-04-15 | 13F | AlphaStar Capital Management, LLC | 10.219 | -32,97 | 1.607 | -34,91 | ||||
| 2026-02-17 | 13F | Mercer Global Advisors Inc /adv | 52.208 | -0,58 | 8.457 | -4,41 | ||||
| 2026-02-04 | 13F | Swiss Life Asset Management Ltd | 111.178 | 9,35 | 18.006 | 5,12 | ||||
| 2026-01-28 | 13F | Mowery & Schoenfeld Wealth Management, LLC | 78 | 0,00 | 13 | -7,69 | ||||
| 2026-02-06 | 13F | Twin Capital Management Inc | 3.329 | -5,24 | 539 | -8,80 | ||||
| 2026-02-13 | 13F | Walleye Capital LLC | Call | 24.900 | 678,12 | 4.033 | 648,05 | |||
| 2026-04-24 | 13F | Optas, LLC | 6.975 | 2,74 | 1.097 | -0,18 | ||||
| 2026-02-13 | 13F | Walleye Capital LLC | Put | 6.700 | 71,79 | 1.085 | 65,14 | |||
| 2026-02-13 | 13F | Headlands Technologies LLC | 10.089 | 1.634 | ||||||
| 2026-04-15 | 13F | Hartford Financial Management Inc. | 500 | 0,00 | 79 | -2,50 | ||||
| 2026-02-13 | 13F | Walleye Capital LLC | 2 | -100,00 | 0 | -100,00 | ||||
| 2026-04-24 | 13F | Strs Ohio | 181.242 | -3,99 | 28.506 | -6,77 | ||||
| 2026-04-20 | 13F | Jfs Wealth Advisors, Llc | 212 | 2,91 | 33 | 0,00 | ||||
| 2026-04-21 | 13F | Financial Consulate, Inc | 9 | 50,00 | 1 | |||||
| 2026-02-12 | 13F | Loomis Sayles & Co L P | 184 | -4,17 | 30 | -9,37 | ||||
| 2026-02-13 | 13F | AlTi Global, Inc. | 16.160 | 0,53 | 2.617 | -3,32 | ||||
| 2026-02-12 | 13F | Penserra Capital Management LLC | 123 | 156,25 | 0 | |||||
| 2025-10-30 | 13F | Traub Capital Management LLC | 0 | -100,00 | 0 | -100,00 | ||||
| 2026-01-30 | 13F | Verity Asset Management, Inc. | 0 | -100,00 | 0 | |||||
| 2026-01-21 | 13F | Oak Thistle LLC | 0 | -100,00 | 0 | -100,00 | ||||
| 2026-02-11 | 13F | Sunrise Financial Services, LLC | 14 | 2 | ||||||
| 2026-02-17 | 13F | one8zero8, LLC | 1.790 | 0,00 | 290 | -3,99 | ||||
| 2026-01-23 | 13F | Sumitomo Mitsui Trust Holdings, Inc. | 2.091.380 | -3,00 | 338.720 | -6,75 | ||||
| 2026-01-23 | 13F | Reuter James Wealth Management, Llc | 19.239 | -1,86 | 3.116 | -5,63 | ||||
| 2025-11-12 | 13F | Proficio Capital Partners LLC | 0 | -100,00 | 0 | |||||
| 2026-02-12 | 13F | Intesa Sanpaolo Wealth Management | 30.795 | 4.988 | ||||||
| 2026-02-13 | 13F | MAI Capital Management | Call | 16 | 0,00 | |||||
| 2026-04-20 | 13F | Louisiana State Employees Retirement System | 28.900 | -0,69 | 4.545 | -3,56 | ||||
| 2026-02-13 | 13F | MAI Capital Management | 142.663 | 3,80 | 23.106 | -0,22 | ||||
| 2026-02-13 | 13F | Smartleaf Asset Management LLC | 12.820 | -2,06 | 2.092 | -4,91 | ||||
| 2026-02-13 | 13F | Resources Management Corp /ct/ /adv | 12.319 | 31,43 | 2 | 0,00 | ||||
| 2026-04-08 | 13F | Miracle Mile Advisors, LLC | 1.694 | 266 | ||||||
| 2026-01-29 | 13F | IMC-Chicago, LLC | 21.110 | 3.419 | ||||||
| 2025-11-14 | 13F | Wetherby Asset Management Inc | 11.676 | 4,24 | 1.967 | -4,28 | ||||
| 2026-04-08 | 13F | AAFMAA Wealth Management & Trust LLC | 5.791 | -3,34 | 911 | -6,19 | ||||
| 2026-03-12 | 13F | Nalls Sherbakoff Group, Llc | 0 | -100,00 | 0 | |||||
| 2026-02-17 | 13F | Sagewood Asset Management LP | 1.506 | 244 | ||||||
| 2026-02-13 | 13F | L1 Capital Pty Ltd | 679.203 | 110.004 | ||||||
| 2026-04-01 | 13F | Bangor Savings Bank | 10.027 | -2,27 | 1.577 | -5,06 | ||||
| 2026-04-14 | 13F | Zrc Wealth Management, Llc | 96 | 255,56 | 15 | 275,00 | ||||
| 2026-02-02 | 13F | Advisors Preferred, LLC | 11.350 | -73,99 | 1.816 | -74,43 | ||||
| 2026-02-13 | 13F | Manufacturers Life Insurance Company, The | 0 | -100,00 | 0 | |||||
| 2026-03-16 | 13F | Osbon Capital Management Llc | 23 | 4 | ||||||
| 2026-02-12 | 13F | M&G Plc | 177.895 | 66,15 | 28.819 | 60,22 | ||||
| 2026-02-24 | 13F | MidFirst Bank | 2.396 | 357 | ||||||
| 2026-01-27 | 13F | Regions Financial Corp | 32.810 | -14,22 | 5.314 | -17,55 | ||||
| 2026-02-10 | 13F | IFG Advisory, LLC | 21.189 | 3.432 | ||||||
| 2026-02-17 | 13F | EFG International AG | 111 | 18 | ||||||
| 2026-04-22 | 13F | Traphagen Investment Advisors Llc | 56.176 | -0,05 | 8.835 | -2,93 | ||||
| 2026-04-22 | 13F | JNBA Financial Advisors | 347 | 0,00 | 55 | -3,57 | ||||
| 2026-02-12 | 13F | Federated Hermes, Inc. | 89.388 | -77,97 | 14.477 | -78,83 | ||||
| 2025-11-03 | 13F | Addison Capital Co | 0 | -100,00 | 0 | |||||
| 2026-01-29 | 13F | Dunhill Financial, LLC | 50 | 13,64 | 8 | 14,29 | ||||
| 2026-01-30 | 13F | Sigma Planning Corp | 1.715 | -2,50 | 276 | -7,09 | ||||
| 2026-02-11 | 13F | Cantillon Capital Management Llc | 3.337.982 | 0,76 | 540.620 | -3,14 | ||||
| 2026-02-17 | 13F | Parallax Volatility Advisers, L.P. | Put | 72.200 | 3,29 | 11.694 | -0,70 | |||
| 2026-02-09 | 13F | Huntington National Bank | 21.003 | -3,89 | 3.402 | -7,61 | ||||
| 2026-02-13 | 13F | FJ Capital Management LLC | 0 | -100,00 | 0 | |||||
| 2026-02-17 | 13F | Parallax Volatility Advisers, L.P. | 43.471 | 43,41 | 7.041 | 37,88 | ||||
| 2026-04-17 | 13F | Clear Trail Advisors, LLC | 3.522 | -2,00 | 554 | -4,98 | ||||
| 2026-02-03 | 13F | RB Capital Management, LLC | 4.646 | 3,75 | 752 | -0,27 | ||||
| 2026-01-12 | 13F | Heartwood Wealth Advisors LLC | 0 | -100,00 | 0 | |||||
| 2026-02-05 | 13F | RiverFront Investment Group, LLC | 1.355 | 2,42 | 219 | -1,35 | ||||
| 2026-01-13 | 13F | Argentarii, LLC | 1.555 | -4,83 | 252 | -8,73 | ||||
| 2026-02-06 | 13F | Redmont Wealth Advisors Llc | 55 | 0,00 | 9 | -11,11 | ||||
| 2025-11-14 | 13F | Hamilton Wealth, LLC | 0 | -100,00 | 0 | -100,00 | ||||
| 2026-04-17 | 13F | Anchyra Partners Llc | 2.198 | 3,53 | 346 | 0,58 | ||||
| 2026-02-17 | 13F | Scientech Research LLC | 0 | -100,00 | 0 | |||||
| 2026-02-03 | 13F | Sequoia Financial Advisors, LLC | 26.076 | 20,15 | 4.223 | 15,51 | ||||
| 2026-01-20 | 13F | Steel Peak Wealth Management LLC | 0 | -100,00 | 0 | |||||
| 2026-02-10 | 13F | EagleClaw Capital Managment, LLC | 68.876 | 0,09 | 11.155 | -3,78 | ||||
| 2026-02-04 | 13F | Mascoma Wealth Management LLC | 226 | 5,12 | 37 | 0,00 | ||||
| 2025-10-29 | 13F | JCIC Asset Management Inc. | 0 | -100,00 | 0 | -100,00 | ||||
| 2026-02-17 | 13F | Bank Of America Corp /de/ | 6.310.998 | -48,61 | 1.022.129 | -50,60 | ||||
| 2026-02-11 | 13F | Capital World Investors | 7.907.399 | 12,50 | 1.280.688 | 8,14 | ||||
| 2026-02-04 | 13F | Oregon Public Employees Retirement Fund | 65.244 | -0,31 | 10.567 | -4,17 | ||||
| 2026-01-13 | 13F | Parsons Capital Management Inc/ri | 0 | -100,00 | 0 | |||||
| 2026-02-13 | 13F | Ossiam | 9.936 | -18,63 | 1.609 | -21,78 | ||||
| 2025-11-14 | 13F | ISAM Funds (UK) Ltd | 0 | -100,00 | 0 | |||||
| 2026-02-17 | 13F | Lighthouse Investment Partners, LLC | 20.159 | -65,48 | 3.265 | -66,83 | ||||
| 2026-04-22 | 13F | Boomfish Wealth Group, LLC | 18.435 | 1,90 | 2.899 | -1,06 | ||||
| 2026-02-10 | 13F | Nomura Asset Management Co Ltd | 191.816 | 0,05 | 31.067 | -3,82 | ||||
| 2026-02-13 | 13F | National Bank Of Canada /fi/ | 592.800 | 214,20 | 96.007 | 202,04 | ||||
| 2026-04-20 | 13F | CWA Asset Management Group, LLC | 6.588 | 15,17 | 1.036 | 11,88 | ||||
| 2026-02-09 | 13F | Fisher Asset Management, LLC | 2.472 | -8,10 | 401 | -11,70 | ||||
| 2025-11-17 | 13F | PharVision Advisers, LLC | 0 | -100,00 | 0 | |||||
| 2026-04-13 | 13F | Bank of New Hampshire | 18.132 | -0,28 | 2.852 | -3,16 | ||||
| 2026-03-04 | 13F | Rehmann Capital Advisory Group | 7.742 | -2,60 | 1.255 | -6,27 | ||||
| 2026-01-23 | 13F | LOM Asset Management Ltd | 12.826 | 1,59 | 2.077 | -2,35 | ||||
| 2026-01-27 | 13F | WealthCollab, LLC | 127 | 0,00 | 21 | -4,76 | ||||
| 2026-01-27 | 13F | TD Waterhouse Canada Inc. | 8.072 | 182,24 | 1.308 | 181,08 | ||||
| 2026-02-09 | 13F | Harbour Investments, Inc. | 3.302 | -27,95 | 535 | -30,83 | ||||
| 2026-02-06 | 13F | Envestnet Portfolio Solutions, Inc. | 26.934 | -3,71 | 4.362 | -7,43 | ||||
| 2025-11-07 | 13F | Synovus Financial Corp | 33.568 | 1,29 | 5.656 | -6,99 | ||||
| 2026-02-10 | 13F | Eurizon Capital SGR S.p.A. | 1.314.776 | 213.286 | ||||||
| 2025-11-13 | 13F | Quantitative Investment Management, LLC | 0 | -100,00 | 0 | |||||
| 2026-01-30 | 13F | R Squared Ltd | 1.692 | -38,52 | 274 | -40,82 | ||||
| 2026-01-29 | 13F | Quest 10 Wealth Builders, Inc. | 90 | 0,00 | 15 | -6,67 | ||||
| 2026-02-17 | 13F | Polar Capital Holdings Plc | 215.430 | -0,13 | 34.891 | -3,99 | ||||
| 2026-02-10 | 13F | Crestmont Private Wealth LLC | 4.894 | -1,11 | 793 | -4,92 | ||||
| 2026-02-11 | 13F | Rise Advisors, LLC | 0 | -100,00 | 0 | |||||
| 2026-02-13 | 13F | SYM FINANCIAL Corp | 2.187 | 1,06 | 354 | -2,75 | ||||
| 2026-02-17 | 13F/A | Northwest & Ethical Investments L.P. | 4.037 | -35,42 | 659 | -37,33 | ||||
| 2026-01-22 | 13F | Personal Cfo Solutions, Llc | 1.356 | -8,50 | 220 | -12,05 | ||||
| 2026-02-12 | 13F | Rossby Financial, LCC | 1.057 | -43,93 | 171 | -44,12 | ||||
| 2026-02-13 | 13F | Neuberger Berman Group LLC | 792.581 | 12,19 | 128.366 | 7,85 | ||||
| 2026-02-17 | 13F | MGB Wealth Management, LLC | 6.216 | 6,18 | 1.008 | 2,34 | ||||
| 2026-01-23 | 13F | FSM Wealth Advisors, LLC | 1.728 | -53,85 | 280 | -55,71 | ||||
| 2026-04-24 | 13F | Private Advisor Group, LLC | 31.899 | -9,78 | 5.017 | -12,38 | ||||
| 2025-11-14 | 13F | ExodusPoint Capital Management, LP | 3.648 | -69,45 | 615 | 30.600,00 | ||||
| 2026-04-13 | 13F | Allen Mooney & Barnes Investment Advisors LLC | 7.316 | 0,41 | 1.151 | -2,54 | ||||
| 2026-01-20 | 13F | Independence Bank of Kentucky | 17.531 | 4,77 | 2.839 | 0,71 | ||||
| 2026-02-09 | 13F | Frazier Financial Advisors, LLC | 226 | 0,00 | 37 | -5,26 | ||||
| 2026-02-17 | 13F | Raymond James Financial Inc | 2.803.898 | 15,44 | 454.484 | 11,06 | ||||
| 2026-01-20 | 13F | Stratos Wealth Partners, LTD. | 35.689 | -0,76 | 5.780 | -4,59 | ||||
| 2026-02-13 | 13F | Sofos Investments, Inc. | 0 | -100,00 | 0 | |||||
| 2026-04-22 | 13F | Janney Montgomery Scott LLC | 42.886 | 3,73 | 7 | 0,00 | ||||
| 2026-02-10 | 13F | Harfst & Associates, Inc. | 1.465 | -5,18 | 237 | -8,85 | ||||
| 2026-02-17 | 13F | Freestone Grove Partners LP | 369.580 | 59.857 | ||||||
| 2026-02-13 | 13F | Kempen Capital Management N.v. | 49.724 | -24,54 | 8.053 | -27,46 | ||||
| 2026-02-12 | 13F | StoneX Group Inc. | 8.196 | 5,67 | 1.328 | 1,61 | ||||
| 2026-02-17 | 13F/A | Cantor Fitzgerald, L. P. | 0 | -100,00 | 0 | -100,00 | ||||
| 2026-02-04 | 13F | Paradigm Asset Management Co Llc | 5.781 | -6,47 | 936 | -10,09 | ||||
| 2026-02-04 | 13F | C WorldWide Group Holding A/S | 1.153.223 | -16,17 | 187 | -19,48 | ||||
| 2026-04-22 | 13F | Hartmann Taylor Wealth Management, LLC | 1.570 | -0,19 | 247 | -3,15 | ||||
| 2026-02-13 | 13F | Banco Santander, S.A. | 274.792 | 25,25 | 44.505 | 20,40 | ||||
| 2026-02-18 | 13F | GWM Advisors LLC | 0 | -100,00 | 0 | |||||
| 2026-01-23 | 13F | Steigerwald, Gordon & Koch Inc. | 345 | 0,00 | 56 | -5,17 | ||||
| 2026-02-17 | 13F | Man Group plc | 102.938 | -75,53 | 16.672 | -76,48 | ||||
| 2026-02-17 | 13F | Royal Bank Of Canada | Call | 35.000 | 5.669 | |||||
| 2026-02-26 | 13F | Anchor Investment Management, LLC | 8.093 | -2,89 | 1.311 | -6,70 | ||||
| 2026-01-23 | 13F | Bowman & Co S.C. | 1.400 | -3,58 | 227 | -7,38 | ||||
| 2026-01-26 | 13F | KBC Group NV | 221.877 | -18,51 | 36 | -22,22 | ||||
| 2026-02-10 | 13F | Peapack Gladstone Financial Corp | 35.044 | -12,98 | 6 | -16,67 | ||||
| 2026-02-17 | 13F | Gillson Capital LP | 191.400 | 31 | ||||||
| 2026-02-10 | 13F | Fideuram Asset Management (Ireland) dac | 6.314 | 1.085 | ||||||
| 2026-02-23 | 13F | Wealth Preservation Advisors, LLC | 149 | 1.762,50 | 24 | 2.300,00 | ||||
| 2026-02-04 | 13F | Pacer Advisors, Inc. | 0 | -100,00 | 0 | |||||
| 2026-02-10 | 13F | Phillips Wealth Planners LLC | 3.114 | 35,80 | 535 | 46,98 | ||||
| 2026-04-21 | 13F | Quad-Cities Investment Group, LLC | 1.425 | 0,00 | 224 | -2,61 | ||||
| 2026-02-12 | 13F | Commonwealth Equity Services, Llc | 55.036 | -11,73 | 8.914 | 89.030,00 | ||||
| 2026-02-19 | 13F | Invesco Ltd. | 2.991.144 | 1,55 | 484.446 | -2,38 | ||||
| 2026-01-27 | 13F | Seeds Investor Llc | 0 | -100,00 | 0 | -100,00 | ||||
| 2026-02-05 | 13F | Requisite Capital Management, LLC | 2.185 | 354 | ||||||
| 2026-04-08 | 13F | Heritage Family Offices, LLP | 7.836 | -32,99 | 1.233 | -34,92 | ||||
| 2026-02-05 | 13F | Northwestern Mutual Investment Management Company, Llc | 18.218 | -0,14 | 2.951 | -4,00 | ||||
| 2026-02-13 | 13F | Morgan Stanley | 15.875.593 | 1,01 | 2.571.212 | -2,90 | ||||
| 2026-02-12 | 13F | Jasper Ridge Partners, L.P. | 76.000 | 0,00 | 12.309 | -3,87 | ||||
| 2026-04-03 | 13F | Investors Research Corp | 3.875 | 0,00 | 609 | -2,87 | ||||
| 2026-01-23 | 13F | JM2 Capital Inc. | 5.710 | 925 | ||||||
| 2026-02-12 | 13F | Keel Point, LLC | 25.414 | -7,24 | 4.116 | -10,83 | ||||
| 2026-04-21 | 13F | Decker Retirement Planning Inc. | 73 | 0,00 | 11 | 0,00 | ||||
| 2026-02-06 | 13F | Lazard Freres Gestion S.A.S. | 381.922 | -10,29 | 62 | -14,08 | ||||
| 2026-04-06 | 13F | CX Institutional | 4.847 | 11,94 | 1 | |||||
| 2026-02-05 | 13F | AlphaCore Capital LLC | 28.929 | 563,20 | 4.685 | 538,28 | ||||
| 2026-01-29 | 13F | Mattern Capital Management, Llc | 59.459 | 13,80 | 9.630 | 9,38 | ||||
| 2026-04-13 | 13F | Community Trust & Investment Co | 112.040 | 2,58 | 17.622 | -0,38 | ||||
| 2026-02-13 | 13F | Sands Capital Management, Llc | 5.502.896 | -3,07 | 891.249 | -6,82 | ||||
| 2026-04-15 | 13F | NorthAvenue LLC | 33 | 0,00 | 5 | 0,00 | ||||
| 2026-02-10 | 13F | Axq Capital, Lp | 6.285 | 206,88 | 1.018 | 194,78 | ||||
| 2026-02-13 | 13F | Quarry LP | 0 | -100,00 | 0 | |||||
| 2026-01-05 | 13F | Commons Capital, Llc | 6.248 | 1,56 | 1.012 | -2,41 | ||||
| 2026-02-17 | 13F | Snowden Capital Advisors LLC | 31.985 | 0,67 | 5.180 | -3,21 | ||||
| 2026-01-20 | 13F | Savvy Advisors, Inc. | 5.127 | 58,00 | 830 | 52,01 | ||||
| 2026-02-17 | 13F | Royal Bank Of Canada | 9.322.199 | 3,94 | 1.509.822 | -0,08 | ||||
| 2025-11-12 | 13F | Artisan Partners Limited Partnership | 0 | -100,00 | 0 | -100,00 | ||||
| 2026-01-29 | 13F | D.a. Davidson & Co. | 28.322 | 0,18 | 4.587 | -3,70 | ||||
| 2026-02-06 | 13F | Great Diamond Partners, LLC | 3.155 | -4,39 | 511 | -8,11 | ||||
| 2026-02-11 | 13F | West Family Investments, Inc. | 1.787 | -19,32 | 289 | -22,52 | ||||
| 2026-04-22 | 13F | Bravera Wealth | 57 | -58,99 | 9 | -63,64 | ||||
| 2026-02-17 | 13F | Fmr Llc | 5.781.477 | -2,50 | 936.368 | -6,27 | ||||
| 2026-04-20 | 13F | Financial Enhancement Group LLC | 72.446 | 5,07 | 11.681 | -1,44 | ||||
| 2025-11-06 | 13F | Mitchell Capital Management Co | 0 | -100,00 | 0 | |||||
| 2026-02-10 | 13F | Norges Bank | 8.756.655 | 1.418.228 | ||||||
| 2026-04-20 | 13F | Ronald Blue Trust, Inc. | 1.533 | -16,14 | 241 | -18,31 | ||||
| 2026-04-24 | 13F | CHICAGO TRUST Co NA | 9.712 | 54,40 | 1.528 | 50,00 | ||||
| 2026-04-24 | 13F | Ledyard National Bank | 1.525 | -0,39 | 240 | -3,24 | ||||
| 2026-02-13 | 13F | Bridgefront Capital, LLC | 6.531 | 65,34 | 1.058 | 58,95 | ||||
| 2026-04-21 | 13F | Red Tortoise LLC | 93 | 0,00 | 15 | -6,67 | ||||
| 2026-04-20 | 13F | Triangle Securities Wealth Management | 7.627 | 0,41 | 1.200 | -2,52 | ||||
| 2026-04-23 | 13F | ELCO Management Co., LLC | 8.823 | 0,00 | 1.388 | -2,87 | ||||
| 2026-04-23 | 13F | Folger Nolan Fleming Douglas Capital Management, Inc | 64.678 | 10.173 | ||||||
| 2025-11-06 | 13F | Tiff Advisory Services Inc | 0 | -100,00 | 0 | |||||
| 2026-04-17 | 13F | Essex Savings Bank | 1.323 | -13,75 | 208 | -16,13 | ||||
| 2026-02-17 | 13F | Maryland State Retirement & Pension System | 28.446 | 0,00 | 4.607 | -3,86 | ||||
| 2025-11-07 | 13F | Beacon Capital Management, LLC | 0 | -100,00 | 0 | |||||
| 2026-01-29 | 13F | Quent Capital, LLC | 730 | -5,81 | 118 | -9,23 | ||||
| 2026-04-10 | 13F | Country Trust Bank | 2.008 | 0,00 | 316 | -3,08 | ||||
| 2026-04-15 | 13F | Merit Financial Group, LLC | 14.626 | 5,66 | 2.300 | 2,63 | ||||
| 2026-04-24 | 13F | Triasima Portfolio Management inc. | 0 | -100,00 | 0 | |||||
| 2026-02-11 | 13F | Fiera Capital Corp | 70.764 | 15,56 | 11.461 | 11,09 | ||||
| 2026-02-17 | 13F | Woodline Partners LP | 97.324 | 28,65 | 15.763 | 23,66 | ||||
| 2026-02-18 | 13F | State of Tennessee, Treasury Department | 194.818 | 37,91 | 33.855 | 42,24 | ||||
| 2026-01-26 | 13F | Quadrant Private Wealth Management, LLC | 1.539 | 10,96 | 249 | 6,87 | ||||
| 2026-02-18 | 13F | EP Wealth Advisors, Inc. | 10.599 | -34,67 | 1.717 | -42,34 | ||||
| 2026-02-13 | 13F | Kilter Group LLC | 67 | -11,84 | 11 | -16,67 | ||||
| 2026-04-10 | 13F | Armstrong Advisory Group, Inc | 24 | 0,00 | 4 | 0,00 | ||||
| 2026-02-10 | 13F | Argent Trust Co | 18.838 | -20,34 | 3.051 | -23,42 | ||||
| 2026-02-17 | 13F | Sherbrooke Park Advisers Llc | 0 | -100,00 | 0 | |||||
| 2026-02-17 | 13F | Integrated Advisors Network LLC | 2.697 | -10,19 | 437 | -13,66 | ||||
| 2026-02-13 | 13F | Walleye Trading LLC | Call | 16.100 | 67,71 | 2.608 | 61,22 | |||
| 2026-04-14 | 13F | Legacy Trust | 3.240 | -0,77 | 510 | -3,60 | ||||
| 2026-02-13 | 13F | Walleye Trading LLC | 87.844 | -23,11 | 14.227 | -26,08 | ||||
| 2026-02-20 | 13F | Kovitz Investment Group Partners, LLC | 26.931 | -98,19 | 4.362 | -98,26 | ||||
| 2026-04-15 | 13F | Avanza Fonder AB | 45.624 | -1,41 | 7.176 | -4,26 | ||||
| 2026-02-13 | 13F | Walleye Trading LLC | Put | 3.600 | -47,06 | 583 | -49,08 | |||
| 2025-11-20 | 13F | Wbi Investments, Inc. | 0 | -100,00 | 0 | |||||
| 2026-01-13 | 13F | Synergy Financial Management, LLC | 0 | -100,00 | 0 | -100,00 | ||||
| 2026-02-09 | 13F | William Blair Investment Management, Llc | 33.546 | -30,87 | 5.433 | -33,54 | ||||
| 2026-02-10 | 13F | Rational Advisors Llc | 186 | 7,51 | 30 | 3,45 | ||||
| 2026-02-13 | 13F | JustInvest LLC | 89.402 | -4,42 | 14.480 | -8,16 | ||||
| 2026-02-03 | 13F | Merrithew & Thorsten Inc | 28 | 0 | ||||||
| 2026-02-06 | 13F | Cullen/frost Bankers, Inc. | 133.056 | 7,28 | 21.550 | 3,13 | ||||
| 2025-11-14 | 13F | Hollow Brook Wealth Management LLC | 0 | -100,00 | 0 | -100,00 | ||||
| 2026-02-13 | 13F | Partners Capital Investment Group, Llp | 24.959 | -17,91 | 4.042 | -21,09 | ||||
| 2026-01-06 | 13F | Tucker Asset Management Llc | 0 | -100,00 | 0 | |||||
| 2026-03-17 | 13F | Stance Capital Llc | 0 | -100,00 | 0 | |||||
| 2026-02-11 | 13F | Illinois Municipal Retirement Fund | 17.656 | -29,20 | 2.860 | -31,94 | ||||
| 2026-02-11 | 13F | Egerton Capital (UK) LLP | 0 | -100,00 | 0 | |||||
| 2026-02-17 | 13F | Signature Equity Partners, LLC | 380 | 62 | ||||||
| 2026-02-03 | 13F | Crossmark Global Holdings, Inc. | 33.423 | 18,60 | 5.413 | 14,03 | ||||
| 2026-04-21 | 13F | Wesbanco Bank Inc | 4.618 | 22,46 | 726 | 19,02 | ||||
| 2026-02-13 | 13F | Neo Ivy Capital Management | 7.206 | 1.167 | ||||||
| 2026-04-23 | 13F | Farmers & Merchants Investments Inc | 457 | 0,00 | 72 | -4,05 | ||||
| 2026-02-13 | 13F | Colony Group, LLC | 2.210.948 | 569,75 | 358.142 | 543,96 | ||||
| 2026-02-12 | 13F | JPL Wealth Management, LLC | 0 | -100,00 | 0 | |||||
| 2026-02-10 | 13F | Mitsubishi UFJ Morgan Stanley Securities Co., Ltd. | 1.415 | 843,33 | 229 | 663,33 | ||||
| 2026-02-11 | 13F | Picton Mahoney Asset Management | 98.668 | -16,51 | 15.980 | 84.005,26 | ||||
| 2026-04-22 | 13F | Avantra Family Wealth, Inc. | 8.698 | 52,28 | 1.368 | 47,89 | ||||
| 2026-02-11 | 13F | Total Wealth Planning & Management, Inc. | 1.266 | 205 | ||||||
| 2026-04-15 | 13F | Financial Management Professionals, Inc. | 45 | 0,00 | 7 | 0,00 | ||||
| 2026-02-03 | 13F | Wilson Asset Management (international) Pty Ltd | 124.446 | 0,00 | 20.155 | -3,87 | ||||
| 2026-02-17 | 13F | Lazard Asset Management Llc | 3.270.198 | -48,89 | 529.641 | -50,86 | ||||
| 2026-02-02 | 13F | Summit Place Financial Advisors, LLC | 5.782 | 0,00 | 936 | -3,90 | ||||
| 2026-02-13 | 13F | Level Four Advisory Services, Llc | 46.215 | -0,28 | 7.485 | -4,14 | ||||
| 2026-04-24 | 13F | Boston Trust Walden Corp | 1.873 | 0,00 | 295 | -2,97 | ||||
| 2026-04-15 | 13F | Journey Strategic Wealth Llc | 5.137 | 137,93 | 808 | 131,23 | ||||
| 2025-11-14 | 13F | PineBridge Investments, L.P. | 38.962 | -72,04 | 6.564 | -74,32 | ||||
| 2026-02-17 | 13F | Bank Of America Corp /de/ | Put | 0 | -100,00 | 0 | -100,00 | |||
| 2026-02-17 | 13F | Fullerton Fund Management Co Ltd | 4.975 | 13,35 | 806 | 8,93 | ||||
| 2026-04-23 | 13F | Oppenheimer & Co Inc | 5.059 | 0,60 | 796 | -2,33 | ||||
| 2026-01-29 | 13F | Middleton & Co Inc/ma | 2.128 | 0,00 | 345 | -3,91 | ||||
| 2026-02-17 | 13F | Jain Global LLC | 284.347 | 2.672,22 | 46.053 | 2.565,05 | ||||
| 2026-02-17 | 13F | Bank Of America Corp /de/ | Call | 0 | -100,00 | 0 | -100,00 | |||
| 2026-02-17 | 13F | Fwl Investment Management, Llc | 535 | 0,00 | 87 | -4,44 | ||||
| 2026-02-13 | 13F | Seneschal Advisors, LLC | 4 | 0,00 | 1 | |||||
| 2026-04-08 | 13F | Arlington Trust Co LLC | 166 | -38,29 | 26 | -39,53 | ||||
| 2026-04-17 | 13F | Webster Bank, N. A. | 23.322 | -2,24 | 3.668 | -5,05 | ||||
| 2026-04-21 | 13F | Cambient Family Office, Llc | 2.121 | 34,07 | 334 | 30,08 | ||||
| 2026-02-04 | 13F | Nicholas Company, Inc. | 437.155 | 10,14 | 70.802 | 5,88 | ||||
| 2025-11-04 | 13F | Cornerstone Wealth Management, LLC | 0 | -100,00 | 0 | |||||
| 2026-01-23 | 13F | Assetmark, Inc | 101.090 | 27,82 | 16.373 | 22,88 | ||||
| 2026-04-23 | 13F | Interchange Capital Partners, LLC | 3.418 | -21,95 | 589 | -17,07 | ||||
| 2026-04-24 | 13F | Canton Hathaway, LLC | 167 | 0,00 | 26 | -3,70 | ||||
| 2026-02-13 | 13F | Rafferty Asset Management, LLC | 173.941 | -8,69 | 28.171 | -12,23 | ||||
| 2026-02-04 | 13F | Advisor OS, LLC | 2.472 | 9,24 | 400 | 4,99 | ||||
| 2026-02-12 | 13F | Xponance, Inc. | 86.318 | 6,43 | 13.980 | 2,32 | ||||
| 2026-02-05 | 13F | Center for Financial Planning, Inc. | 342 | 0,00 | 55 | -3,51 | ||||
| 2026-02-17 | 13F | Palisade Capital Management Llc/nj | 103.971 | -7,24 | 16.839 | -10,82 | ||||
| 2025-11-14 | 13F | Texas Permanent School Fund | 0 | -100,00 | 0 | |||||
| 2026-02-06 | 13F | Covestor Ltd | 841 | 25,15 | 0 | |||||
| 2026-02-10 | 13F | Greenwich Wealth Management LLC | 18.879 | 0,52 | 3 | 0,00 | ||||
| 2026-02-13 | 13F | Mariner, LLC | 118.950 | 6,52 | 19.273 | 2,44 | ||||
| 2026-01-30 | 13F | Us Bancorp \de\ | 121.652 | -3,46 | 19.703 | -7,20 | ||||
| 2026-02-03 | 13F | Generali Asset Management SPA SGR | 41.815 | 19,98 | 6.772 | 15,35 | ||||
| 2026-02-17 | 13F | Cape Investment Advisory, Inc. | 440 | 303,67 | 71 | 294,44 | ||||
| 2026-01-28 | 13F | Citizens & Northern Corp | 8.324 | -3,34 | 1.348 | -7,03 | ||||
| 2026-02-10 | 13F | Lido Advisors, LLC | 153.258 | 0,12 | 25.551 | -0,93 | ||||
| 2026-02-23 | 13F | Mv Capital Management, Inc. | 425 | 0,24 | 69 | -11,69 | ||||
| 2026-02-17 | 13F | Northern Trust Corp | 6.921.163 | -3,15 | 1.120.952 | -6,90 | ||||
| 2026-02-09 | 13F | Atlantic Trust, LLC | 300 | -4,15 | 49 | -7,69 | ||||
| 2026-01-21 | 13F | Brown Shipley& Co Ltd | 1.125 | -0,53 | 182 | -4,21 | ||||
| 2026-02-14 | 13F | Rockefeller Capital Management L.P. | 478.497 | -11,41 | 77.502 | -14,83 | ||||
| 2026-02-17 | 13F | Tudor Investment Corp Et Al | Put | 4.400 | 713 | |||||
| 2026-02-17 | 13F | Credit Agricole S A | 58.503 | -55,70 | 9.475 | -57,41 | ||||
| 2026-02-13 | 13F | Missouri Trust & Investment Co | 3.945 | -7,61 | 639 | -11,27 | ||||
| 2026-01-30 | 13F | State of New Jersey Common Pension Fund D | 194.290 | -2,44 | 31.467 | -6,21 | ||||
| 2026-02-17 | 13F | Tudor Investment Corp Et Al | Call | 13.900 | 2.251 | |||||
| 2026-04-13 | 13F | Compass Ion Advisors, LLC | 1.937 | 4,53 | 305 | 1,33 | ||||
| 2026-02-17 | 13F | Tudor Investment Corp Et Al | 1.549 | 251 | ||||||
| 2026-02-06 | 13F | Vestmark Advisory Solutions, Inc. | 36.826 | 76,37 | 5.964 | 69,58 | ||||
| 2025-10-27 | 13F | Allen Capital Group, LLC | 0 | -100,00 | 0 | -100,00 | ||||
| 2026-02-11 | 13F | Allianz Asset Management GmbH | Put | 35.300 | 49,58 | 5.717 | 43,79 | |||
| 2026-01-28 | 13F | Leelyn Smith, LLC | 30.446 | 2,56 | 4.931 | -1,40 | ||||
| 2026-02-11 | 13F | Allianz Asset Management GmbH | Call | 25.000 | 51,52 | 4.049 | 45,70 | |||
| 2026-01-21 | 13F | Y.D. More Investments Ltd | 411 | -9,87 | 67 | -13,16 | ||||
| 2026-02-11 | 13F | Allianz Asset Management GmbH | 239.251 | -10,18 | 38.749 | -13,65 | ||||
| 2026-02-10 | 13F | DT Investment Partners, LLC | 813 | 0,00 | 132 | -3,68 | ||||
| 2026-02-13 | 13F | Chevy Chase Trust Holdings, Inc. | 291.140 | -0,77 | 47.153 | -4,61 | ||||
| 2026-04-10 | 13F | Magnus Financial Group LLC | 1.351 | -1,03 | 212 | -4,07 | ||||
| 2026-02-17 | 13F | XTX Topco Ltd | 0 | -100,00 | 0 | |||||
| 2026-02-17 | 13F | Mirabella Financial Services Llp | 1.722 | 279 | ||||||
| 2026-02-05 | 13F | Navalign, LLC | 80 | 13 | ||||||
| 2026-02-06 | 13F | Harmony Asset Management Llc | 14.177 | 0,00 | 2.296 | -3,85 | ||||
| 2026-02-13 | 13F | Bollard Group LLC | 1.749 | 21.762,50 | 0 | |||||
| 2026-04-22 | 13F | Portus Wealth Advisors, LLC | 29 | 5 | ||||||
| 2026-02-17 | 13F | Jump Financial, LLC | 64.323 | -5,62 | 10.418 | -9,28 | ||||
| 2026-04-20 | 13F | Sowell Financial Services LLC | 3.274 | -27,61 | 515 | -29,78 | ||||
| 2026-02-04 | 13F | Knuff & Co LLC | 0 | -100,00 | 0 | |||||
| 2026-01-23 | 13F | Sage Mountain Advisors LLC | 3.086 | -4,01 | 500 | -7,76 | ||||
| 2026-02-03 | 13F | Anfield Capital Management, LLC | 0 | -100,00 | 0 | |||||
| 2025-11-13 | 13F | Promus Capital, LLC | 8.828 | 2,02 | 1.487 | -6,30 | ||||
| 2026-02-13 | 13F | Dixon Mitchell Investment Counsel Inc. | 705.283 | 7,04 | 114.312 | 2,77 | ||||
| 2026-02-13 | 13F | Bridgewater Associates, LP | 47.051 | 125,96 | 7.620 | 117,22 | ||||
| 2026-02-10 | 13F | Retail Employees Superannuation Pty Ltd as trustee for Retail Employees Superannuation Trust | 45.722 | 7.405 | ||||||
| 2026-02-25 | 13F | Hahn Capital Management Llc | 56.766 | -6,20 | 9.194 | -9,84 | ||||
| 2026-04-13 | 13F | Jackson Square Capital, Llc | 2.127 | 0,00 | 335 | -2,91 | ||||
| 2026-02-13 | 13F | Quattro Advisors LLC | 268 | 43 | ||||||
| 2026-02-06 | 13F | Bare Financial Services, Inc | 21 | -66,13 | 3 | -70,00 | ||||
| 2026-02-13 | 13F | Ostrum Asset Management | 184.781 | -9,05 | 29.927 | -12,57 | ||||
| 2026-01-15 | 13F | Capital Advisors Inc/ok | 1.792 | 290 | ||||||
| 2026-02-12 | 13F | Insigneo Advisory Services, Llc | 6.267 | 2,75 | 1.015 | -1,17 | ||||
| 2026-02-06 | 13F | Associated Banc-corp | 2.307 | 0,00 | 374 | -3,87 | ||||
| 2025-11-06 | 13F | D.B. Root & Company, LLC | 0 | -100,00 | 0 | |||||
| 2026-02-17 | 13F | Main Street Financial Solutions, LLC | 6.578 | 357,44 | 1.065 | 340,08 | ||||
| 2026-02-11 | 13F | Pettyjohn, Wood & White, Inc | 19.314 | 4,13 | 3.128 | 0,13 | ||||
| 2026-02-06 | 13F | Resona Asset Management Co.,Ltd. | 176.794 | -3,94 | 28.700 | -7,40 | ||||
| 2026-02-18 | 13F | Caitlin John, LLC | 190 | 0,00 | 31 | -6,25 | ||||
| 2026-02-17 | 13F | Keebeck Wealth Management, LLC | 28.001 | -6,99 | 4.535 | -10,59 | ||||
| 2026-02-10 | 13F | Moors & Cabot, Inc. | 13.254 | -1,25 | 2.147 | -5,09 | ||||
| 2026-02-14 | 13F | Frec Markets, Inc. | 2.136 | 346 | ||||||
| 2026-04-07 | 13F/A | Round Rock Advisors, LLC | 26.036 | 0,03 | 4.217 | -3,85 | ||||
| 2026-04-16 | 13F | Consolidated Planning Corp | 0 | -100,00 | 0 | |||||
| 2026-04-24 | 13F | Vision Financial Markets Llc | 1 | 0,00 | 0 | |||||
| 2026-04-20 | 13F | Benedict Financial Advisors Inc | 20.212 | 3,51 | 3.179 | 0,51 | ||||
| 2026-02-17 | 13F | D. E. Shaw & Co., Inc. | 2.267.983 | 0,09 | 367.323 | -3,78 | ||||
| 2026-02-04 | 13F | Tsfg, Llc | 55 | -33,73 | 0 | |||||
| 2026-02-17 | 13F | D. E. Shaw & Co., Inc. | Call | 6.600 | 0,00 | 1.069 | -3,87 | |||
| 2026-04-24 | 13F | Crux Wealth Advisors | 5.198 | 299,85 | 818 | 289,05 | ||||
| 2026-02-06 | 13F | Americana Partners, LLC | 3.548 | 20,35 | 575 | 15,73 | ||||
| 2026-02-02 | 13F | Avidian Wealth Solutions, LLC | 1.674 | -7,56 | 271 | -11,15 | ||||
| 2026-04-20 | 13F | Norway Savings Bank | 16.585 | -0,38 | 2.608 | -3,26 | ||||
| 2026-01-05 | 13F | Argent Capital Management Llc | 6.500 | 0,00 | 1.053 | -3,93 | ||||
| 2026-02-11 | 13F | EULAV Asset Management | 164.833 | -44,66 | 26.696 | -46,80 | ||||
| 2026-02-04 | 13F | Nwam Llc | 2.373 | -22,48 | 411 | -14,58 | ||||
| 2026-04-23 | 13F | CWM Advisors, LLC | 3.677 | 4,40 | 578 | 1,40 | ||||
| 2026-01-23 | 13F | Halbert Hargrove Global Advisors, Llc | 0 | -100,00 | 0 | |||||
| 2026-02-02 | 13F | Danske Bank A/s | 341.054 | 11,46 | 55.237 | 7,15 | ||||
| 2026-04-17 | 13F | Brown, Lisle/cummings, Inc. | 67.744 | 0,97 | 10.655 | -1,95 | ||||
| 2026-01-27 | 13F | MASTERINVEST Kapitalanlage GmbH | 12.101 | -3,21 | 1.974 | -6,27 | ||||
| 2026-04-17 | 13F | Stephenson National Bank & Trust | 181 | 4,02 | 28 | 0,00 | ||||
| 2026-04-09 | 13F | Central Valley Advisors, Llc | 5.947 | -49,03 | 936 | -50,50 | ||||
| 2026-04-07 | 13F | Eastern Bank | 223.609 | 9,58 | 35.169 | 6,41 | ||||
| 2026-01-28 | 13F | Cape Ann Savings Bank | 7.853 | -0,06 | 1.272 | -3,93 | ||||
| 2026-02-13 | 13F | Pathstone Holdings, LLC | 98.403 | -4,13 | 15.937 | -7,84 | ||||
| 2026-02-17 | 13F | Hilltop Holdings Inc. | 8.436 | -2,96 | 1.366 | -6,69 | ||||
| 2026-02-17 | 13F | Power Wealth Management Llc | 13.579 | 11,20 | 2.199 | 6,90 | ||||
| 2026-01-30 | 13F | Urban Wealth Management, LLC | 0 | -100,00 | 0 | -100,00 | ||||
| 2026-02-13 | 13F | Tradewinds, LLC. | 1.482 | 0,82 | 240 | -2,83 | ||||
| 2026-02-02 | 13F | Sachetta, LLC | 487 | 2,96 | 79 | -1,27 | ||||
| 2026-04-15 | 13F | Lighthouse Financial Services Inc /adv | 8.388 | -1,48 | 1.359 | -1,38 | ||||
| 2026-02-17 | 13F | Blair William & Co/il | 1.690.566 | -2,27 | 273.804 | -6,05 | ||||
| 2026-03-02 | 13F | Tobam | 384 | -24,71 | 0 | |||||
| 2025-11-21 | 13F/A | CIBC Bancorp USA Inc. | 79.871 | 13.457 | ||||||
| 2026-04-22 | 13F | M3 Advisory Group, LLC | 1.531 | -0,33 | 241 | -3,23 | ||||
| 2026-02-12 | 13F | Grey Fox Wealth Advisors, LLC | 0 | -100,00 | 0 | |||||
| 2026-04-23 | 13F | PayPay Securities Corp | 11 | -31,25 | 2 | -50,00 | ||||
| 2026-02-17 | 13F | Hyposwiss Advisors SA | 365 | 59 | ||||||
| 2025-11-14 | 13F | Capstone Investment Advisors, Llc | Put | 44.400 | 16,54 | 7.481 | 7,01 | |||
| 2026-01-14 | 13F | Clarius Group, LLC | 1.470 | -46,85 | 238 | -48,93 | ||||
| 2026-02-03 | 13F | Alpha Cubed Investments, LLC | 260.129 | 226,03 | 42.130 | 213,42 | ||||
| 2026-02-06 | 13F | First Business Financial Services, Inc. | 14.745 | 2,88 | 2.388 | -1,08 | ||||
| 2025-11-14 | 13F | Capstone Investment Advisors, Llc | Call | 13.000 | -8,45 | 2.190 | -15,93 | |||
| 2026-01-16 | 13F | Trust Co Of Vermont | 58.192 | -1,15 | 9.425 | -4,98 | ||||
| 2026-02-11 | 13F | SlateStone Wealth, LLC | 1.684 | -2,04 | 0 | |||||
| 2026-02-13 | 13F | Financial Network Wealth Advisors LLC | 139 | 41,84 | 23 | 37,50 | ||||
| 2025-11-14 | 13F | Capstone Investment Advisors, Llc | 3.758 | 633 | ||||||
| 2026-02-18 | 13F/A | Empowered Funds, LLC | 21.862 | -18,01 | 3.541 | -21,19 | ||||
| 2026-01-29 | 13F | Atlas Legacy Advisors, LLC | 3.726 | 3,99 | 603 | 0,00 | ||||
| 2026-02-17 | 13F | Public Employees Retirement System Of Ohio | 227.736 | -0,07 | 36.884 | -3,94 | ||||
| 2025-11-12 | 13F | Willow Creek Wealth Management Inc. | 2.066 | -7,40 | 348 | -14,91 | ||||
| 2026-02-11 | 13F | 111 Capital | 0 | -100,00 | 0 | -100,00 | ||||
| 2026-01-22 | 13F | Massachusetts Financial Services Co /ma/ | 7.921 | -33,03 | 1.283 | -35,64 | ||||
| 2026-04-21 | 13F | Alpine Bank Wealth Management | 1.360 | 214 | ||||||
| 2026-02-14 | 13F | Howe & Rusling Inc | 134.592 | 22,61 | 21.799 | 17,87 | ||||
| 2026-04-20 | 13F | Consilium Wealth Advisory, LLC | 2.466 | -0,84 | 388 | -3,73 | ||||
| 2025-11-14 | 13F | Strategic Wealth Partners, Ltd. | 21 | 0,00 | 4 | 0,00 | ||||
| 2025-11-14 | 13F | Full Sail Capital, LLC | 12.320 | -0,34 | 2.076 | -8,51 | ||||
| 2026-02-13 | 13F | GQG Partners LLC | 0 | -100,00 | 0 | |||||
| 2026-02-03 | 13F | Cassaday & Co Wealth Management LLC | 2.021 | -8,43 | 327 | -11,86 | ||||
| 2026-04-07 | 13F | First Financial Corp /in/ | 6.119 | -0,71 | 962 | -3,61 | ||||
| 2026-02-17 | 13F | MFF Capital Investments Ltd | 11.183 | 1.811 | ||||||
| 2026-02-13 | 13F | Royal London Asset Management Ltd | 347.148 | -1,21 | 56.224 | -5,04 | ||||
| 2025-12-15 | 13F/A | Hudson Bay Capital Management LP | Put | 0 | -100,00 | 0 | -100,00 | |||
| 2026-02-10 | 13F | MainStreet Investment Advisors LLC | 20.903 | -6,24 | 3.385 | -9,88 | ||||
| 2026-02-06 | 13F | Copia Wealth Management | 10 | 0,00 | 2 | 0,00 | ||||
| 2026-02-13 | 13F | Mml Investors Services, Llc | 63.802 | 12,15 | 10.333 | 7,82 | ||||
| 2026-04-20 | 13F | One + One Wealth Management, Llc | 0 | -100,00 | 0 | |||||
| 2026-04-06 | 13F | Versant Capital Management, Inc | 1.459 | 91,22 | 229 | 86,18 | ||||
| 2026-04-21 | 13F | Keystone Financial Group, Inc. | 877 | 0,34 | 138 | -2,84 | ||||
| 2026-04-23 | 13F | Moss Adams Wealth Advisors LLC | 7.851 | 4,25 | 1.235 | 1,23 | ||||
| 2026-02-02 | 13F | Truist Financial Corp | 123.975 | 5,67 | 20.079 | 1,58 | ||||
| 2026-02-04 | 13F | National Mutual Insurance Federation of Agricultural Cooperatives | 203.000 | 26,88 | 32.878 | 21,97 | ||||
| 2026-02-11 | 13F | Jpmorgan Chase & Co | 6.883.669 | -18,83 | 1.114.879 | -21,97 | ||||
| 2026-02-09 | 13F | Cary Street Partners Financial Llc | 1.958 | -15,24 | 317 | -18,51 | ||||
| 2026-02-10 | 13F | Crescent Grove Advisors, LLC | 152.500 | 0,00 | 24.699 | -3,87 | ||||
| 2026-04-21 | 13F | PDS Planning, Inc | 3.625 | 10,79 | 570 | 7,75 | ||||
| 2026-04-09 | 13F | Arlington Partners LLC | 1.515 | 238 | ||||||
| 2026-02-13 | 13F | Inspire Advisors, LLC | 3.768 | 11,18 | 610 | 7,02 | ||||
| 2026-02-03 | 13F | Apeiron RIA LLC | 1.583 | -21,87 | 274 | -14,95 | ||||
| 2026-02-06 | 13F/A | Rathbone Brothers plc | 590.125 | 0,15 | 95.577 | -3,72 | ||||
| 2026-02-13 | 13F | Pin Oak Investment Advisors Inc | 600 | 0,00 | 0 | -100,00 | ||||
| 2026-02-23 | 13F | Beaird Harris Wealth Management, LLC | 667 | -2,06 | 108 | -5,26 | ||||
| 2026-02-17 | 13F | Cetera Investment Advisers | 123.559 | 11,53 | 20.012 | 7,21 | ||||
| 2026-01-28 | 13F | DekaBank Deutsche Girozentrale | 440.848 | 0,00 | 63 | -13,70 | ||||
| 2026-02-12 | 13F | Steward Partners Investment Advisory, Llc | 62.374 | -25,09 | 10.102 | -27,99 | ||||
| 2026-04-24 | 13F | Essex Financial Services, Inc. | 1.970 | 4,68 | 310 | 1,64 | ||||
| 2026-04-13 | 13F | Reinhart Partners, Inc. | 37.228 | 21,20 | 5.855 | 17,71 | ||||
| 2026-04-13 | 13F | Cascade Investment Advisors, Inc. | 13.951 | 0,07 | 2.194 | -2,79 | ||||
| 2026-04-22 | 13F | Invera Wealth Advisors, LLC | 10.261 | -0,18 | 1.614 | -3,06 | ||||
| 2026-02-12 | 13F | Triumph Capital Management | 12 | 2 | ||||||
| 2026-02-10 | 13F | Godfrey Financial Associates, Inc. | 7 | 1 | ||||||
| 2025-11-12 | 13F | Whalerock Point Partners, Llc | 0 | -100,00 | 0 | |||||
| 2026-04-15 | 13F | Tema Etfs Llc | 15.512 | -23,12 | 2.440 | -25,37 | ||||
| 2026-02-09 | 13F | Fidelis Capital Partners, LLC | 9.350 | -4,14 | 1.514 | -7,85 | ||||
| 2026-02-13 | 13F | L2 Asset Management, LLC | 2.867 | 6,98 | 464 | 2,88 | ||||
| 2026-02-10 | 13F | Commonwealth Of Pennsylvania Public School Empls Retrmt Sys | 132.627 | -3,52 | 21.480 | -7,25 | ||||
| 2025-11-13 | 13F | Texas Capital Bancshares Inc/tx | 18 | 3 | ||||||
| 2026-02-04 | 13F | Long Road Investment Counsel, LLC | 49.585 | -0,80 | 8.031 | -4,64 | ||||
| 2026-04-17 | 13F | Community Bank & Trust, Waco, Texas | 21.064 | -0,21 | 3 | 0,00 | ||||
| 2026-01-16 | 13F | Standard Life Aberdeen plc | 587.902 | -2,69 | 95.217 | -6,40 | ||||
| 2026-02-17 | 13F | California State Teachers Retirement System | 922.437 | -2,24 | 149.398 | -6,02 | ||||
| 2026-02-13 | 13F | PCM Encore, LLC | 3.653 | 592 | ||||||
| 2026-02-11 | 13F | Deseret Mutual Benefit Administrators | 1.236 | -6,15 | 200 | -9,50 | ||||
| 2026-04-21 | 13F | S Harris Financial Group, LLC | 2.388 | 17,17 | 376 | 13,64 | ||||
| 2026-04-16 | 13F | Generate Investment Management Ltd | 0 | -100,00 | 0 | |||||
| 2026-04-24 | 13F | United Community Bank | 851 | 1.475,93 | 134 | 1.562,50 | ||||
| 2026-02-03 | 13F | SBI Securities Co., Ltd. | 1.207 | 13,23 | 195 | 8,94 | ||||
| 2026-04-15 | 13F | Iowa State Bank | 22.060 | -0,14 | 3.470 | -3,05 | ||||
| 2025-11-14 | 13F | Concentric Capital Strategies, LP | 0 | -100,00 | 0 | |||||
| 2026-01-26 | 13F | Nicholson Wealth Management Group, LLC | 10.847 | 11,35 | 1.757 | 7,01 | ||||
| 2026-01-29 | 13F | Teachers Retirement System Of The State Of Kentucky | 104.044 | -1,39 | 17 | -5,88 | ||||
| 2026-02-05 | 13F | Bessemer Group Inc | 2.891.916 | -2,16 | 468 | -5,84 | ||||
| 2026-04-23 | 13F | Narwhal Capital Management | 52.178 | 205,38 | 8.207 | 196,57 | ||||
| 2026-02-09 | 13F/A | Swedbank AB | 3.527.115 | 43,25 | 571.252 | 37,71 | ||||
| 2026-02-11 | 13F | Peachtree Investment Partners, LLC | 0 | -100,00 | 0 | -100,00 | ||||
| 2026-01-26 | 13F | Valmark Advisers, Inc. | 2.480 | 0,73 | 402 | -3,14 | ||||
| 2026-04-13 | 13F | Loring Wolcott & Coolidge Fiduciary Advisors Llp/ma | 147 | 24 | ||||||
| 2026-02-05 | 13F | Atria Investments Llc | 36.775 | -1,56 | 5.956 | -5,37 | ||||
| 2025-12-15 | 13F/A | Hudson Bay Capital Management LP | Call | 0 | -100,00 | 0 | -100,00 | |||
| 2026-01-28 | 13F | Fiduciary Wealth Partners, LLC | 1.629 | -0,43 | 264 | -4,36 | ||||
| 2026-01-23 | 13F | Bridgewater Advisors Inc. | 2.762 | -0,47 | 467 | 16,17 | ||||
| 2026-04-17 | 13F | Cidel Asset Management Inc | 1.973 | 30,49 | 310 | 27,05 | ||||
| 2026-02-11 | 13F | Investors Towarzystwo Funduszy Inwestycyjnych Spolka Akcyjna | 4.000 | 648 | ||||||
| 2026-02-17 | 13F | Boreal Capital Management LLC | 935 | 0,00 | 151 | -3,82 | ||||
| 2026-02-13 | 13F | Charles Schwab Investment Management Inc | 3.333.693 | 0,81 | 539.925 | -3,09 | ||||
| 2026-04-13 | 13F | Massmutual Trust Co Fsb/adv | 25.285 | 4,13 | 3.977 | 1,12 | ||||
| 2026-04-20 | 13F | Heritage Wealth Management, Inc. | 3.880 | 0,00 | 610 | -2,87 | ||||
| 2026-02-17 | 13F | Susquehanna International Group, Llp | Call | 337.300 | -16,05 | 54.629 | -19,30 | |||
| 2026-04-20 | 13F | Naples Global Advisors, Llc | 17.848 | 5,29 | 2.807 | 2,26 | ||||
| 2026-02-17 | 13F | Susquehanna International Group, Llp | 101.120 | 37,18 | 16.377 | 31,88 | ||||
| 2026-02-13 | 13F | Pinnacle Wealth Planning Services, Inc. | 4.499 | -2,58 | 729 | -6,31 | ||||
| 2026-02-17 | 13F | Susquehanna International Group, Llp | Put | 186.300 | -37,15 | 30.173 | -39,58 | |||
| 2026-04-20 | 13F | Provenance Wealth Advisors, LLC | 13 | 0,00 | 2 | 0,00 | ||||
| 2026-02-06 | 13F | GPS Wealth Strategies Group, LLC | 0 | -100,00 | 0 | -100,00 | ||||
| 2026-02-17 | 13F | Kemnay Advisory Services Inc. | 226 | 37 | ||||||
| 2026-04-14 | 13F | Altrafin AG | 59.828 | 4,36 | 9.410 | 1,35 | ||||
| 2026-01-12 | 13F | CVA Family Office, LLC | 1.624 | -2,52 | 263 | -6,07 | ||||
| 2026-01-28 | 13F | Cortland Associates Inc/mo | 53.641 | -1,98 | 8.688 | -5,77 | ||||
| 2026-02-11 | 13F | Los Angeles Capital Management Llc | 2.600 | -74,56 | 386 | -77,57 | ||||
| 2026-04-14 | 13F | Roffman Miller Associates Inc /pa/ | 132.257 | 0,68 | 20.801 | -2,22 | ||||
| 2026-02-13 | 13F | Oarsman Capital, Inc. | 1.273 | -33,39 | 206 | -35,83 | ||||
| 2026-04-09 | 13F | Chemistry Wealth Management LLC | 7.703 | 0,03 | 1.211 | -2,89 | ||||
| 2026-02-13 | 13F | Healthcare Of Ontario Pension Plan Trust Fund | 946.540 | 86,60 | 153.302 | 79,38 | ||||
| 2026-02-17 | 13F | Laird Norton Trust Company, Llc | 22.392 | 3.627 | ||||||
| 2026-04-17 | 13F | Amarillo National Bank | 1.656 | 0,00 | 260 | -2,99 | ||||
| 2026-02-05 | 13F | High Note Wealth, LLC | 82 | 110,26 | 13 | 116,67 | ||||
| 2026-02-11 | 13F | Signet Private Wealth LLC | 3.476 | 563 | ||||||
| 2026-02-03 | 13F | Morse Asset Management, Inc | 24.445 | -19,11 | 3.959 | -22,24 | ||||
| 2026-02-05 | 13F | Rossmore Private Capital | 4.058 | -0,07 | 657 | -3,95 | ||||
| 2026-04-15 | 13F | Optivise Advisory Services LLC | 0 | -100,00 | 0 | |||||
| 2026-02-11 | 13F | Lyell Wealth Management, Lp | 2.503 | -2,42 | 405 | -6,25 | ||||
| 2026-02-10 | 13F | Rothschild Investment Llc | 2.057 | -0,92 | 333 | -4,58 | ||||
| 2025-11-04 | 13F | Pineridge Advisors LLC | 74 | -30,84 | 12 | -36,84 | ||||
| 2026-01-16 | 13F | Applied Capital LLC/FL | 3.337 | 0,00 | 540 | -3,91 | ||||
| 2026-04-08 | 13F | Dover Advisors, Llc | 6.861 | 29,87 | 1.079 | 26,20 | ||||
| 2026-02-13 | 13F | First Trust Advisors Lp | 342.756 | 17,55 | 55.513 | 13,00 | ||||
| 2026-04-09 | 13F | Shulman DeMeo Asset Management LLC | 10.097 | 1.588 | ||||||
| 2026-02-17 | 13F | Prelude Capital Management, Llc | 1.528 | 247 | ||||||
| 2026-01-12 | 13F | National Wealth Management Group, LLC | 3.230 | 523 | ||||||
| 2026-04-07 | 13F | CoreCap Advisors, LLC | 5.414 | 8,87 | 852 | 5,71 | ||||
| 2026-02-10 | 13F | CIBC Asset Management Inc | 249.647 | 28,31 | 40.421 | 23,35 | ||||
| 2026-01-29 | 13F | Nippon Life Global Investors Americas, Inc. | 102.480 | 11,15 | 16.598 | 6,85 | ||||
| 2025-11-07 | 13F | Shell Asset Management Co | 21.510 | -40,63 | 4 | -50,00 | ||||
| 2026-02-19 | 13F | CI Private Wealth, LLC | 632.334 | 5,87 | 96.761 | -3,84 | ||||
| 2026-02-13 | 13F | Entropy Technologies, LP | 8.118 | 1.315 | ||||||
| 2026-04-24 | 13F | Stegent Equity Advisors, Inc. | 2.072 | 2,98 | 326 | 0,00 | ||||
| 2026-02-19 | 13F | Claris Financial LLC | 1.332 | -2,92 | 216 | -6,93 | ||||
| 2026-04-14 | 13F | Perpetual Ltd | 1.341.146 | 0,42 | 210.935 | -2,48 | ||||
| 2026-02-12 | 13F | Hudock, Inc. | 3.325 | 121,96 | 539 | 113,49 | ||||
| 2026-04-16 | 13F | Bright Rock Capital Management, Llc | 55.500 | 122,00 | 8.729 | 115,58 | ||||
| 2026-04-13 | 13F | IFP Advisors, Inc | 8.131 | 0,82 | 1.279 | -2,14 | ||||
| 2026-04-22 | 13F | Horizon Bancorp Inc /in/ | 1.193 | 1,36 | 0 | |||||
| 2026-04-16 | 13F | Quotient Wealth Partners, LLC | 2.428 | 14,91 | 382 | 11,40 | ||||
| 2026-01-30 | 13F | Valued Wealth Advisors LLC | 42 | 0,00 | 7 | -14,29 | ||||
| 2026-02-13 | 13F | Cozad Asset Management Inc | 29.609 | -9,12 | 4.795 | -12,64 | ||||
| 2026-01-16 | 13F | Bestgate Wealth Advisors, LLC | 0 | -100,00 | 0 | |||||
| 2026-04-15 | 13F | Krs Capital Management, Llc | 1.701 | 0,00 | 268 | -2,91 | ||||
| 2026-04-16 | 13F | Brookstone Capital Management | 2.464 | -51,79 | 388 | -53,20 | ||||
| 2026-02-12 | 13F | Skopos Labs, Inc. | 7.789 | 29,30 | 1.277 | 36,00 | ||||
| 2026-02-10 | 13F | Meramec Financial Planners, LLC | 94 | 16 | ||||||
| 2026-02-12 | 13F | Jane Street Group, Llc | 33.888 | -83,78 | 5.488 | -84,41 | ||||
| 2026-02-17 | 13F | Agf Management Ltd | 713.258 | -48,20 | 115.519 | -50,20 | ||||
| 2026-02-12 | 13F | Jane Street Group, Llc | Put | 6.500 | -72,69 | 1.053 | -73,76 | |||
| 2026-02-12 | 13F | Jane Street Group, Llc | Call | 318.100 | 2,91 | 51.519 | -1,07 | |||
| 2026-02-12 | 13F | Sprott Inc. | 4.481 | 1,43 | 726 | -2,55 | ||||
| 2026-02-13 | 13F | McAdam, LLC | 1.838 | 2,34 | 298 | -1,66 | ||||
| 2026-02-10 | 13F | Camden National Bank | 1.955 | 317 | ||||||
| 2026-02-05 | 13F | LGT Fund Management Co Ltd. | 37.042 | -2,20 | 6.044 | -1,88 | ||||
| 2026-02-10 | 13F | Sittner & Nelson, Llc | 9 | 0,00 | 2 | 0,00 | ||||
| 2026-02-13 | 13F | Allianz Se | 3.740 | 132,30 | 606 | 123,25 | ||||
| 2026-02-04 | 13F | Midwest Trust Co | 4.156 | -3,30 | 673 | -7,04 | ||||
| 2026-02-04 | 13F | Plato Investment Management Ltd | 16.587 | 0,00 | 2.700 | -2,67 | ||||
| 2025-10-27 | 13F | Pacific Capital Partners Ltd | 0 | -100,00 | 0 | |||||
| 2026-02-12 | 13F | Great Valley Advisor Group, Inc. | 1.332 | 215 | ||||||
| 2026-02-17 | 13F | Evercore Wealth Management, LLC | 17.312 | -0,97 | 2.804 | -4,82 | ||||
| 2026-02-13 | 13F | Bank Of Nova Scotia | 470.806 | -25,29 | 76.252 | -28,18 | ||||
| 2026-02-06 | 13F | Legato Capital Management LLC | 9.174 | -48,38 | 1.486 | -50,40 | ||||
| 2026-04-22 | 13F | James Hambro & Partners | 686.481 | -4,83 | 107.990 | -7,58 | ||||
| 2026-02-12 | 13F | Hyperion Capital Advisors LP | 76.272 | 0,00 | 12.353 | -3,87 | ||||
| 2026-04-13 | 13F | E Fund Management Co., Ltd. | 2.015 | 39,25 | 317 | 19,25 | ||||
| 2026-01-07 | 13F | Corsicana & Co. | 39 | 0,00 | 6 | 0,00 | ||||
| 2026-02-10 | 13F | Womack Financial LLC | 0 | -100,00 | 0 | -100,00 | ||||
| 2026-02-09 | 13F | CBIZ Investment Advisory Services, LLC | 11 | -78,85 | 2 | -87,50 | ||||
| 2026-02-11 | 13F | X-Square Capital, LLC | 2.594 | 6,62 | 0 | |||||
| 2026-01-21 | 13F | Crews Bank & Trust | 17.388 | -1,11 | 2.816 | -4,93 | ||||
| 2026-02-12 | 13F | Voya Investment Management Llc | 1.679.258 | -18,69 | 271.684 | -21,83 | ||||
| 2026-02-13 | 13F | Resources Investment Advisors, LLC. | 4.050 | 0,05 | 656 | -3,82 | ||||
| 2026-01-28 | 13F | Salomon & Ludwin, LLC | 351 | -13,97 | 58 | -12,12 | ||||
| 2026-01-26 | 13F | AE Wealth Management LLC | 170.024 | -38,94 | 27.537 | -41,30 | ||||
| 2026-02-13 | 13F | Sargent Investment Group, LLC | 4.936 | 799 | ||||||
| 2025-10-28 | 13F | Global Trust Asset Management, LLC | 0 | -100,00 | 0 | |||||
| 2026-04-20 | 13F | First PREMIER Bank | 400 | 0,00 | 0 | |||||
| 2026-04-24 | 13F | ProShare Advisors LLC | 114.385 | -4,82 | 17.990 | -7,57 | ||||
| 2026-04-23 | 13F | Merrion Investment Management Co, LLC | 3.037 | 0,00 | 478 | -2,85 | ||||
| 2026-02-06 | 13F | BOK Financial Private Wealth, Inc. | 15.499 | -0,77 | 2.510 | -4,60 | ||||
| 2026-02-13 | 13F | Silvant Capital Management LLC | 404 | 0,00 | 65 | -4,41 | ||||
| 2026-04-07 | 13F | Signaturefd, Llc | 10.293 | 8,42 | 1.619 | 5,27 | ||||
| 2026-04-24 | 13F | Keybank National Association/oh | 352.317 | 0,14 | 55.412 | -2,75 | ||||
| 2026-04-13 | 13F | Winthrop Advisory Group LLC | 0 | -100,00 | 0 | |||||
| 2026-02-18 | 13F | Financial Advisory Service, Inc. | 0 | -100,00 | 0 | -100,00 | ||||
| 2026-04-24 | 13F | Medallion Wealth Advisors, LLC | 132 | 0,00 | 21 | -4,76 | ||||
| 2026-04-23 | 13F | Ameliora Wealth Management Ltd. | 364 | 0,00 | 57 | -1,72 | ||||
| 2026-02-06 | 13F | Ironwood Investment Counsel, LLC | 2.592 | -7,82 | 420 | -11,42 | ||||
| 2026-04-21 | 13F | Pinnacle Wealth Management Advisory Group, LLC | 2.156 | 0,00 | 339 | -2,87 | ||||
| 2026-02-10 | 13F | Cherry Tree Wealth Management, LLC | 3 | 0,00 | 0 | |||||
| 2026-02-06 | 13F | Tortoise Investment Management, LLC | 0 | -100,00 | 0 | |||||
| 2026-04-23 | 13F | iA Global Asset Management Inc. | 174.577 | -4,73 | 27 | -6,90 | ||||
| 2026-02-05 | 13F | Isthmus Partners, Llc | 1.250 | 0,00 | 202 | -3,81 | ||||
| 2025-11-10 | 13F | Lion Street Advisors, LLC | 1.940 | 269 | ||||||
| 2025-11-05 | 13F | SPC Financial, Inc. | 24.627 | 0,85 | 4.149 | -7,39 | ||||
| 2026-02-10 | 13F | KERR FINANCIAL PLANNING Corp | 80 | 0,00 | 13 | 8,33 | ||||
| 2026-02-13 | 13F | Martingale Asset Management L P | 0 | -100,00 | 0 | |||||
| 2026-01-29 | 13F | Calamos Wealth Management LLC | 2.852 | 4,62 | 462 | 0,44 | ||||
| 2026-02-12 | 13F | CIBC Private Wealth Group, LLC | 2.348.579 | -1,17 | 380.376 | -5,00 | ||||
| 2026-02-13 | 13F | Alvarez & Marsal Private Wealth Partners, LLC | 1.340 | 217 | ||||||
| 2026-02-12 | 13F | Nuveen, LLC | 3.376.628 | 6,93 | 546.879 | 2,80 | ||||
| 2026-02-17 | 13F | MIRAE ASSET GLOBAL ETFS HOLDINGS Ltd. | 116.216 | 1,56 | 18.823 | -2,37 | ||||
| 2026-02-11 | 13F | Atlanta Consulting Group Advisors, LLC | 2.064 | 334 | ||||||
| 2026-02-05 | 13F | Peak Asset Management, LLC | 2.160 | 0,00 | 350 | -3,86 | ||||
| 2025-11-14 | 13F | Cubist Systematic Strategies, LLC | Put | 12.600 | 34,04 | 2.123 | 23,09 | |||
| 2025-11-14 | 13F | Cubist Systematic Strategies, LLC | Call | 11.600 | 54,67 | 1.954 | 42,01 | |||
| 2026-02-26 | 13F | TD Capital Management LLC | 7 | 0,00 | 1 | 0,00 | ||||
| 2026-01-05 | 13F | Chesapeake Asset Management Llc | 5 | 0,00 | 1 | |||||
| 2026-02-17 | 13F | Janus Henderson Group Plc | 6.549.596 | 6,67 | 1.055.312 | 2,02 | ||||
| 2026-02-12 | 13F | Ruane, Cunniff & Goldfarb L.P. | 2.703.907 | -1,44 | 437.925 | -5,25 | ||||
| 2026-02-17 | 13F | Fairscale Capital, LLC | 185 | 0,00 | 30 | -6,45 | ||||
| 2025-11-10 | 13F | D'Orazio & Associates, Inc. | 0 | -100,00 | 0 | |||||
| 2026-04-24 | 13F | Barnes Pettey Financial Advisors, Llc | 2.158 | 0,00 | 339 | -2,87 | ||||
| 2026-02-13 | 13F | SRS Capital Advisors, Inc. | 11.675 | -13,21 | 1.891 | -16,59 | ||||
| 2026-04-22 | 13F | Wetzel Investment Advisors, Inc. | 0 | -100,00 | 0 | |||||
| 2026-01-29 | 13F | Koa Wealth Management, LLC | 12.333 | 1.997 | ||||||
| 2026-02-13 | 13F | Kayne Anderson Rudnick Investment Management Llc | 586 | -1,35 | 95 | -5,00 | ||||
| 2025-11-13 | 13F | Heritage Wealth Advisors | 0 | -100,00 | 0 | |||||
| 2026-04-14 | 13F | Moisand Fitzgerald Tamayo, LLC | 185 | 0,00 | 29 | 0,00 | ||||
| 2026-02-13 | 13F | Venture Visionary Partners LLC | 11.570 | 342,62 | 1.874 | 325,91 | ||||
| 2026-02-13 | 13F | Alyeska Investment Group, L.P. | 0 | -100,00 | 0 | -100,00 | ||||
| 2026-01-21 | 13F | West Paces Advisors Inc. | 1.473 | 4,84 | 239 | 0,85 | ||||
| 2026-02-02 | 13F | Stuart Chaussee & Associates, Inc. | 0 | -100,00 | 0 | |||||
| 2026-04-23 | 13F | Harbor Investment Advisory, Llc | 1.270 | -16,06 | 200 | -18,78 | ||||
| 2026-02-04 | 13F | Securian Asset Management, Inc | 15.504 | -43,92 | 2.511 | -46,08 | ||||
| 2025-11-07 | 13F | GenTrust, LLC | 0 | -100,00 | 0 | |||||
| 2026-02-11 | 13F | SOUTH STATE Corp | 79.988 | 2,68 | 12.955 | -1,30 | ||||
| 2026-02-09 | 13F | Allstate Corp | 43.145 | 105,92 | 6.988 | 97,99 | ||||
| 2026-02-13 | 13F | First National Bank Of Omaha | 43.423 | 0,27 | 7.033 | -3,62 | ||||
| 2026-01-21 | 13F | Signature Resources Capital Management, LLC | 17 | 0,00 | 3 | 0,00 | ||||
| 2026-02-06 | 13F | Tredje AP-fonden | 72.518 | -67,54 | 11.745 | -68,79 | ||||
| 2026-02-12 | 13F | Great Lakes Advisors, Llc | 807.111 | -1,06 | 130.720 | -4,89 | ||||
| 2026-02-10 | 13F | National Pension Service | 1.153.586 | -16,98 | 186.835 | -20,19 | ||||
| 2026-01-29 | 13F | Sanctuary Advisors, LLC | 90.770 | -3,61 | 14.701 | -7,34 | ||||
| 2026-02-17 | 13F | Balyasny Asset Management Llc | 1.176.627 | 175,66 | 190.567 | 164,99 | ||||
| 2026-04-09 | 13F | Secure Asset Management, LLC | 13.010 | 14,49 | 2.046 | 11,20 | ||||
| 2026-04-21 | 13F | TigerOak Management, L.L.C. | 8.391 | -0,47 | 1.320 | -3,37 | ||||
| 2026-01-27 | 13F | Asset Management One Co., Ltd. | 247.744 | -0,54 | 40.617 | -3,22 | ||||
| 2026-02-05 | 13F | North Dakota State Investment Board | 19.564 | 3.169 | ||||||
| 2026-01-08 | 13F | Sound View Wealth Advisors Group, LLC | 2.644 | 2,76 | 428 | -1,15 | ||||
| 2026-02-02 | 13F | Farmers & Merchants Trust Co of Chambersburg PA | 0 | -100,00 | 0 | |||||
| 2026-02-09 | 13F | Mizuho Securities Usa Llc | 41.517 | -0,42 | 6.531 | -11,30 | ||||
| 2026-04-24 | 13F | Sumitomo Mitsui DS Asset Management Company, Ltd | 75.822 | 1,74 | 11.925 | -1,20 | ||||
| 2026-02-05 | 13F | DnB Asset Management AS | 134.591 | -47,71 | 21.798 | -49,73 | ||||
| 2026-04-13 | 13F | Cyndeo Wealth Partners, LLC | 12.797 | 9,80 | 2.013 | 6,62 | ||||
| 2026-01-27 | 13F | Checchi Capital Advisers, LLC | 4.490 | -9,77 | 727 | -13,25 | ||||
| 2026-04-21 | 13F | Buttonwood Financial Advisors Inc. | 5.141 | -0,21 | 809 | -3,12 | ||||
| 2026-02-12 | 13F | Snyder Capital Management L P | 453.290 | 7,82 | 73.415 | 3,65 | ||||
| 2026-01-22 | 13F | Demars Financial Group, LLC | 3.596 | 2,42 | 582 | -1,52 | ||||
| 2026-02-26 | 13F/A | Aristides Capital LLC | 10.000 | 1.620 | ||||||
| 2026-02-05 | 13F | IMG Wealth Management, Inc. | 30 | 25,00 | 5 | 0,00 | ||||
| 2025-11-17 | 13F | FSA Wealth Management LLC | 198 | 0,51 | 33 | -8,33 | ||||
| 2026-04-24 | 13F | Stock Yards Bank & Trust Co | 2.621 | -3,14 | 412 | -5,94 | ||||
| 2026-02-10 | 13F | Pecaut & Co. | 17.302 | -6,48 | 2.802 | -10,08 | ||||
| 2026-02-10 | 13F | Goldman Sachs Group Inc | 3.947.380 | 1,84 | 639.318 | -2,10 | ||||
| 2026-02-13 | 13F | Glen Eagle Advisors, LLC | 2.322 | 1,13 | 376 | -2,85 | ||||
| 2026-02-13 | 13F | Seven Mile Advisory | 0 | -100,00 | 0 | |||||
| 2026-02-09 | 13F | HBK Sorce Advisory LLC | 1.605 | 12,55 | 271 | 20,98 | ||||
| 2026-02-10 | 13F | Goldman Sachs Group Inc | Call | 42.100 | 17,27 | 6.819 | 12,73 | |||
| 2026-02-13 | 13F | First Long Island Investors, LLC | 1.700 | 0,00 | 275 | -3,85 | ||||
| 2026-02-10 | 13F | Goldman Sachs Group Inc | Put | 224.900 | 18,43 | 36.425 | 13,85 | |||
| 2026-04-14 | 13F | Grant Private Wealth Management Inc | 2.450 | 0,00 | 385 | -2,78 | ||||
| 2026-01-16 | 13F | Empirical Financial Services, LLC d.b.a. Empirical Wealth Management | 1.272 | 206 | ||||||
| 2026-04-17 | 13F | Union Savings Bank | 1.256 | 0,00 | 198 | -2,96 | ||||
| 2026-02-10 | 13F | Gulf International Bank (UK) Ltd | 28.992 | 0,22 | 5 | 0,00 | ||||
| 2026-02-12 | 13F | AlphaCentric Advisors LLC | 1.185 | 192 | ||||||
| 2026-02-17 | 13F | Tower Research Capital LLC (TRC) | 17.864 | -10,49 | 2.893 | -13,95 | ||||
| 2026-02-17 | 13F | Worldquant Millennium Advisors Llc | 96.116 | -6,04 | 15.567 | -9,68 | ||||
| 2026-02-13 | 13F | Tower Bridge Advisors | 89.614 | 15,48 | 14.514 | 11,01 | ||||
| 2026-02-11 | 13F | Mattson Financial Services, LLC | 0 | -100,00 | 0 | |||||
| 2026-02-27 | 13F | Groupama Asset Managment | 4.225 | -6,75 | 681 | -10,75 | ||||
| 2026-04-15 | 13F | Verum Partners LLC | 1.686 | 1,51 | 265 | -1,49 | ||||
| 2026-04-13 | 13F | GoalVest Advisory LLC | 1.450 | 0,00 | 228 | -2,56 | ||||
| 2026-04-15 | 13F | Aspen Investment Management Inc | 13.322 | 0,23 | 2 | 0,00 | ||||
| 2026-04-17 | 13F | Fifth Third Wealth Advisors LLC | 14.650 | 11,74 | 2.304 | 8,53 | ||||
| 2026-04-24 | 13F | Ninety One North America, Inc. | 24.076 | -6,45 | 3.787 | -9,17 | ||||
| 2026-02-13 | 13F | Lavaca Capital Llc | 400 | 0,00 | 65 | -4,48 | ||||
| 2026-02-05 | 13F | Gabelli Funds Llc | 37.330 | -2,41 | 6.046 | -6,19 | ||||
| 2026-04-21 | 13F | Pinnacle Associates Ltd | 14.816 | 0,82 | 2.330 | -2,10 | ||||
| 2026-02-17 | 13F | Strive Financial Group ,LLC | 14.421 | 2.336 | ||||||
| 2026-02-13 | 13F | LGT Financial Advisors LLC | 74 | 0,00 | 12 | 0,00 | ||||
| 2026-02-02 | 13F | Horizon Investments, LLC | 20.814 | -42,93 | 3.371 | -45,13 | ||||
| 2026-04-08 | 13F | Legacy Wealth Asset Management, LLC | 9.423 | 4,76 | 1.482 | 1,79 | ||||
| 2026-04-08 | 13F | Castle Rock Wealth Management, LLC | 9.421 | 5,07 | 1.535 | 4,56 | ||||
| 2026-03-12 | 13F/A | Peak6 Llc | Call | 25.500 | 9,44 | 4.130 | 5,20 | |||
| 2026-04-22 | 13F | Atlantic Edge Private Wealth Management, LLC | 140 | 0,00 | 22 | 0,00 | ||||
| 2026-02-11 | 13F | Paces Ferry Wealth Advisors, Llc | 1.314 | 0,15 | 213 | -3,64 | ||||
| 2026-02-13 | 13F | Evelyn Partners Investment Management Services Ltd | 2.377 | -6,53 | 385 | -10,28 | ||||
| 2026-03-12 | 13F/A | Peak6 Llc | 11.074 | 1.794 | ||||||
| 2026-03-12 | 13F/A | Peak6 Llc | Put | 400 | 65 | |||||
| 2026-01-16 | 13F | Selective Wealth Management, Inc. | 2.000 | -1,48 | 347 | 5,49 | ||||
| 2026-04-21 | 13F | Robeco Institutional Asset Management B.V. | 1.541.264 | 27,10 | 242.410 | 23,42 | ||||
| 2026-01-30 | 13F | Wealthfront Advisers Llc | 53.119 | 3,41 | 8.603 | -0,58 | ||||
| 2026-02-06 | 13F | Van Hulzen Asset Management, LLC | 12.975 | -1,14 | 2.101 | -4,98 | ||||
| 2026-02-17 | 13F | Adage Capital Partners Gp, L.l.c. | 514.759 | -9,78 | 83.370 | -13,27 | ||||
| 2026-01-15 | 13F | J. Safra Sarasin Holding AG | 2.116 | 46,94 | 343 | 41,32 | ||||
| 2026-02-17 | 13F | Edmond De Rothschild Holding S.a. | 2.500 | 56,25 | 405 | 50,19 | ||||
| 2026-02-10 | 13F | SCS Capital Management LLC | 1.851 | 30,35 | 300 | 25,10 | ||||
| 2026-02-09 | 13F | Geode Capital Management, Llc | 12.501.742 | -0,55 | 2.015.379 | -4,38 | ||||
| 2025-10-29 | 13F | Rede Wealth, LLC | 0 | -100,00 | 0 | -100,00 | ||||
| 2026-01-16 | 13F | Longboard Asset Management, LP | 0 | -100,00 | 0 | |||||
| 2026-02-06 | 13F | Saranac Partners Ltd | 52.479 | 29,01 | 8.509 | 24,22 | ||||
| 2026-02-17 | 13F | Element Capital Management Llc | 6.993 | 1.133 | ||||||
| 2026-01-20 | 13F | Stratos Wealth Advisors, LLC | 2.994 | -3,85 | 485 | -7,63 | ||||
| 2026-04-23 | 13F | Caliber Wealth Management, LLC / KS | 1.574 | 9,46 | 248 | 6,47 | ||||
| 2026-02-03 | 13F | Strengthening Families & Communities, LLC | 5.572 | -4,69 | 902 | -7,96 | ||||
| 2026-02-10 | 13F | Transatlantique Private Wealth Llc | 5.959 | -2,88 | 965 | -6,58 | ||||
| 2026-01-28 | 13F | B. Metzler seel. Sohn & Co. AG | 55.176 | -25,43 | 8.937 | -28,31 | ||||
| 2026-01-23 | 13F | Avion Wealth | 78 | 20,00 | 0 | |||||
| 2026-02-12 | 13F | Cloud Capital Management, LLC | 0 | -100,00 | 0 | |||||
| 2026-01-30 | 13F | Simplicity Wealth,LLC | 0 | -100,00 | 0 | -100,00 | ||||
| 2026-04-22 | 13F | Canoe Financial LP | 461.480 | -51,50 | 72.582 | -52,90 | ||||
| 2026-02-03 | 13F | Costello Asset Management, INC | 10 | 2 | ||||||
| 2026-02-17 | 13F | VestGen Advisors, LLC | 15.921 | -10,37 | 2.579 | -13,84 | ||||
| 2026-04-20 | 13F | First American Bank | 79.912 | 2,12 | 12.569 | -0,84 | ||||
| 2026-02-13 | 13F | Towarzystwo Funduszy Inwestycyjnych Pzu Sa | 760 | 0,00 | 123 | -3,91 | ||||
| 2026-01-30 | 13F | Bogart Wealth, LLC | 38 | -15,56 | 6 | -14,29 | ||||
| 2026-02-13 | 13F | Carmignac Gestion | 1.375.560 | 19,18 | 222.813 | 14,59 | ||||
| 2026-02-06 | 13F | New Millennium Group LLC | 182 | -0,55 | 29 | -3,33 | ||||
| 2026-04-15 | 13F | Badgley Phelps Wealth Managers, LLC | 0 | -100,00 | 0 | |||||
| 2026-02-17 | 13F | IHT Wealth Management, LLC | 1.375 | -1,22 | 223 | -5,13 | ||||
| 2026-04-15 | 13F | Oak Asset Management, LLC | 24.290 | 0,00 | 3.820 | -2,90 | ||||
| 2026-04-20 | 13F | YANKCOM Partnership | 10 | 0,00 | 2 | 0,00 | ||||
| 2026-02-12 | 13F | First Western Trust Bank | 21.618 | -1,40 | 3.501 | -5,22 | ||||
| 2026-02-06 | 13F | Cedar Wealth Management, LLC | 208 | 0,00 | 34 | -5,71 | ||||
| 2026-02-11 | 13F | IMA Wealth, Inc. | 254 | 0,00 | 41 | -2,38 | ||||
| 2026-02-05 | 13F | Canada Post Corp Registered Pension Plan | 14.539 | 26,44 | 2.355 | 21,91 | ||||
| 2026-02-17 | 13F | Clark Capital Management Group, Inc. | 2.164 | 44,36 | 350 | 38,89 | ||||
| 2026-02-11 | 13F | Motley Fool Asset Management LLC | 53.037 | 34,21 | 8.590 | 29,02 | ||||
| 2026-02-06 | 13F | Mach-1 Financial Group, Inc. | 1.692 | 2,98 | 274 | -0,72 | ||||
| 2026-04-09 | 13F | Veracity Capital LLC | 1.873 | -4,63 | 295 | -7,55 | ||||
| 2026-02-13 | 13F | American Century Companies Inc | 185.178 | -2,82 | 29.992 | -6,58 | ||||
| 2026-04-02 | 13F | Hilltop National Bank | 151 | 202,00 | 24 | 187,50 | ||||
| 2026-02-02 | 13F | Pittenger & Anderson Inc | 8.000 | 0,00 | 1.296 | -3,86 | ||||
| 2026-02-06 | 13F | Larson Financial Group LLC | 2.578 | -32,32 | 418 | -34,95 | ||||
| 2026-01-22 | 13F | Ofi Invest Asset Management | 400.544 | 51.986,35 | 55.344 | 50.211,82 | ||||
| 2026-02-13 | 13F | Klingenstein Fields & Co Lp | 2.974 | -11,38 | 482 | -14,87 | ||||
| 2026-02-17 | 13F | Investment Management Corp of Ontario | 47.845 | 64,06 | 7.749 | 57,70 | ||||
| 2026-04-24 | 13F | RKL Wealth Management LLC | 19.973 | -4,49 | 3.141 | -7,26 | ||||
| 2026-04-08 | 13F | Brady Family Wealth, Llc | 2.513 | 0,00 | 395 | -2,95 | ||||
| 2026-02-17 | 13F | Herold Advisors, Inc. | 4.771 | -6,83 | 773 | -10,44 | ||||
| 2026-04-09 | 13F | Park Place Capital Corp | 261 | -1,51 | 41 | -2,38 | ||||
| 2026-02-03 | 13F | Stiles Financial Services Inc | 4.344 | 22,71 | 704 | 17,95 | ||||
| 2026-04-23 | 13F | American National Bank | 548 | 0,00 | 86 | -2,27 | ||||
| 2026-02-09 | 13F | Choate Investment Advisors | 3.875 | 0,41 | 628 | -3,54 | ||||
| 2026-02-04 | 13F | Income Insurance Ltd | 1.706 | 276 | ||||||
| 2026-02-10 | 13F | Heritage Trust Co | 28.600 | -1,29 | 4.632 | -5,10 | ||||
| 2026-02-09 | 13F | Leavell Investment Management, Inc. | 29.278 | 0,00 | 4.742 | -3,87 | ||||
| 2026-02-13 | 13F | Findlay Park Partners LLP | 975.669 | 0,39 | 158.019 | -3,49 | ||||
| 2026-01-15 | 13F | Boston Common Asset Management, LLC | 0 | -100,00 | 0 | |||||
| 2026-02-13 | 13F | Global Endowment Management, LP | 1.635 | -3,37 | 265 | -7,02 | ||||
| 2025-11-14 | 13F | Sustainable Insight Capital Management, LLC | 0 | -100,00 | 0 | |||||
| 2026-04-24 | 13F | Bayban | 52 | 0,00 | 8 | 0,00 | ||||
| 2026-02-17 | 13F | Millennium Management Llc | 2.393.506 | 54,39 | 387.652 | 48,41 | ||||
| 2026-02-17 | 13F | Millennium Management Llc | Put | 46.300 | 7,93 | 7.499 | 3,75 | |||
| 2026-01-26 | 13F | SeaBridge Investment Advisors LLC | 32.405 | -6,74 | 5.248 | -10,35 | ||||
| 2026-02-05 | 13F | Qsemble Capital Management, LP | 38.350 | 6.211 | ||||||
| 2026-01-29 | 13F | RMG Wealth Management LLC | 76 | 660,00 | 13 | 1.200,00 | ||||
| 2026-04-10 | 13F/A | OP Asset Management Ltd | 58.195 | -6,96 | 9.153 | -9,65 |