Grundlæggende statistik
| Porteføljeværdi | $ 260.351.322 |
| Nuværende stillinger | 85 |
Seneste beholdninger, ydeevne, AUM (fra 13F, 13D)
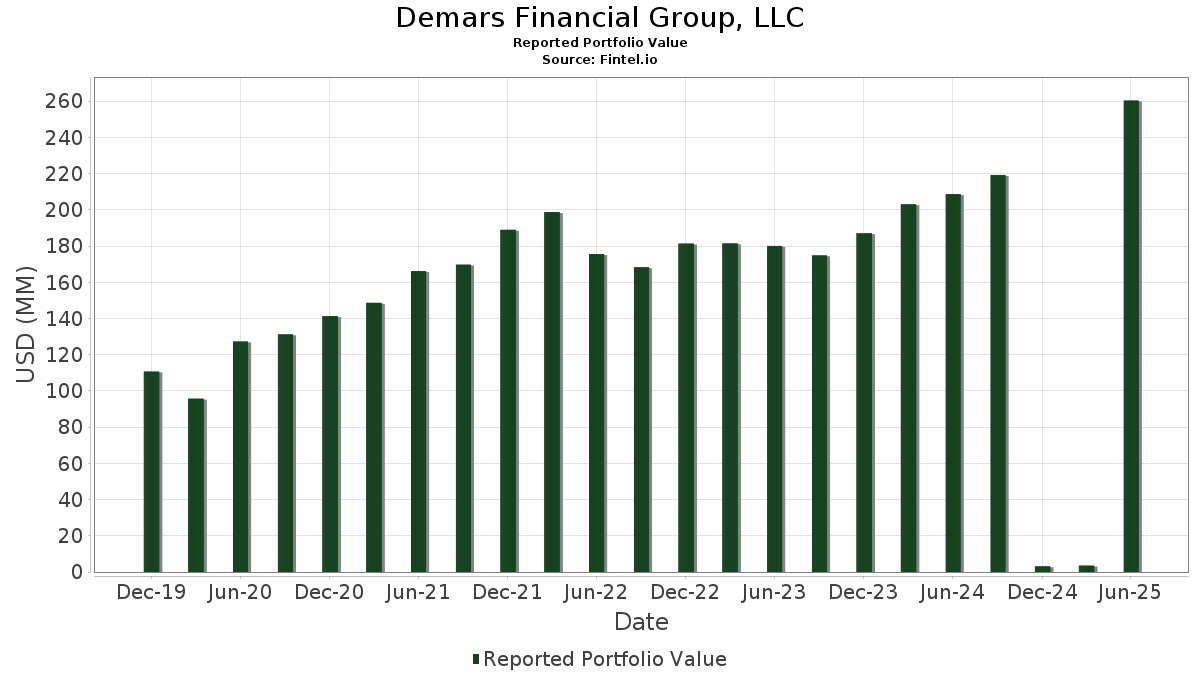
Demars Financial Group, LLC har afsløret 85 samlede besiddelser i deres seneste SEC-arkivering. Den seneste porteføljeværdi er beregnet til at være $ 260.351.322 USD. Faktiske aktiver under forvaltning (AUM) er denne værdi plus kontanter (som ikke er oplyst). Demars Financial Group, LLCs største beholdninger er Invesco Exchange-Traded Fund Trust - Invesco S&P 500 Quality ETF (US:SPHQ) , iShares Trust - iShares Floating Rate Bond ETF (US:FLOT) , Invesco Exchange-Traded Fund Trust - Invesco S&P 500 Top 50 ETF (US:XLG) , iShares Trust - iShares S&P 100 ETF (US:OEF) , and Berkshire Hathaway Inc. (US:BRK.B) . Demars Financial Group, LLCs nye stillinger omfatter Invesco Exchange-Traded Fund Trust - Invesco S&P 500 Quality ETF (US:SPHQ) , SPDR Index Shares Funds - SPDR EURO STOXX 50 ETF (US:FEZ) , ProShares Trust - ProShares UltraPro QQQ (US:TQQQ) , Fidelity Wise Origin Bitcoin Fund (US:FBTC) , and iShares Trust - iShares 0-3 Month Treasury Bond ETF (US:SGOV) .
Top øger dette kvartal
Vi bruger ændringen i porteføljeallokeringen, fordi dette er den mest meningsfulde metrik. Ændringer kan skyldes handler eller ændringer i aktiekurser.
| Sikkerhed | Aktier (MM) |
Værdi (MM$) |
Portefølje % | ΔPortefølje % |
|---|---|---|---|---|
| 0,57 | 40,77 | 15,6601 | 15,6601 | |
| 0,10 | 30,28 | 11,6320 | 6,2810 | |
| 0,03 | 14,50 | 5,5693 | 5,5295 | |
| 0,05 | 7,38 | 2,8333 | 1,5649 | |
| 0,07 | 3,93 | 1,5111 | 1,5111 | |
| 0,04 | 3,38 | 1,2990 | 1,2990 | |
| 0,03 | 4,80 | 1,8438 | 0,9194 | |
| 0,03 | 5,13 | 1,9703 | 0,7470 | |
| 0,04 | 5,15 | 1,9780 | 0,7337 | |
| 0,01 | 2,27 | 0,8732 | 0,5887 |
Top falder i dette kvartal
Vi bruger ændringen i porteføljeallokeringen, fordi dette er den mest meningsfulde metrik. Ændringer kan skyldes handler eller ændringer i aktiekurser.
| Sikkerhed | Aktier (MM) |
Værdi (MM$) |
Portefølje % | ΔPortefølje % |
|---|---|---|---|---|
| 0,51 | 13,12 | 5,0383 | -8,9966 | |
| 0,06 | 2,92 | 1,1233 | -8,6004 | |
| 0,76 | 38,98 | 14,9732 | -7,1208 | |
| 0,74 | 38,47 | 14,7774 | -2,6546 | |
| 0,02 | 0,83 | 0,3181 | -2,1431 | |
| 0,09 | 2,66 | 1,0226 | -1,4170 | |
| 0,00 | 0,33 | 0,1250 | -1,3970 | |
| 0,11 | 0,45 | 0,1743 | -1,3501 | |
| 0,00 | 0,25 | 0,0948 | -1,0021 | |
| 0,06 | 1,71 | 0,6561 | -0,9631 |
13F og Fondsarkivering
Denne formular blev indsendt den 2025-07-30 for rapporteringsperioden 2025-06-30. Klik på linkikonet for at se den fulde transaktionshistorik.
Opgrader for at låse op for premium-data og eksportere til Excel ![]() .
.
| Sikkerhed | Type | Gennemsnitlig aktiekurs | Aktier (MM) |
Δ Aktier (%) |
Δ Aktier (%) |
Værdi ($MM) |
Portefølje (%) |
ΔPortefølje (%) |
|
|---|---|---|---|---|---|---|---|---|---|
| SPHQ / Invesco Exchange-Traded Fund Trust - Invesco S&P 500 Quality ETF | 0,57 | 40,77 | 15,6601 | 15,6601 | |||||
| FLOT / iShares Trust - iShares Floating Rate Bond ETF | 0,76 | -98,06 | 38,98 | 4.942,95 | 14,9732 | -7,1208 | |||
| XLG / Invesco Exchange-Traded Fund Trust - Invesco S&P 500 Top 50 ETF | 0,74 | -97,37 | 38,47 | 6.207,05 | 14,7774 | -2,6546 | |||
| OEF / iShares Trust - iShares S&P 100 ETF | 0,10 | -99,80 | 30,28 | 16.094,65 | 11,6320 | 6,2810 | |||
| BRK.B / Berkshire Hathaway Inc. | 0,03 | -95,97 | 14,50 | 1.449.800,00 | 5,5693 | 5,5295 | |||
| FLTR / VanEck ETF Trust - VanEck IG Floating Rate ETF | 0,51 | -95,90 | 13,12 | 2.571,49 | 5,0383 | -8,9966 | |||
| NVDA / NVIDIA Corporation | 0,05 | -99,03 | 7,38 | 16.663,64 | 2,8333 | 1,5649 | |||
| BWXT / BWX Technologies, Inc. | 0,04 | -99,17 | 5,15 | 11.874,42 | 1,9780 | 0,7337 | |||
| AAPL / Apple Inc. | 0,03 | -99,74 | 5,13 | 12.111,90 | 1,9703 | 0,7470 | |||
| MPC / Marathon Petroleum Corporation | 0,03 | -99,39 | 4,80 | 14.900,00 | 1,8438 | 0,9194 | |||
| MCHI / iShares Trust - iShares MSCI China ETF | 0,08 | -98,11 | 4,18 | 5.619,18 | 1,6038 | -0,5045 | |||
| FEZ / SPDR Index Shares Funds - SPDR EURO STOXX 50 ETF | 0,07 | 3,93 | 1,5111 | 1,5111 | |||||
| TQQQ / ProShares Trust - ProShares UltraPro QQQ | 0,04 | 3,38 | 1,2990 | 1,2990 | |||||
| SPYV / SPDR Series Trust - SPDR Portfolio S&P 500 Value ETF | 0,06 | -99,68 | 2,92 | 760,00 | 1,1233 | -8,6004 | |||
| CEF / Sprott Physical Gold and Silver Trust | 0,09 | -96,35 | 2,66 | 3.031,76 | 1,0226 | -1,4170 | |||
| STXG / EA Series Trust - Strive 1000 Growth ETF | 0,05 | -97,42 | 2,34 | 4.679,59 | 0,8997 | -0,5080 | |||
| AMZN / Amazon.com, Inc. | 0,01 | -99,45 | 2,27 | 25.155,56 | 0,8732 | 0,5887 | |||
| CB / Chubb Limited | 0,01 | -99,91 | 1,71 | 8.455,00 | 0,6575 | 0,0673 | |||
| FHEQ / Fidelity Greenwood Street Trust - Fidelity Hedged Equity Fund | 0,06 | -96,03 | 1,71 | 2.950,00 | 0,6561 | -0,9631 | |||
| MSFT / Microsoft Corporation | 0,00 | -99,73 | 1,60 | 53.366,67 | 0,6164 | 0,5249 | |||
| CVX / Chevron Corporation | 0,01 | 1,16 | 0,4458 | 0,4458 | |||||
| WPC / W. P. Carey Inc. | 0,02 | -98,30 | 1,12 | 6.925,00 | 0,4319 | -0,0483 | |||
| MA / Mastercard Incorporated | 0,00 | -99,81 | 1,12 | 111.500,00 | 0,4289 | 0,3757 | |||
| FSLR / First Solar, Inc. | 0,01 | -98,93 | 1,08 | 26.950,00 | 0,4158 | 0,2773 | |||
| GOOG / Alphabet Inc. | 0,01 | -99,31 | 1,00 | 19.820,00 | 0,3829 | 0,2344 | |||
| IWF / iShares Trust - iShares Russell 1000 Growth ETF | 0,00 | -99,72 | 0,89 | 44.350,00 | 0,3415 | 0,2830 | |||
| IJH / iShares Trust - iShares Core S&P Mid-Cap ETF | 0,01 | -98,35 | 0,89 | 6.235,71 | 0,3408 | -0,0844 | |||
| PEP / PepsiCo, Inc. | 0,01 | -99,32 | 0,88 | 14.550,00 | 0,3379 | 0,1521 | |||
| SCHD / Schwab Strategic Trust - Schwab U.S. Dividend Equity ETF | 0,03 | -96,18 | 0,84 | 2.803,45 | 0,3235 | -0,5278 | |||
| BMY / Bristol-Myers Squibb Company | 0,02 | -98,14 | 0,83 | 5.446,67 | 0,3198 | -0,1328 | |||
| FSTA / Fidelity Covington Trust - Fidelity MSCI Consumer Staples Index ETF | 0,02 | -99,63 | 0,83 | 862,79 | 0,3181 | -2,1431 | |||
| SHOC / EA Series Trust - Strive U.S. Semiconductor ETF | 0,01 | -97,37 | 0,77 | 5.823,08 | 0,2961 | -0,1013 | |||
| XLE / The Select Sector SPDR Trust - The Energy Select Sector SPDR Fund | 0,01 | -99,26 | 0,76 | 6.250,00 | 0,2927 | -0,0782 | |||
| AVA / Avista Corporation | 0,02 | -97,10 | 0,75 | 4.600,00 | 0,2890 | -0,1768 | |||
| POWL / Powell Industries, Inc. | 0,00 | -98,99 | 0,73 | 36.350,00 | 0,2803 | 0,2225 | |||
| HD / The Home Depot, Inc. | 0,00 | -99,71 | 0,72 | 71.400,00 | 0,2750 | 0,2221 | |||
| EOG / EOG Resources, Inc. | 0,01 | -99,13 | 0,71 | 14.180,00 | 0,2746 | 0,1215 | |||
| CME / CME Group Inc. | 0,00 | -99,58 | 0,71 | 35.500,00 | 0,2737 | 0,2079 | |||
| FBTC / Fidelity Wise Origin Bitcoin Fund | 0,01 | 0,70 | 0,2700 | 0,2700 | |||||
| O / Realty Income Corporation | 0,01 | -98,18 | 0,68 | 6.118,18 | 0,2629 | -0,0586 | |||
| CRM / Salesforce, Inc. | 0,00 | -99,59 | 0,64 | 32.100,00 | 0,2475 | 0,1862 | |||
| MLPA / Global X Funds - Global X MLP ETF | 0,01 | -97,91 | 0,64 | 5.700,00 | 0,2454 | -0,0813 | |||
| ICE / Intercontinental Exchange, Inc. | 0,00 | -99,36 | 0,60 | 29.950,00 | 0,2312 | 0,1457 | |||
| TSM / Taiwan Semiconductor Manufacturing Company Limited - Depositary Receipt (Common Stock) | 0,00 | -99,31 | 0,60 | 29.900,00 | 0,2307 | 0,1649 | |||
| FUTY / Fidelity Covington Trust - Fidelity MSCI Utilities Index ETF | 0,01 | -98,04 | 0,59 | 5.290,91 | 0,2280 | -0,0942 | |||
| LLY / Eli Lilly and Company | 0,00 | -99,88 | 0,59 | 0,2266 | 0,2052 | ||||
| FMDE / Fidelity Covington Trust - Fidelity Enhanced Mid Cap ETF | 0,02 | -96,80 | 0,56 | 3.418,75 | 0,2166 | -0,2502 | |||
| GOOGL / Alphabet Inc. | 0,00 | -99,28 | 0,56 | 27.800,00 | 0,2144 | 0,1336 | |||
| PSX / Phillips 66 | 0,00 | -99,18 | 0,53 | 13.100,00 | 0,2030 | 0,0776 | |||
| FHLC / Fidelity Covington Trust - Fidelity MSCI Health Care Index ETF | 0,01 | -98,58 | 0,51 | 6.312,50 | 0,1974 | -0,0399 | |||
| JBHT / J.B. Hunt Transport Services, Inc. | 0,00 | -99,32 | 0,51 | 17.000,00 | 0,1972 | 0,0950 | |||
| NEE / NextEra Energy, Inc. | 0,01 | 0,51 | 0,1965 | 0,1965 | |||||
| SGOV / iShares Trust - iShares 0-3 Month Treasury Bond ETF | 0,01 | 0,51 | 0,1961 | 0,1961 | |||||
| MRK / Merck & Co., Inc. | 0,01 | -98,87 | 0,51 | 8.333,33 | 0,1944 | 0,0138 | |||
| SRE / Sempra | 0,01 | 4.530,15 | 0,48 | 2.881,25 | 0,1833 | 0,1707 | |||
| OBDC / Blue Owl Capital Corporation | 0,03 | -92,84 | 0,46 | 1.446,67 | 0,1785 | -0,7039 | |||
| MPW / Medical Properties Trust, Inc. | 0,11 | -67,27 | 0,45 | 754,72 | 0,1743 | -1,3501 | |||
| LMT / Lockheed Martin Corporation | 0,00 | -99,75 | 0,45 | 0,1720 | 0,1468 | ||||
| DGRO / iShares Trust - iShares Core Dividend Growth ETF | 0,01 | -98,38 | 0,44 | 7.250,00 | 0,1697 | -0,0276 | |||
| KR / The Kroger Co. | 0,01 | -98,50 | 0,43 | 8.420,00 | 0,1640 | -0,0030 | |||
| MDT / Medtronic plc | 0,00 | -99,44 | 0,42 | 4.555,56 | 0,1612 | -0,1120 | |||
| EBGEF / Enbridge Inc. - Preferred Stock | 0,01 | -97,42 | 0,42 | 5.100,00 | 0,1599 | -0,0697 | |||
| TSLA / Tesla, Inc. | 0,00 | -99,49 | 0,39 | 0,1480 | 0,1217 | ||||
| WMT / Walmart Inc. | 0,00 | -98,74 | 0,38 | 12.500,00 | 0,1454 | 0,0451 | |||
| VIG / Vanguard Specialized Funds - Vanguard Dividend Appreciation ETF | 0,00 | -99,48 | 0,37 | 36.900,00 | 0,1425 | 0,0916 | |||
| FANG / Diamondback Energy, Inc. | 0,00 | -99,94 | 0,34 | 1.256,00 | 0,1304 | -0,6028 | |||
| PYPL / PayPal Holdings, Inc. | 0,00 | -99,00 | 0,33 | 5.450,00 | 0,1281 | -0,0690 | |||
| XLU / The Select Sector SPDR Trust - The Utilities Select Sector SPDR Fund | 0,00 | -99,91 | 0,33 | 513,21 | 0,1250 | -1,3970 | |||
| QQQ / Invesco QQQ Trust, Series 1 | 0,00 | -99,79 | 0,32 | 0,1226 | 0,1060 | ||||
| ABT / Abbott Laboratories | 0,00 | -99,28 | 0,32 | 15.650,00 | 0,1213 | 0,0516 | |||
| JPM / JPMorgan Chase & Co. | 0,00 | -98,91 | 0,31 | 235,48 | 0,1200 | 0,0470 | |||
| GJR / Strats Trust For Procter & Gambel Security - Preferred Security | 0,00 | -99,34 | 0,30 | 30.000,00 | 0,1158 | 0,0675 | |||
| FREL / Fidelity Covington Trust - Fidelity MSCI Real Estate Index ETF | 0,01 | -96,98 | 0,27 | 2.336,36 | 0,1033 | -0,2388 | |||
| VZ / Verizon Communications Inc. | 0,01 | -99,19 | 0,26 | 1.506,25 | 0,0990 | -0,3663 | |||
| XOM / Exxon Mobil Corporation | 0,00 | -98,96 | 0,26 | 25.400,00 | 0,0982 | 0,0433 | |||
| MOD / Modine Manufacturing Company | 0,00 | 0,25 | 0,0965 | 0,0965 | |||||
| XBI / SPDR Series Trust - SPDR S&P Biotech ETF | 0,00 | -99,90 | 0,25 | 547,37 | 0,0948 | -1,0021 | |||
| JBL / Jabil Inc. | 0,00 | 0,24 | 0,0934 | 0,0934 | |||||
| COST / Costco Wholesale Corporation | 0,00 | -99,18 | 0,23 | 166,67 | 0,0893 | 0,0209 | |||
| HEFA / iShares Trust - iShares Currency Hedged MSCI EAFE ETF | 0,01 | -97,56 | 0,23 | 3.666,67 | 0,0872 | -0,1058 | |||
| DRLL / EA Series Trust - Strive U.S. Energy ETF | 0,01 | -95,93 | 0,23 | 3.666,67 | 0,0871 | -0,1102 | |||
| UBER / Uber Technologies, Inc. | 0,00 | 0,22 | 0,0842 | 0,0842 | |||||
| STXD / EA Series Trust - Strive 1000 Dividend Growth ETF | 0,01 | 0,21 | 0,0821 | 0,0821 | |||||
| WCBR / WisdomTree Trust - WisdomTree Cybersecurity Fund | 0,01 | 0,21 | 0,0813 | 0,0813 | |||||
| ELV / Elevance Health, Inc. | 0,00 | -99,75 | 0,20 | 0,0771 | 0,0635 | ||||
| CRBG / Corebridge Financial, Inc. | 0,00 | -100,00 | 0,00 | 0,0000 | |||||
| NXST / Nexstar Media Group, Inc. | 0,00 | -100,00 | 0,00 | 0,0000 |