Grundlæggende statistik
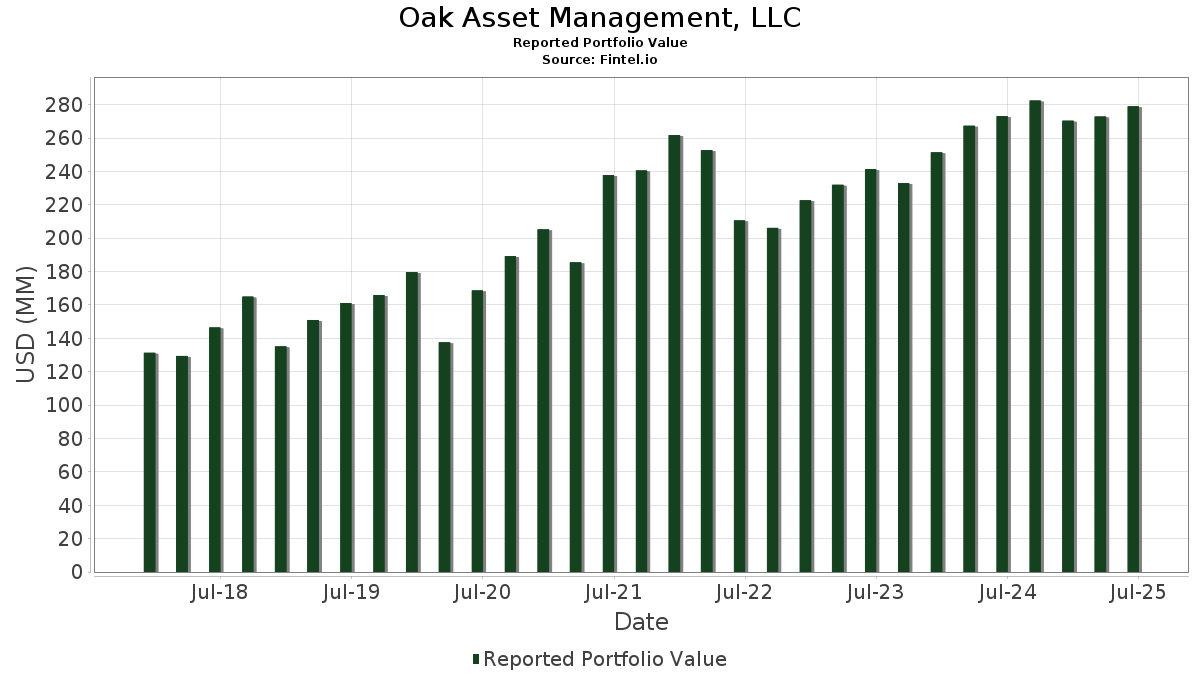
| Porteføljeværdi | $ 278.995.277 |
| Nuværende stillinger | 103 |
Seneste beholdninger, ydeevne, AUM (fra 13F, 13D)
Oak Asset Management, LLC har afsløret 103 samlede besiddelser i deres seneste SEC-arkivering. Den seneste porteføljeværdi er beregnet til at være $ 278.995.277 USD. Faktiske aktiver under forvaltning (AUM) er denne værdi plus kontanter (som ikke er oplyst). Oak Asset Management, LLCs største beholdninger er Apple Inc. (US:AAPL) , Amgen Inc. (US:AMGN) , NVIDIA Corporation (US:NVDA) , Chevron Corporation (US:CVX) , and QUALCOMM Incorporated (US:QCOM) . Oak Asset Management, LLCs nye stillinger omfatter Barrick Mining Corporation (BG:ABR0) , Vistra Corp. (US:VST) , Uber Technologies, Inc. (US:UBER) , .
Top øger dette kvartal
Vi bruger ændringen i porteføljeallokeringen, fordi dette er den mest meningsfulde metrik. Ændringer kan skyldes handler eller ændringer i aktiekurser.
| Sikkerhed | Aktier (MM) |
Værdi (MM$) |
Portefølje % | ΔPortefølje % |
|---|---|---|---|---|
| 0,10 | 15,37 | 5,5102 | 1,4609 | |
| 0,04 | 7,95 | 2,8497 | 0,9704 | |
| 0,02 | 7,86 | 2,8184 | 0,6279 | |
| 0,01 | 2,54 | 0,9105 | 0,3768 | |
| 0,01 | 2,59 | 0,9295 | 0,2712 | |
| 0,02 | 5,24 | 1,8795 | 0,2462 | |
| 0,03 | 1,96 | 0,7015 | 0,2129 | |
| 0,03 | 0,59 | 0,2127 | 0,2127 | |
| 0,02 | 2,48 | 0,8875 | 0,1363 | |
| 0,00 | 1,82 | 0,6516 | 0,1324 |
Top falder i dette kvartal
Vi bruger ændringen i porteføljeallokeringen, fordi dette er den mest meningsfulde metrik. Ændringer kan skyldes handler eller ændringer i aktiekurser.
| Sikkerhed | Aktier (MM) |
Værdi (MM$) |
Portefølje % | ΔPortefølje % |
|---|---|---|---|---|
| 0,15 | 30,17 | 10,8133 | -1,2869 | |
| 0,06 | 16,97 | 6,0827 | -0,8176 | |
| 0,08 | 11,70 | 4,1948 | -0,8065 | |
| 0,04 | 6,84 | 2,4499 | -0,3919 | |
| 0,00 | 1,37 | 0,4902 | -0,3571 | |
| 0,01 | 0,96 | 0,3428 | -0,2529 | |
| 0,02 | 5,34 | 1,9143 | -0,1972 | |
| 0,06 | 9,38 | 3,3618 | -0,1695 | |
| 0,02 | 2,97 | 1,0660 | -0,1589 | |
| 0,03 | 4,05 | 1,4503 | -0,1534 |
13F og Fondsarkivering
Denne formular blev indsendt den 2025-07-11 for rapporteringsperioden 2025-06-30. Klik på linkikonet for at se den fulde transaktionshistorik.
Opgrader for at låse op for premium-data og eksportere til Excel ![]() .
.
| Sikkerhed | Type | Gennemsnitlig aktiekurs | Aktier (MM) |
Δ Aktier (%) |
Δ Aktier (%) |
Værdi ($MM) |
Portefølje (%) |
ΔPortefølje (%) |
|
|---|---|---|---|---|---|---|---|---|---|
| AAPL / Apple Inc. | 0,15 | -1,07 | 30,17 | -8,62 | 10,8133 | -1,2869 | |||
| AMGN / Amgen Inc. | 0,06 | 0,58 | 16,97 | -9,86 | 6,0827 | -0,8176 | |||
| NVDA / NVIDIA Corporation | 0,10 | -4,55 | 15,37 | 39,15 | 5,5102 | 1,4609 | |||
| CVX / Chevron Corporation | 0,08 | 0,20 | 11,70 | -14,24 | 4,1948 | -0,8065 | |||
| QCOM / QUALCOMM Incorporated | 0,06 | -0,45 | 9,90 | 3,21 | 3,5478 | 0,0329 | |||
| RTX / RTX Corporation | 0,06 | -11,70 | 9,38 | -2,66 | 3,3618 | -0,1695 | |||
| ORCL / Oracle Corporation | 0,04 | -0,85 | 7,95 | 55,06 | 2,8497 | 0,9704 | |||
| FAST / Fastenal Company | 0,19 | 96,76 | 7,91 | 6,56 | 2,8352 | 0,1147 | |||
| MSFT / Microsoft Corporation | 0,02 | -0,71 | 7,86 | 31,58 | 2,8184 | 0,6279 | |||
| SYK / Stryker Corporation | 0,02 | -1,62 | 7,15 | 4,56 | 2,5640 | 0,0566 | |||
| ABBV / AbbVie Inc. | 0,04 | -0,50 | 6,84 | -11,84 | 2,4499 | -0,3919 | |||
| V / Visa Inc. | 0,02 | 0,58 | 5,82 | 1,89 | 2,0859 | -0,0073 | |||
| MCD / McDonald's Corporation | 0,02 | -0,89 | 5,34 | -7,31 | 1,9143 | -0,1972 | |||
| JPM / JPMorgan Chase & Co. | 0,02 | -0,44 | 5,24 | 17,66 | 1,8795 | 0,2462 | |||
| LOW / Lowe's Companies, Inc. | 0,02 | -0,12 | 4,78 | -4,99 | 1,7150 | -0,1305 | |||
| FDX / FedEx Corporation | 0,02 | 0,62 | 4,76 | -6,17 | 1,7058 | -0,1532 | |||
| ICE / Intercontinental Exchange, Inc. | 0,02 | -10,32 | 4,48 | -4,62 | 1,6069 | -0,1157 | |||
| ISRG / Intuitive Surgical, Inc. | 0,01 | -1,32 | 4,05 | 8,25 | 1,4530 | 0,0808 | |||
| JNJ / Johnson & Johnson | 0,03 | 0,40 | 4,05 | -7,52 | 1,4503 | -0,1534 | |||
| COST / Costco Wholesale Corporation | 0,00 | -1,38 | 3,97 | 3,23 | 1,4221 | 0,0134 | |||
| CVS / CVS Health Corporation | 0,05 | -0,32 | 3,55 | 1,52 | 1,2721 | -0,0095 | |||
| HD / The Home Depot, Inc. | 0,01 | 0,36 | 3,54 | 0,40 | 1,2704 | -0,0234 | |||
| MDT / Medtronic plc | 0,04 | 0,55 | 3,51 | -2,47 | 1,2591 | -0,0608 | |||
| AMT / American Tower Corporation | 0,01 | -0,03 | 3,23 | 1,54 | 1,1572 | -0,0081 | |||
| GJR / Strats Trust For Procter & Gambel Security - Preferred Security | 0,02 | 1,94 | 3,13 | -4,69 | 1,1231 | -0,0819 | |||
| CSCO / Cisco Systems, Inc. | 0,04 | -0,63 | 3,01 | 11,74 | 1,0779 | 0,0914 | |||
| NSC / Norfolk Southern Corporation | 0,01 | 0,00 | 3,01 | 8,05 | 1,0773 | 0,0580 | |||
| STZ / Constellation Brands, Inc. | 0,02 | 0,38 | 2,97 | -11,01 | 1,0660 | -0,1589 | |||
| AMZN / Amazon.com, Inc. | 0,01 | 0,30 | 2,88 | 15,66 | 1,0328 | 0,1197 | |||
| DGRO / iShares Trust - iShares Core Dividend Growth ETF | 0,04 | 0,65 | 2,87 | 4,18 | 1,0284 | 0,0189 | |||
| CMCSA / Comcast Corporation | 0,08 | 3,82 | 2,79 | 0,43 | 1,0005 | -0,0183 | |||
| PEP / PepsiCo, Inc. | 0,02 | 0,47 | 2,66 | -11,54 | 0,9539 | -0,1485 | |||
| TGT / Target Corporation | 0,03 | 2,32 | 2,66 | -3,28 | 0,9529 | -0,0545 | |||
| GOOGL / Alphabet Inc. | 0,01 | 26,69 | 2,59 | 44,38 | 0,9295 | 0,2712 | |||
| GOOG / Alphabet Inc. | 0,01 | 53,65 | 2,54 | 74,45 | 0,9105 | 0,3768 | |||
| MS / Morgan Stanley | 0,02 | 0,06 | 2,48 | 20,84 | 0,8875 | 0,1363 | |||
| CAT / Caterpillar Inc. | 0,01 | -0,41 | 2,37 | 17,24 | 0,8481 | 0,1084 | |||
| CTAS / Cintas Corporation | 0,01 | 3,89 | 2,08 | 12,70 | 0,7441 | 0,0687 | |||
| WM / Waste Management, Inc. | 0,01 | 0,00 | 2,01 | -1,18 | 0,7207 | -0,0249 | |||
| CHD / Church & Dwight Co., Inc. | 0,02 | 0,00 | 2,01 | -12,68 | 0,7205 | -0,1234 | |||
| TROW / T. Rowe Price Group, Inc. | 0,02 | 0,00 | 1,96 | 5,05 | 0,7016 | 0,0186 | |||
| MCHP / Microchip Technology Incorporated | 0,03 | 1,00 | 1,96 | 46,81 | 0,7015 | 0,2129 | |||
| VZ / Verizon Communications Inc. | 0,04 | -0,06 | 1,93 | -4,64 | 0,6932 | -0,0503 | |||
| EXPD / Expeditors International of Washington, Inc. | 0,02 | -0,48 | 1,91 | -5,43 | 0,6863 | -0,0558 | |||
| META / Meta Platforms, Inc. | 0,00 | 0,20 | 1,82 | 28,32 | 0,6516 | 0,1324 | |||
| XOM / Exxon Mobil Corporation | 0,02 | -0,92 | 1,74 | -10,19 | 0,6222 | -0,0862 | |||
| NKE / NIKE, Inc. | 0,02 | -0,31 | 1,69 | 11,50 | 0,6050 | 0,0505 | |||
| GPC / Genuine Parts Company | 0,01 | 0,64 | 1,63 | 2,51 | 0,5853 | 0,0012 | |||
| ITW / Illinois Tool Works Inc. | 0,01 | 1,25 | 1,50 | 0,94 | 0,5364 | -0,0069 | |||
| AFL / Aflac Incorporated | 0,01 | -0,64 | 1,43 | -5,75 | 0,5116 | -0,0435 | |||
| BKNG / Booking Holdings Inc. | 0,00 | 0,00 | 1,42 | 25,71 | 0,5084 | 0,0947 | |||
| INTC / Intel Corporation | 0,06 | -4,03 | 1,38 | -5,35 | 0,4949 | -0,0397 | |||
| UNH / UnitedHealth Group Incorporated | 0,00 | -0,68 | 1,37 | -40,85 | 0,4902 | -0,3571 | |||
| ABT / Abbott Laboratories | 0,01 | 0,00 | 1,29 | 2,55 | 0,4613 | 0,0013 | |||
| IBM / International Business Machines Corporation | 0,00 | 0,05 | 1,20 | 18,60 | 0,4301 | 0,0593 | |||
| WMT / Walmart Inc. | 0,01 | 0,00 | 1,15 | 11,33 | 0,4124 | 0,0338 | |||
| GSCE / GS Connect S&P GSCI Enhanced Commodity Total Return ETN | 0,00 | 0,00 | 1,15 | 29,64 | 0,4110 | 0,0866 | |||
| AXP / American Express Company | 0,00 | 0,00 | 1,14 | 18,48 | 0,4093 | 0,0563 | |||
| NFLX / Netflix, Inc. | 0,00 | 3,95 | 1,09 | 49,18 | 0,3917 | 0,1234 | |||
| ADP / Automatic Data Processing, Inc. | 0,00 | 6,81 | 1,06 | 7,81 | 0,3814 | 0,0197 | |||
| DIS / The Walt Disney Company | 0,01 | -53,17 | 0,96 | -41,17 | 0,3428 | -0,2529 | |||
| LMT / Lockheed Martin Corporation | 0,00 | 1,04 | 0,90 | 4,79 | 0,3215 | 0,0077 | |||
| BRK.A / Berkshire Hathaway Inc. | 0,00 | 0,00 | 0,89 | -8,78 | 0,3204 | -0,0388 | |||
| SBUX / Starbucks Corporation | 0,01 | 0,00 | 0,83 | -6,56 | 0,2962 | -0,0280 | |||
| COR / Cencora, Inc. | 0,00 | -20,06 | 0,81 | -13,80 | 0,2891 | -0,0539 | |||
| REGN / Regeneron Pharmaceuticals, Inc. | 0,00 | -7,65 | 0,79 | -23,55 | 0,2841 | -0,0959 | |||
| PNC / The PNC Financial Services Group, Inc. | 0,00 | 0,00 | 0,77 | 6,10 | 0,2744 | 0,0098 | |||
| DLR / Digital Realty Trust, Inc. | 0,00 | -12,21 | 0,69 | 6,82 | 0,2470 | 0,0105 | |||
| DPZ / Domino's Pizza, Inc. | 0,00 | -0,65 | 0,69 | -2,55 | 0,2466 | -0,0122 | |||
| SAIC / Science Applications International Corporation | 0,01 | 0,00 | 0,67 | 0,30 | 0,2391 | -0,0046 | |||
| IJH / iShares Trust - iShares Core S&P Mid-Cap ETF | 0,01 | 0,63 | 0,64 | 7,04 | 0,2291 | 0,0101 | |||
| TSLA / Tesla, Inc. | 0,00 | 0,00 | 0,61 | 22,60 | 0,2200 | 0,0365 | |||
| NEE / NextEra Energy, Inc. | 0,01 | 0,99 | 0,60 | -0,99 | 0,2155 | -0,0073 | |||
| ABR0 / Barrick Mining Corporation | 0,03 | 0,59 | 0,2127 | 0,2127 | |||||
| BAC / Bank of America Corporation | 0,01 | 0,00 | 0,54 | 13,35 | 0,1920 | 0,0189 | |||
| TOL / Toll Brothers, Inc. | 0,00 | 0,00 | 0,52 | 8,04 | 0,1882 | 0,0102 | |||
| VIG / Vanguard Specialized Funds - Vanguard Dividend Appreciation ETF | 0,00 | 0,00 | 0,51 | 5,43 | 0,1814 | 0,0056 | |||
| SPY / SPDR S&P 500 ETF | 0,00 | 13,87 | 0,48 | 25,59 | 0,1727 | 0,0323 | |||
| KO / The Coca-Cola Company | 0,01 | 0,00 | 0,40 | -1,23 | 0,1436 | -0,0050 | |||
| VV / Vanguard Index Funds - Vanguard Large-Cap ETF | 0,00 | 0,00 | 0,39 | 11,17 | 0,1392 | 0,0110 | |||
| T / AT&T Inc. | 0,01 | -1,25 | 0,38 | 1,07 | 0,1360 | -0,0016 | |||
| PH / Parker-Hannifin Corporation | 0,00 | -8,73 | 0,37 | 4,89 | 0,1309 | 0,0033 | |||
| ATO / Atmos Energy Corporation | 0,00 | -25,26 | 0,34 | -25,39 | 0,1201 | -0,0447 | |||
| SDY / SPDR Series Trust - SPDR S&P Dividend ETF | 0,00 | 0,00 | 0,33 | 0,00 | 0,1180 | -0,0026 | |||
| CEG / Constellation Energy Corporation | 0,00 | 0,31 | 0,1128 | 0,1128 | |||||
| VST / Vistra Corp. | 0,00 | 0,31 | 0,1114 | 0,1114 | |||||
| MRK / Merck & Co., Inc. | 0,00 | 0,00 | 0,31 | -11,93 | 0,1114 | -0,0178 | |||
| CMI / Cummins Inc. | 0,00 | 0,00 | 0,30 | 4,61 | 0,1058 | 0,0023 | |||
| EQR / Equity Residential | 0,00 | 0,00 | 0,29 | -5,77 | 0,1054 | -0,0089 | |||
| IUSG / iShares Trust - iShares Core S&P U.S. Growth ETF | 0,00 | 1,83 | 0,28 | 20,85 | 0,1019 | 0,0154 | |||
| URI / United Rentals, Inc. | 0,00 | 0,00 | 0,28 | 20,17 | 0,1005 | 0,0150 | |||
| UNP / Union Pacific Corporation | 0,00 | 0,00 | 0,27 | -2,53 | 0,0968 | -0,0048 | |||
| SRE / Sempra | 0,00 | 0,00 | 0,26 | 6,20 | 0,0923 | 0,0034 | |||
| PFE / Pfizer Inc. | 0,01 | -13,47 | 0,26 | -17,42 | 0,0921 | -0,0217 | |||
| EW / Edwards Lifesciences Corporation | 0,00 | 0,00 | 0,25 | 8,23 | 0,0897 | 0,0047 | |||
| VUG / Vanguard Index Funds - Vanguard Growth ETF | 0,00 | 0,00 | 0,24 | 18,14 | 0,0866 | 0,0117 | |||
| FBIN / Fortune Brands Innovations, Inc. | 0,00 | 0,00 | 0,23 | -15,38 | 0,0828 | -0,0173 | |||
| IUSV / iShares Trust - iShares Core S&P U.S. Value ETF | 0,00 | 3,46 | 0,23 | 6,02 | 0,0822 | 0,0030 | |||
| VLO / Valero Energy Corporation | 0,00 | -8,12 | 0,22 | -6,33 | 0,0796 | -0,0074 | |||
| VNQ / Vanguard Specialized Funds - Vanguard Real Estate ETF | 0,00 | 7,58 | 0,22 | 6,25 | 0,0793 | 0,0027 | |||
| ADBE / Adobe Inc. | 0,00 | 0,00 | 0,22 | 0,93 | 0,0782 | -0,0011 | |||
| MDLZ / Mondelez International, Inc. | 0,00 | 0,00 | 0,22 | -0,92 | 0,0777 | -0,0022 | |||
| UBER / Uber Technologies, Inc. | 0,00 | 0,21 | 0,0744 | 0,0744 | |||||
| BABA / Alibaba Group Holding Limited - Depositary Receipt (Common Stock) | 0,00 | -100,00 | 0,00 | 0,0000 | |||||
| GOLD / Barrick Mining Corporation | 0,00 | -100,00 | 0,00 | 0,0000 |