Grundlæggende statistik
| Porteføljeværdi | $ 2.275.369.467 |
| Nuværende stillinger | 109 |
Seneste beholdninger, ydeevne, AUM (fra 13F, 13D)
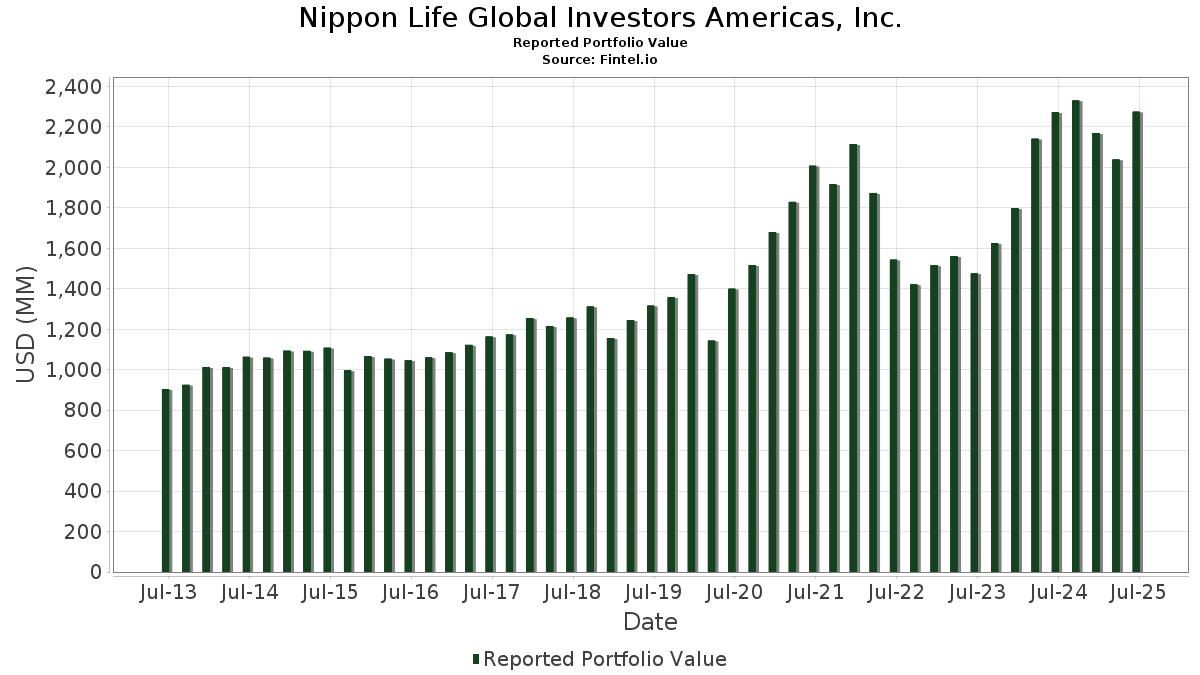
Nippon Life Global Investors Americas, Inc. har afsløret 109 samlede besiddelser i deres seneste SEC-arkivering. Den seneste porteføljeværdi er beregnet til at være $ 2.275.369.467 USD. Faktiske aktiver under forvaltning (AUM) er denne værdi plus kontanter (som ikke er oplyst). Nippon Life Global Investors Americas, Inc.s største beholdninger er Microsoft Corporation (US:MSFT) , NVIDIA Corporation (US:NVDA) , Amazon.com, Inc. (US:AMZN) , Meta Platforms, Inc. (US:META) , and Apple Inc. (US:AAPL) . Nippon Life Global Investors Americas, Inc.s nye stillinger omfatter GE HealthCare Technologies Inc. (US:GEHC) , Exact Sciences Corporation (US:EXAS) , F5, Inc. (US:FFIV) , Rollins, Inc. (US:ROL) , and Phillips 66 (US:PSX) .
Top øger dette kvartal
Vi bruger ændringen i porteføljeallokeringen, fordi dette er den mest meningsfulde metrik. Ændringer kan skyldes handler eller ændringer i aktiekurser.
| Sikkerhed | Aktier (MM) |
Værdi (MM$) |
Portefølje % | ΔPortefølje % |
|---|---|---|---|---|
| 0,24 | 67,24 | 2,9552 | 1,9644 | |
| 1,11 | 174,95 | 7,6889 | 1,9041 | |
| 0,08 | 47,03 | 2,0669 | 1,7171 | |
| 0,16 | 33,56 | 1,4750 | 1,4750 | |
| 0,40 | 29,75 | 1,3075 | 1,3075 | |
| 0,11 | 79,84 | 3,5088 | 1,2785 | |
| 0,38 | 191,03 | 8,3956 | 1,2516 | |
| 0,62 | 26,02 | 1,1437 | 1,1437 | |
| 0,15 | 28,89 | 1,2697 | 1,0317 | |
| 0,08 | 18,30 | 0,8044 | 0,8044 |
Top falder i dette kvartal
Vi bruger ændringen i porteføljeallokeringen, fordi dette er den mest meningsfulde metrik. Ændringer kan skyldes handler eller ændringer i aktiekurser.
| Sikkerhed | Aktier (MM) |
Værdi (MM$) |
Portefølje % | ΔPortefølje % |
|---|---|---|---|---|
| 0,24 | 42,70 | 1,8764 | -1,6251 | |
| 0,02 | 6,23 | 0,2736 | -1,2669 | |
| 0,04 | 5,50 | 0,2419 | -1,1981 | |
| 0,37 | 75,77 | 3,3298 | -1,0653 | |
| 0,19 | 34,34 | 1,5093 | -0,9460 | |
| 0,04 | 0,99 | 0,0435 | -0,7704 | |
| 0,18 | 44,76 | 1,9671 | -0,7620 | |
| 0,12 | 31,76 | 1,3959 | -0,6705 | |
| 0,02 | 2,76 | 0,1211 | -0,6517 | |
| 0,04 | 9,53 | 0,4188 | -0,6172 |
13F og Fondsarkivering
Denne formular blev indsendt den 2025-08-14 for rapporteringsperioden 2025-06-30. Klik på linkikonet for at se den fulde transaktionshistorik.
Opgrader for at låse op for premium-data og eksportere til Excel ![]() .
.
| Sikkerhed | Type | Gennemsnitlig aktiekurs | Aktier (MM) |
Δ Aktier (%) |
Δ Aktier (%) |
Værdi ($MM) |
Portefølje (%) |
ΔPortefølje (%) |
|
|---|---|---|---|---|---|---|---|---|---|
| MSFT / Microsoft Corporation | 0,38 | -1,02 | 191,03 | 31,15 | 8,3956 | 1,2516 | |||
| NVDA / NVIDIA Corporation | 1,11 | 1,76 | 174,95 | 48,33 | 7,6889 | 1,9041 | |||
| AMZN / Amazon.com, Inc. | 0,53 | 1,24 | 116,42 | 16,75 | 5,1165 | 0,2256 | |||
| META / Meta Platforms, Inc. | 0,11 | 37,10 | 79,84 | 75,57 | 3,5088 | 1,2785 | |||
| AAPL / Apple Inc. | 0,37 | -8,46 | 75,77 | -15,45 | 3,3298 | -1,0653 | |||
| INTU / Intuit Inc. | 0,09 | -5,43 | 69,28 | 21,31 | 3,0448 | 0,2439 | |||
| MMM / 3M Company | 0,45 | 5,70 | 69,17 | 9,57 | 3,0399 | -0,0563 | |||
| COST / Costco Wholesale Corporation | 0,07 | -0,26 | 67,51 | 4,39 | 2,9672 | -0,2048 | |||
| AVGO / Broadcom Inc. | 0,24 | 102,17 | 67,24 | 232,85 | 2,9552 | 1,9644 | |||
| NOW / ServiceNow, Inc. | 0,06 | -4,59 | 62,02 | 23,21 | 2,7259 | 0,2569 | |||
| NFLX / Netflix, Inc. | 0,04 | -15,64 | 59,24 | 21,15 | 2,6037 | 0,2052 | |||
| LLY / Eli Lilly and Company | 0,07 | 6,89 | 58,15 | 0,89 | 2,5558 | -0,2713 | |||
| JPM / JPMorgan Chase & Co. | 0,19 | 4,61 | 53,90 | 23,64 | 2,3688 | 0,2307 | |||
| MDT / Medtronic plc | 0,58 | 35,09 | 50,82 | 31,09 | 2,2335 | 0,3321 | |||
| WFC / Wells Fargo & Company | 0,61 | 54,99 | 48,58 | 72,98 | 2,1350 | 0,7576 | |||
| MA / Mastercard Incorporated | 0,08 | 543,27 | 47,03 | 559,49 | 2,0669 | 1,7171 | |||
| DIS / The Walt Disney Company | 0,36 | 17,41 | 45,15 | 48,05 | 1,9843 | 0,4886 | |||
| RSG / Republic Services, Inc. | 0,18 | -21,01 | 44,76 | -19,56 | 1,9671 | -0,7620 | |||
| GOOG / Alphabet Inc. | 0,24 | -47,33 | 42,70 | -40,20 | 1,8764 | -1,6251 | |||
| CAH / Cardinal Health, Inc. | 0,21 | -32,95 | 35,19 | -18,23 | 1,5467 | -0,5643 | |||
| RCL / Royal Caribbean Cruises Ltd. | 0,11 | -16,30 | 34,63 | 27,41 | 1,5220 | 0,1889 | |||
| ICE / Intercontinental Exchange, Inc. | 0,19 | -35,50 | 34,34 | -31,40 | 1,5093 | -0,9460 | |||
| BA / The Boeing Company | 0,16 | 33,56 | 1,4750 | 1,4750 | |||||
| WMT / Walmart Inc. | 0,34 | 0,18 | 32,96 | 11,32 | 1,4485 | -0,0037 | |||
| PGR / The Progressive Corporation | 0,12 | -20,05 | 31,76 | -24,61 | 1,3959 | -0,6705 | |||
| GEHC / GE HealthCare Technologies Inc. | 0,40 | 29,75 | 1,3075 | 1,3075 | |||||
| VST / Vistra Corp. | 0,15 | 260,75 | 28,89 | 495,40 | 1,2697 | 1,0317 | |||
| CBRE / CBRE Group, Inc. | 0,19 | -5,22 | 26,61 | 1,55 | 1,1696 | -0,1157 | |||
| FMC / FMC Corporation | 0,62 | 26,02 | 1,1437 | 1,1437 | |||||
| TJX / The TJX Companies, Inc. | 0,20 | -7,31 | 24,95 | -6,03 | 1,0967 | -0,2057 | |||
| C / Citigroup Inc. | 0,27 | 169,09 | 22,75 | 222,64 | 0,9997 | 0,6539 | |||
| LRCX / Lam Research Corporation | 0,23 | 5,91 | 22,06 | 41,69 | 0,9695 | 0,2059 | |||
| MRVL / Marvell Technology, Inc. | 0,28 | -20,13 | 21,95 | 0,41 | 0,9646 | -0,1075 | |||
| TSLA / Tesla, Inc. | 0,07 | 19,58 | 21,76 | 46,58 | 0,9565 | 0,2283 | |||
| EQT / EQT Corporation | 0,35 | 360,06 | 20,64 | 402,26 | 0,9073 | 0,7056 | |||
| MPC / Marathon Petroleum Corporation | 0,11 | 343,59 | 18,63 | 405,76 | 0,8187 | 0,6380 | |||
| TMUS / T-Mobile US, Inc. | 0,08 | 18,30 | 0,8044 | 0,8044 | |||||
| CTAS / Cintas Corporation | 0,08 | 0,96 | 17,38 | 9,47 | 0,7638 | -0,0148 | |||
| DOCU / DocuSign, Inc. | 0,22 | 24,72 | 16,92 | 19,34 | 0,7435 | 0,0482 | |||
| KO / The Coca-Cola Company | 0,24 | 0,00 | 16,76 | -1,21 | 0,7365 | -0,0955 | |||
| AXP / American Express Company | 0,05 | -1,29 | 15,59 | 17,03 | 0,6851 | 0,0318 | |||
| IRM / Iron Mountain Incorporated | 0,15 | 152,72 | 15,29 | 200,67 | 0,6718 | 0,4225 | |||
| GS / The Goldman Sachs Group, Inc. | 0,02 | -19,55 | 14,83 | 4,23 | 0,6516 | -0,0461 | |||
| CEG / Constellation Energy Corporation | 0,05 | -63,28 | 14,76 | -41,22 | 0,6488 | -0,5830 | |||
| APH / Amphenol Corporation | 0,15 | -6,19 | 14,75 | 41,14 | 0,6484 | 0,1357 | |||
| LIN / Linde plc | 0,03 | 46,68 | 13,67 | 47,80 | 0,6007 | 0,1471 | |||
| AON / Aon plc | 0,04 | 54,87 | 12,53 | 38,44 | 0,5505 | 0,1068 | |||
| AMP / Ameriprise Financial, Inc. | 0,02 | -19,02 | 12,12 | -10,72 | 0,5325 | -0,1331 | |||
| MAR / Marriott International, Inc. | 0,04 | -0,55 | 10,77 | 14,06 | 0,4734 | 0,0102 | |||
| AZO / AutoZone, Inc. | 0,00 | -4,65 | 10,65 | -7,16 | 0,4682 | -0,0946 | |||
| EXC / Exelon Corporation | 0,24 | 10,41 | 0,4577 | 0,4577 | |||||
| IQV / IQVIA Holdings Inc. | 0,06 | 30,67 | 9,75 | 16,81 | 0,4285 | 0,0191 | |||
| CMG / Chipotle Mexican Grill, Inc. | 0,17 | -1,28 | 9,57 | 10,40 | 0,4208 | -0,0046 | |||
| GE / General Electric Company | 0,04 | -64,86 | 9,53 | -54,89 | 0,4188 | -0,6172 | |||
| FLS / Flowserve Corporation | 0,16 | 27,42 | 8,63 | 36,56 | 0,3793 | 0,0693 | |||
| ABBV / AbbVie Inc. | 0,04 | 0,58 | 8,34 | -10,90 | 0,3666 | -0,0925 | |||
| MDLZ / Mondelez International, Inc. | 0,12 | -6,16 | 7,93 | -6,73 | 0,3487 | -0,0685 | |||
| PLNT / Planet Fitness, Inc. | 0,07 | 12,85 | 7,27 | 27,39 | 0,3195 | 0,0396 | |||
| APO / Apollo Global Management, Inc. | 0,05 | 6,94 | 0,3050 | 0,3050 | |||||
| ECL / Ecolab Inc. | 0,02 | -81,52 | 6,23 | -80,18 | 0,2736 | -1,2669 | |||
| MCD / McDonald's Corporation | 0,02 | 0,00 | 6,04 | -6,46 | 0,2654 | -0,0513 | |||
| DXCM / DexCom, Inc. | 0,06 | 5,60 | 0,2459 | 0,2459 | |||||
| CVX / Chevron Corporation | 0,04 | -78,10 | 5,50 | -81,25 | 0,2419 | -1,1981 | |||
| ZTS / Zoetis Inc. | 0,03 | -10,02 | 5,44 | -14,77 | 0,2389 | -0,0739 | |||
| EXAS / Exact Sciences Corporation | 0,10 | 5,28 | 0,2322 | 0,2322 | |||||
| CVS / CVS Health Corporation | 0,07 | 5,01 | 0,2201 | 0,2201 | |||||
| EW / Edwards Lifesciences Corporation | 0,06 | -11,74 | 4,79 | -4,75 | 0,2107 | -0,0362 | |||
| ADI / Analog Devices, Inc. | 0,02 | 443,47 | 4,26 | 541,78 | 0,1870 | 0,1545 | |||
| COP / ConocoPhillips | 0,04 | 20,97 | 3,73 | 3,38 | 0,1641 | -0,0131 | |||
| BAC / Bank of America Corporation | 0,08 | -7,35 | 3,68 | 5,08 | 0,1618 | -0,0101 | |||
| FFIV / F5, Inc. | 0,01 | 3,41 | 0,1498 | 0,1498 | |||||
| ROL / Rollins, Inc. | 0,05 | 3,08 | 0,1353 | 0,1353 | |||||
| TRGP / Targa Resources Corp. | 0,02 | -79,86 | 2,76 | -82,51 | 0,1211 | -0,6517 | |||
| GGG / Graco Inc. | 0,03 | 8,27 | 2,43 | 11,46 | 0,1068 | -0,0001 | |||
| ETN / Eaton Corporation plc | 0,01 | 5,89 | 2,31 | 39,10 | 0,1015 | 0,0201 | |||
| TMO / Thermo Fisher Scientific Inc. | 0,00 | -75,34 | 1,81 | -79,92 | 0,0797 | -0,3631 | |||
| ACN / Accenture plc | 0,01 | 17,67 | 1,75 | 12,75 | 0,0770 | 0,0008 | |||
| HD / The Home Depot, Inc. | 0,00 | 1,68 | 0,0736 | 0,0736 | |||||
| PG / The Procter & Gamble Company | 0,01 | 0,90 | 1,60 | -5,71 | 0,0704 | -0,0129 | |||
| OTIS / Otis Worldwide Corporation | 0,02 | -80,38 | 1,58 | -81,18 | 0,0695 | -0,3427 | |||
| V / Visa Inc. | 0,00 | 0,23 | 1,54 | 1,59 | 0,0676 | -0,0067 | |||
| AMT / American Tower Corporation | 0,01 | -15,63 | 1,42 | -13,58 | 0,0624 | -0,0182 | |||
| AMD / Advanced Micro Devices, Inc. | 0,01 | 19,69 | 1,31 | 65,32 | 0,0576 | 0,0187 | |||
| T / AT&T Inc. | 0,04 | 1,30 | 0,0571 | 0,0571 | |||||
| CME / CME Group Inc. | 0,00 | -2,08 | 1,30 | 1,72 | 0,0571 | -0,0055 | |||
| PTC / PTC Inc. | 0,01 | -13,55 | 1,26 | -3,88 | 0,0556 | -0,0089 | |||
| TT / Trane Technologies plc | 0,00 | -16,18 | 1,13 | 8,74 | 0,0498 | -0,0013 | |||
| AIZ / Assurant, Inc. | 0,01 | 2,00 | 1,11 | -3,98 | 0,0488 | -0,0079 | |||
| WSC / WillScot Holdings Corporation | 0,04 | -93,94 | 0,99 | -94,03 | 0,0435 | -0,7704 | |||
| CDNS / Cadence Design Systems, Inc. | 0,00 | 27,38 | 0,99 | 54,53 | 0,0435 | 0,0120 | |||
| EQIX / Equinix, Inc. | 0,00 | -1,59 | 0,99 | -3,99 | 0,0434 | -0,0070 | |||
| SRE / Sempra | 0,01 | 0,95 | 0,0417 | 0,0417 | |||||
| TXN / Texas Instruments Incorporated | 0,00 | -25,69 | 0,83 | -14,20 | 0,0367 | -0,0110 | |||
| SHW / The Sherwin-Williams Company | 0,00 | 2,13 | 0,82 | 0,49 | 0,0362 | -0,0040 | |||
| AME / AMETEK, Inc. | 0,00 | -9,61 | 0,75 | -4,95 | 0,0329 | -0,0057 | |||
| BURL / Burlington Stores, Inc. | 0,00 | -10,86 | 0,74 | -12,98 | 0,0327 | -0,0092 | |||
| PSX / Phillips 66 | 0,01 | 0,73 | 0,0319 | 0,0319 | |||||
| ORLY / O'Reilly Automotive, Inc. | 0,01 | 948,00 | 0,71 | -34,08 | 0,0311 | -0,0216 | |||
| CHD / Church & Dwight Co., Inc. | 0,01 | -17,69 | 0,71 | -28,18 | 0,0310 | -0,0172 | |||
| BKNG / Booking Holdings Inc. | 0,00 | 0,00 | 0,69 | 25,72 | 0,0305 | 0,0034 | |||
| AMAT / Applied Materials, Inc. | 0,00 | 21,09 | 0,65 | 52,82 | 0,0286 | 0,0077 | |||
| XOM / Exxon Mobil Corporation | 0,01 | -45,24 | 0,65 | -50,34 | 0,0286 | -0,0357 | |||
| ON / ON Semiconductor Corporation | 0,01 | -4,43 | 0,63 | 23,15 | 0,0278 | 0,0026 | |||
| CTRA / Coterra Energy Inc. | 0,02 | 56,79 | 0,52 | 37,77 | 0,0228 | 0,0043 | |||
| TPR / Tapestry, Inc. | 0,01 | 0,50 | 0,0222 | 0,0222 | |||||
| ULTA / Ulta Beauty, Inc. | 0,00 | -44,20 | 0,47 | -28,81 | 0,0208 | -0,0118 | |||
| SPGI / S&P Global Inc. | 0,00 | -33,90 | 0,41 | -31,39 | 0,0181 | -0,0113 | |||
| LNG / Cheniere Energy, Inc. | 0,00 | -19,44 | 0,28 | -15,32 | 0,0124 | -0,0039 | |||
| ONON / On Holding AG | 0,01 | 0,27 | 0,0120 | 0,0120 | |||||
| FICO / Fair Isaac Corporation | 0,00 | -100,00 | 0,00 | 0,0000 | |||||
| ESS / Essex Property Trust, Inc. | 0,00 | -100,00 | 0,00 | 0,0000 | |||||
| DD / DuPont de Nemours, Inc. | 0,00 | -100,00 | 0,00 | 0,0000 | |||||
| NEE / NextEra Energy, Inc. | 0,00 | -100,00 | 0,00 | 0,0000 | |||||
| INSP / Inspire Medical Systems, Inc. | 0,00 | -100,00 | 0,00 | 0,0000 | |||||
| BDX / Becton, Dickinson and Company | 0,00 | -100,00 | 0,00 | 0,0000 | |||||
| LULU / lululemon athletica inc. | 0,00 | -100,00 | 0,00 | 0,0000 | |||||
| MRK / Merck & Co., Inc. | 0,00 | -100,00 | 0,00 | 0,0000 | |||||
| XYZ / Block, Inc. | 0,00 | -100,00 | 0,00 | 0,0000 | |||||
| FTI / TechnipFMC plc | 0,00 | -100,00 | 0,00 | 0,0000 | |||||
| NI / NiSource Inc. | 0,00 | -100,00 | 0,00 | 0,0000 | |||||
| FI / Fiserv, Inc. | 0,00 | -100,00 | 0,00 | 0,0000 | |||||
| PNC / The PNC Financial Services Group, Inc. | 0,00 | -100,00 | 0,00 | 0,0000 | |||||
| UNH / UnitedHealth Group Incorporated | 0,00 | -100,00 | 0,00 | 0,0000 |